

Intraspecific Variability of Xylem Hydraulic Traits of Calligonum mongolicum Growing in the Desert of Northern Xinjiang, China
- PMID: 39519923
- PMCID: PMC11548551
- DOI: 10.3390/plants13213005
Intraspecific Variability of Xylem Hydraulic Traits of Calligonum mongolicum Growing in the Desert of Northern Xinjiang, China
Abstract
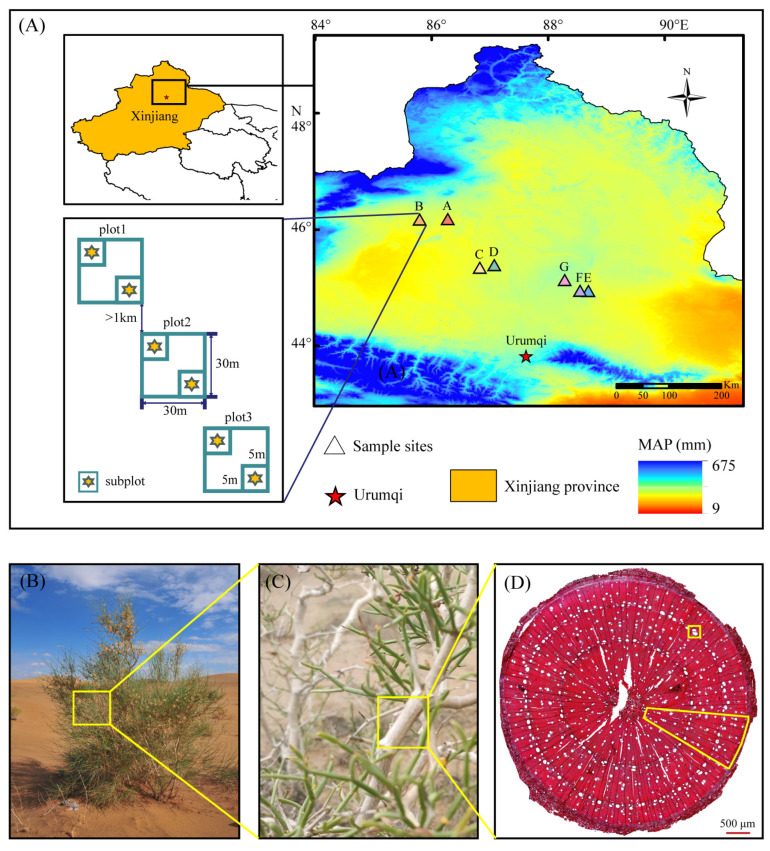
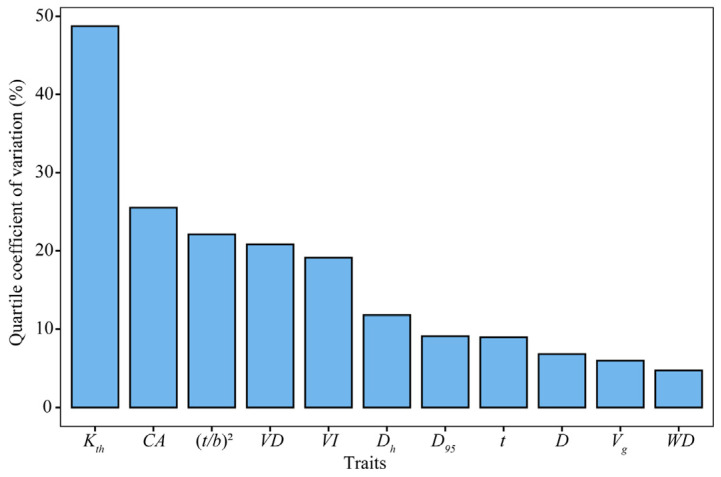
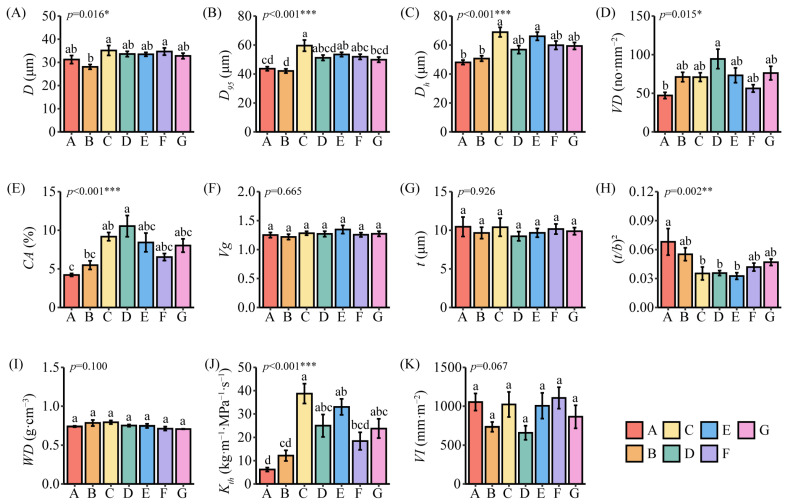
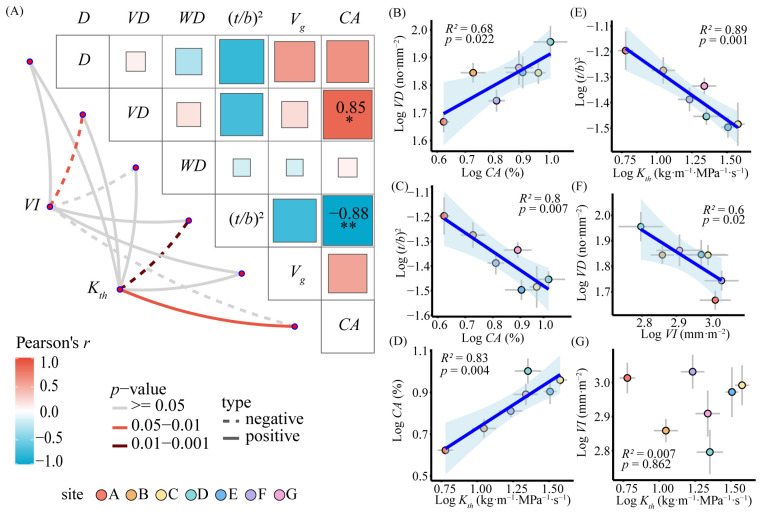
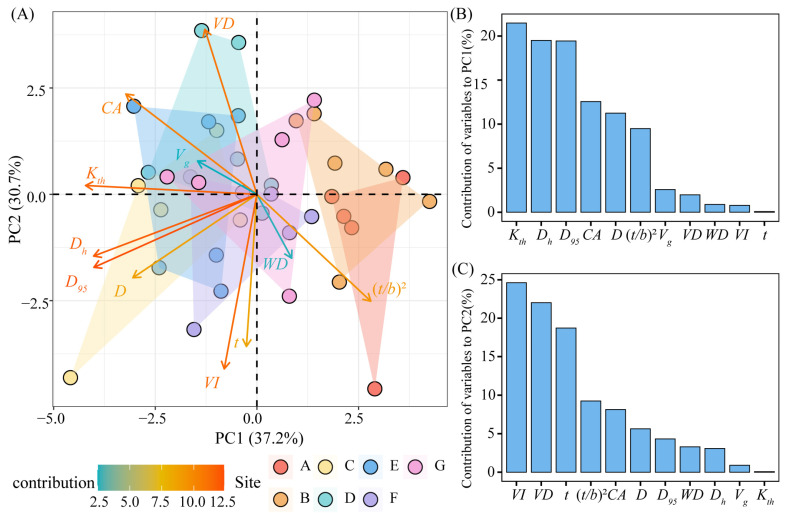
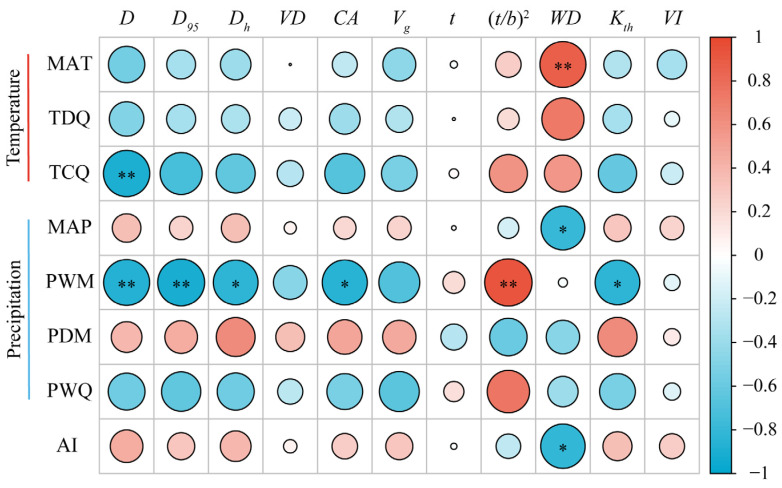
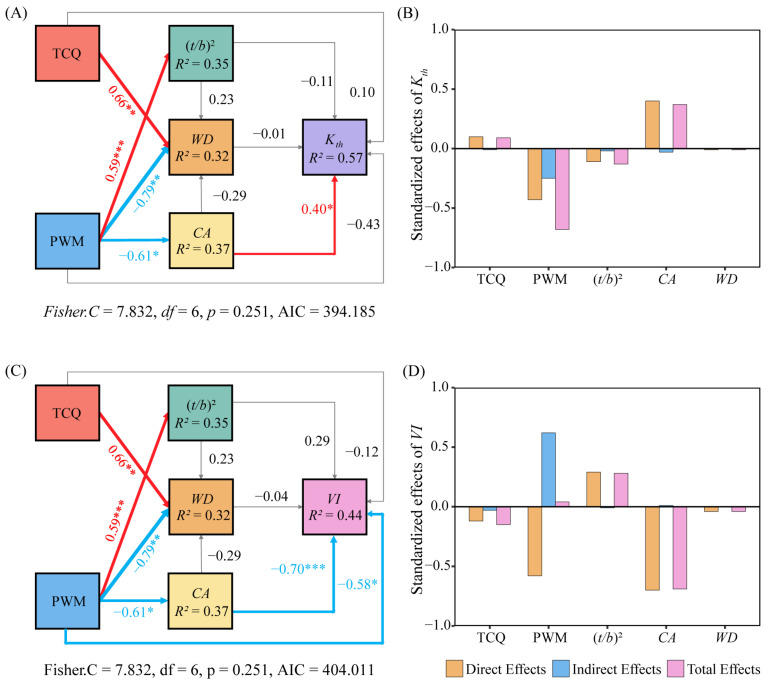
Plant hydraulic traits are essential for understanding and predicting plant drought resistance. Investigations into the mechanisms of the xylem anatomical traits of desert shrubs in response to climate can help us to understand plant survival strategies in extreme environments. This study examined the xylem anatomical traits and related functional traits of the branches of seven Calligonum mongolicum populations along a precipitation gradient, to explore their adaptive responses to climatic factors. We found that (1) the vessel diameter (D), vessel diameter contributing to 95% of hydraulic conductivity (D95), hydraulic weighted vessel diameter (Dh), vessel density (VD), percentage of conductive area (CA), thickness-to-span ratio of vessels ((t/b)2), and theoretical hydraulic conductivity (Kth) varied significantly across sites, while the vessel group index (Vg), wood density (WD), and vulnerability index (VI) showed no significant differences. (2) Principal component analysis revealed that efficiency-related traits (Kth, Dh, D95) and safety-related traits (VI, VD, inter-wall thickness of the vessel (t)) were the primary factors driving trait variation. (3) Precipitation during the wettest month (PWM) had the strongest influence, positively correlating with (t/b)2 and negatively with D, D95, Dh, CA, and Kth. (4) Structural equation modeling confirmed PWM as the main driver of Kth, with indirect effects through CA. These findings indicate that C. mongolicum displays high plasticity in xylem traits, enabling adaptation to changing environments, and providing insight into the hydraulic strategies of desert shrubs under climate change.
Keywords: desert shrub; ecological adaptation strategy; environmental gradient; intraspecific variability; xylem anatomical traits.
Conflict of interest statement
The author declares no conflicts of interest.
Figures
Similar articles
-
Intraspecific Variation in Wood Anatomical, Hydraulic, and Foliar Traits in Ten European Beech Provenances Differing in Growth Yield.Front Plant Sci. 2016 Jun 15;7:791. doi: 10.3389/fpls.2016.00791. eCollection 2016. Front Plant Sci. 2016. PMID: 27379112 Free PMC article.
-
Branch xylem vascular adjustments in European beech in response to decreasing water availability across a precipitation gradient.Tree Physiol. 2022 Nov 8;42(11):2224-2238. doi: 10.1093/treephys/tpac080. Tree Physiol. 2022. PMID: 35861677
-
Climate of origin shapes variations in wood anatomical properties of 17 Picea species.BMC Plant Biol. 2024 May 17;24(1):414. doi: 10.1186/s12870-024-05103-7. BMC Plant Biol. 2024. PMID: 38760680 Free PMC article.
-
Xylem adjusts to maintain efficiency across a steep precipitation gradient in two coexisting generalist species.Ann Bot. 2018 Aug 27;122(3):461-472. doi: 10.1093/aob/mcy088. Ann Bot. 2018. PMID: 29800073 Free PMC article.
-
Impact of elevated atmospheric humidity on anatomical and hydraulic traits of xylem in hybrid aspen.Funct Plant Biol. 2015 Jun;42(6):565-578. doi: 10.1071/FP14224. Funct Plant Biol. 2015. PMID: 32480701
References
-
- He P.C., Ye Q. Plant functional traits: From individual plant to global scale. J. Trop. Subtrop. Bot. 2019;27:523–533.
-
- He P.C., Gleason S.M., Wright I.J., Weng E.S., Liu H., Zhu S.D., Lu M.Z., Luo Q., Li R.H., Wu G.L., et al. Growing-season temperature and precipitation are independent drivers of global variation in xylem hydraulic conductivity. Glob. Change Biol. 2020;26:1833–1841. doi: 10.1111/gcb.14929. - DOI - PubMed
-
- Tyree M.T., Zimmermann M.H. Xylem Structure and the Ascent of Sap. Springer; Berlin, Germany: 2002. Conducting Units: Tracheids and Vessels; pp. 17–21.
Grants and funding
- 2021-XBQNXZ-006/West Light Foundation of the Chinese Academy of Sciences
- Grant Nos. 42171070/National Natural Science Foundation of China
- 2022D01D083/Key Project of Xinjiang Uygur Autonomous Region Natural Science Foundation
- 2023A01002-1/the Major Science and Technology Project of Xinjiang Uygur Autonomous Region
LinkOut - more resources
Full Text Sources
