

Locus coeruleus vulnerability to tau hyperphosphorylation in a rat model
- PMID: 39520141
- PMCID: PMC11896524
- DOI: 10.1111/acel.14405
Locus coeruleus vulnerability to tau hyperphosphorylation in a rat model
Abstract
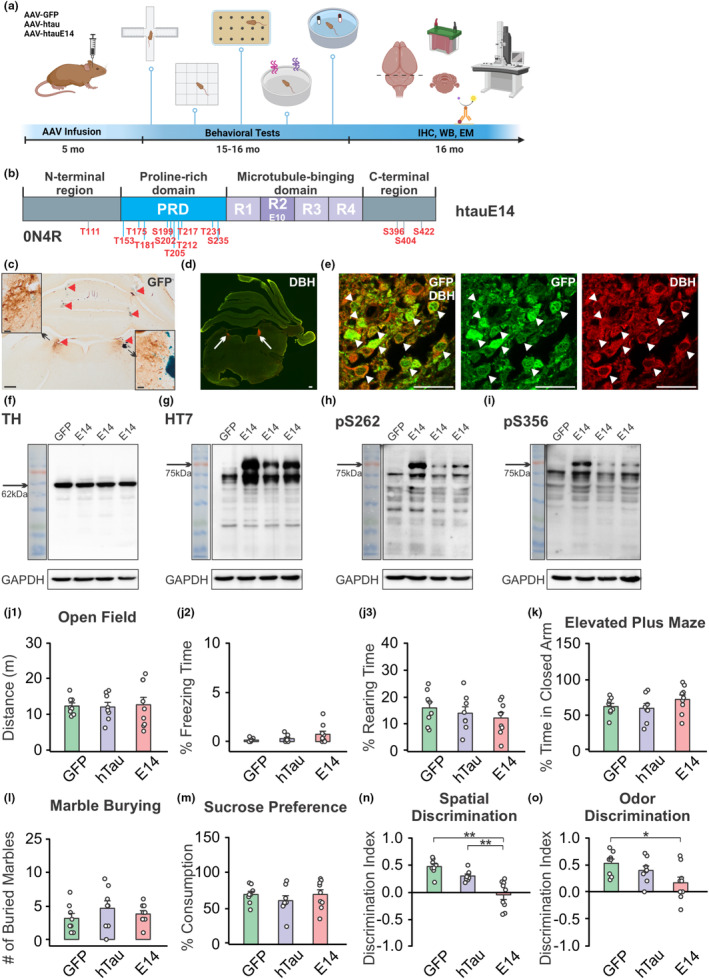
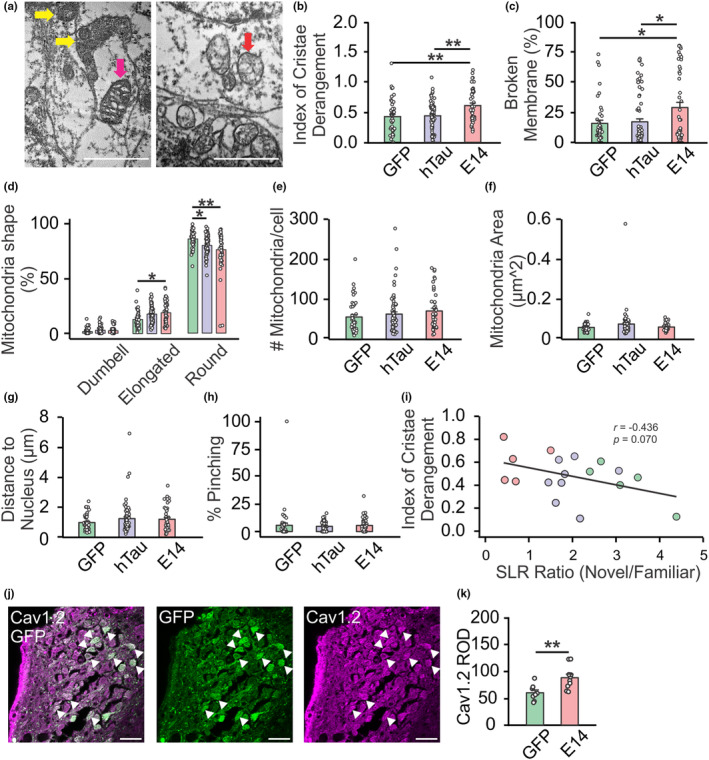
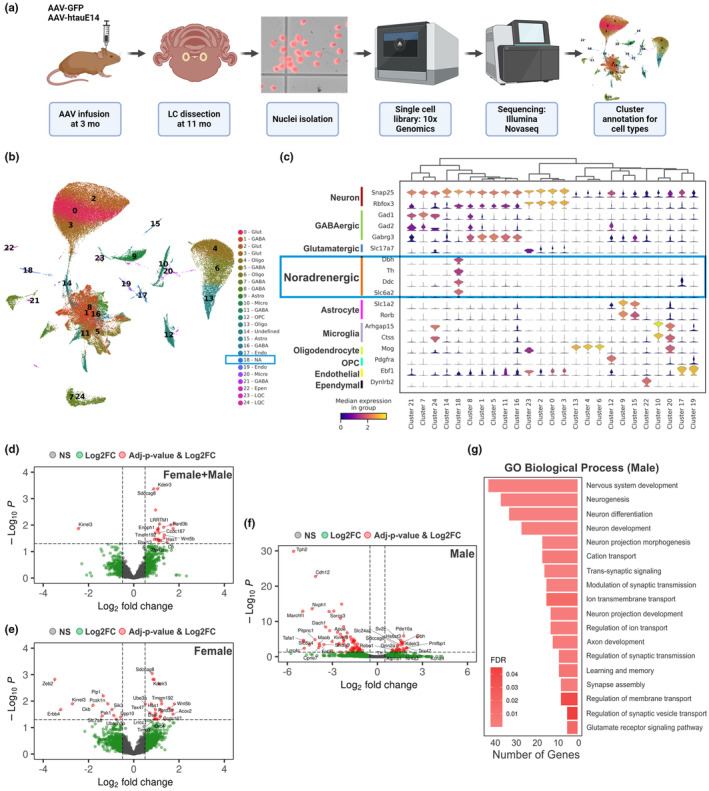
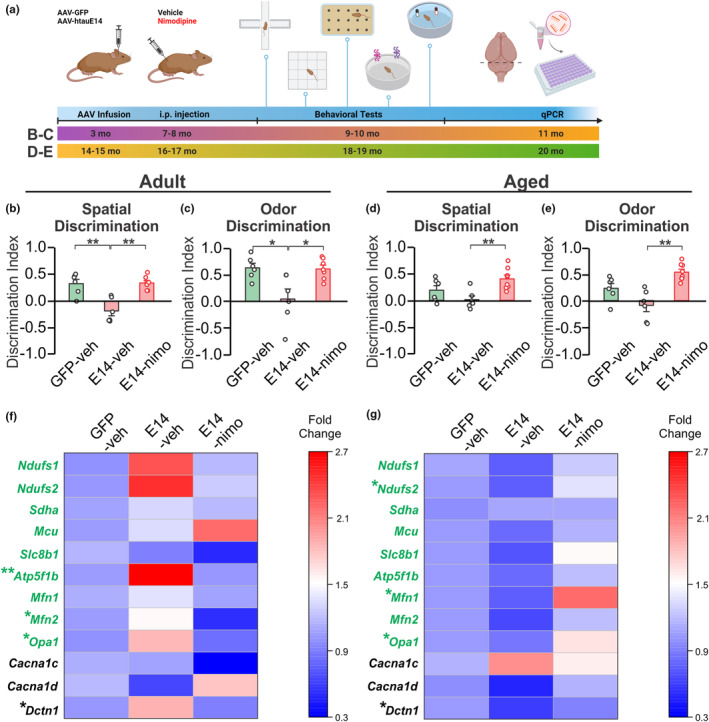
Post-mortem investigations indicate that the locus coeruleus (LC) is the initial site of hyperphosphorylated pretangle tau, a precursor to neurofibrillary tangles (NFTs) found in Alzheimer's disease (AD). The presence of pretangle tau and NFTs correlates with AD progression and symptomatology. LC neuron integrity and quantity are linked to cognitive performance, with degeneration strongly associated with AD. Despite their importance, the mechanisms of pretangle tau-induced LC degeneration are unclear. This study examined the transcriptomic and mitochondrial profiles of LC noradrenergic neurons after transduction with pseudophosphorylated human tau. Tau hyperphosphorylation increased the somatic expression of the L-type calcium channel (LTCC), impaired mitochondrial health, and led to deficits in spatial and olfactory learning. Sex-dependent alterations in gene expression were observed in rats transduced with pretangle tau. Chronic LTCC blockade prevented behavioral deficits and altered mitochondrial mRNA expression, suggesting a potential link between LTCC hyperactivity and mitochondrial dysfunction. Our research provides insights into the consequences of tau pathology in the originating structure of AD.
Keywords: L‐type calcium channel; electron microscopy; locus coeruleus; mitochondria; single nuclei RNA sequencing; tau.
© 2024 The Author(s). Aging Cell published by Anatomical Society and John Wiley & Sons Ltd.
Conflict of interest statement
The authors report no competing interests.
Figures
Similar articles
-
An experimental model of Braak's pretangle proposal for the origin of Alzheimer's disease: the role of locus coeruleus in early symptom development.Alzheimers Res Ther. 2019 Jul 3;11(1):59. doi: 10.1186/s13195-019-0511-2. Alzheimers Res Ther. 2019. PMID: 31266535 Free PMC article.
-
Chemogenetic locus coeruleus activation restores reversal learning in a rat model of Alzheimer's disease.Brain. 2017 Nov 1;140(11):3023-3038. doi: 10.1093/brain/awx232. Brain. 2017. PMID: 29053824 Free PMC article.
-
Down but Not Out: The Consequences of Pretangle Tau in the Locus Coeruleus.Neural Plast. 2017;2017:7829507. doi: 10.1155/2017/7829507. Epub 2017 Sep 5. Neural Plast. 2017. PMID: 29038736 Free PMC article. Review.
-
Targeting early tau pathology: probiotic diet enhances cognitive function and reduces inflammation in a preclinical Alzheimer's model.Alzheimers Res Ther. 2025 Jan 18;17(1):24. doi: 10.1186/s13195-025-01674-1. Alzheimers Res Ther. 2025. PMID: 39827356 Free PMC article.
-
The 'a, b, c's of pretangle tau and their relation to aging and the risk of Alzheimer's Disease.Semin Cell Dev Biol. 2021 Aug;116:125-134. doi: 10.1016/j.semcdb.2020.12.010. Epub 2021 Mar 2. Semin Cell Dev Biol. 2021. PMID: 33674223 Review.
Cited by
-
Noradrenergic Locus Coeruleus-CA3 Activation Alleviates Neuropathic Pain and Anxiety- and Depression-Like Behaviors by Suppressing Microglial Neuroinflammation in SNI Mice.CNS Neurosci Ther. 2025 Mar;31(3):e70360. doi: 10.1111/cns.70360. CNS Neurosci Ther. 2025. PMID: 40130433 Free PMC article.
References
-
- Ando, K. , Maruko‐Otake, A. , Ohtake, Y. , Hayashishita, M. , Sekiya, M. , & Iijima, K. M. (2016). Stabilization of microtubule‐unbound tau via tau phosphorylation at Ser262/356 by Par‐1/MARK contributes to augmentation of AD‐related phosphorylation and Abeta42‐induced tau toxicity. PLoS Genetics, 12(3), e1005917. 10.1371/journal.pgen.1005917 - DOI - PMC - PubMed
-
- Ban, T. A. , Morey, L. , Aguglia, E. , Azzarelli, O. , Balsano, F. , Marigliano, V. , Caglieris N., Sterlicchio M., Capurso A., Tomasi N. A., Crepaldi G., Volpe D., Palmieri G., Ambrosi G., Polli E., Cortellaro M., Zanussi C., Froldi M. (1990). Nimodipine in the treatment of old age dementias. Progress in Neuro‐Psychopharmacology & Biological Psychiatry, 14(4), 525–551. 10.1016/0278-5846(90)90005-2 - DOI - PubMed
MeSH terms
Substances
Grants and funding
LinkOut - more resources
Full Text Sources
Molecular Biology Databases
