

A WFS1 variant disrupting acceptor splice site uncovers the impact of alternative splicing on beta cell apoptosis in a patient with Wolfram syndrome
- PMID: 39520565
- PMCID: PMC11663190
- DOI: 10.1007/s00125-024-06307-0
A WFS1 variant disrupting acceptor splice site uncovers the impact of alternative splicing on beta cell apoptosis in a patient with Wolfram syndrome
Abstract
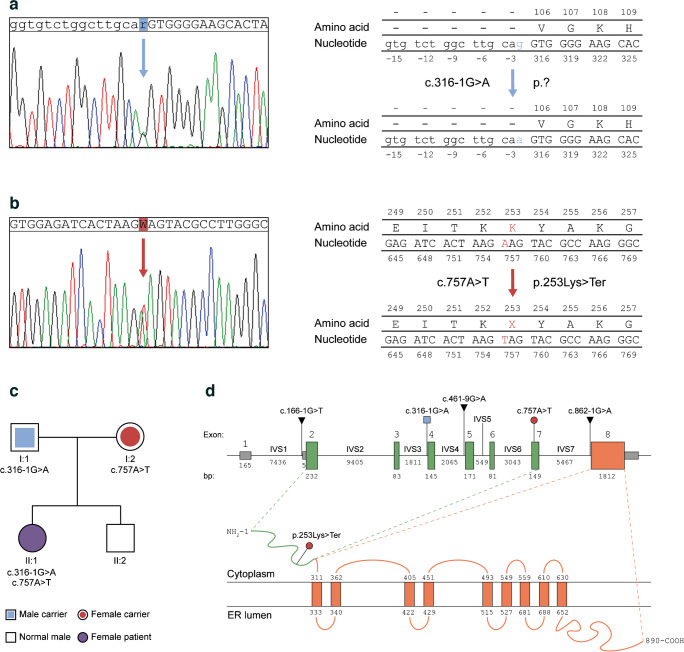
Aims/hypothesis: Wolfram syndrome 1 (WS1) is an inherited condition mainly manifesting in childhood-onset diabetes mellitus and progressive optic nerve atrophy. The causative gene, WFS1, encodes wolframin, a master regulator of several cellular responses, and the gene's mutations associate with clinical variability. Indeed, nonsense/frameshift variants correlate with more severe symptoms than missense/in-frame variants. As achieving a genotype-phenotype correlation is crucial for dealing with disease outcome, works investigating the impact of transcriptional and translational landscapes stemming from such mutations are needed. Therefore, we sought to elucidate the molecular determinants behind the pathophysiological alterations in a WS1 patient carrying compound heterozygous mutations in WFS1: c.316-1G>A, affecting the acceptor splice site (ASS) upstream of exon 4; and c.757A>T, introducing a premature termination codon (PTC) in exon 7.
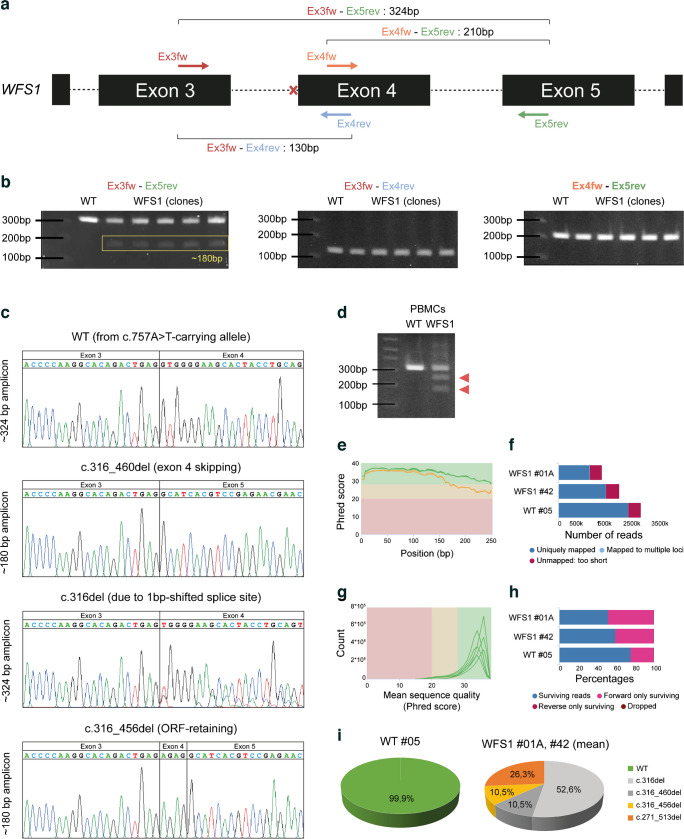
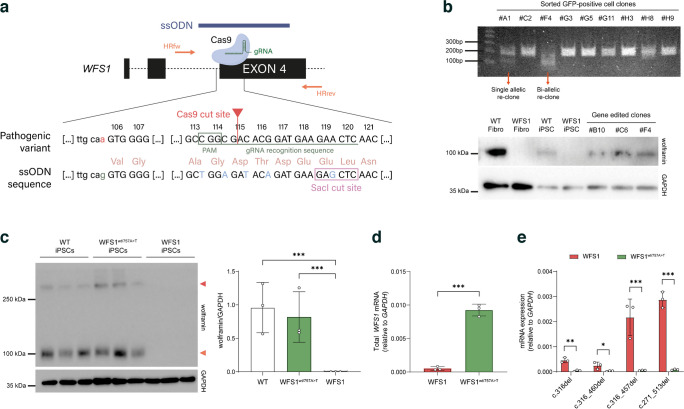
Methods: Bioinformatic analysis was carried out to infer the alternative splicing events occurring after disruption of ASS, followed by RNA-seq and PCR to validate the transcriptional landscape. Patient-derived induced pluripotent stem cells (iPSCs) were used as an in vitro model of WS1 and to investigate the WFS1 alternative splicing isoforms in pancreatic beta cells. CRISPR/Cas9 technology was employed to correct ASS mutation and generate a syngeneic control for the endoplasmic reticulum stress induction and immunotoxicity assays.
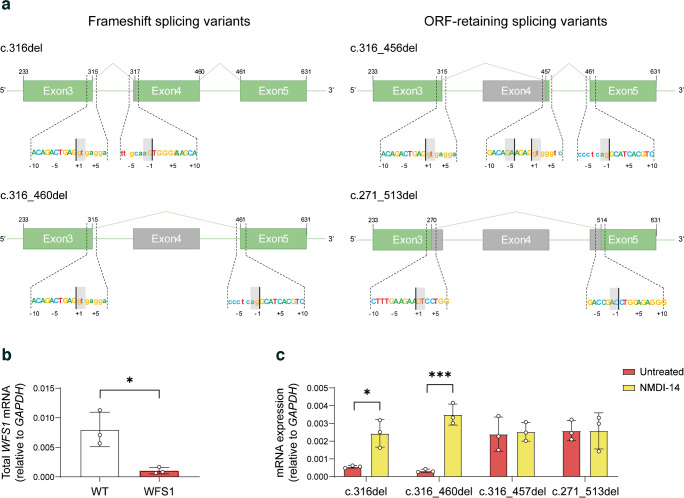
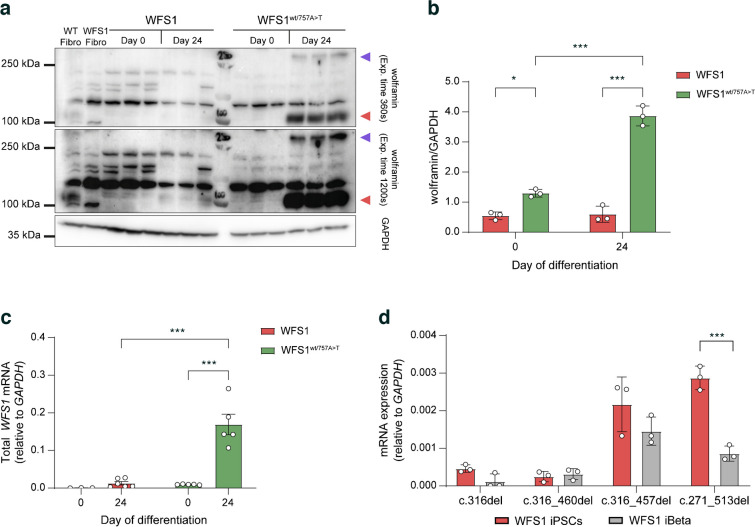
Results: We showed that patient-derived iPSCs retained the ability to differentiate into pancreatic beta cells. We demonstrated that the allele carrying the ASS mutation c.316-1G>A originates two PTC-containing alternative splicing transcripts (c.316del and c.316-460del), and two open reading frame-conserving mRNAs (c.271-513del and c.316-456del) leading to N-terminally truncated polypeptides. By retaining the C-terminal domain, these isoforms sustained the endoplasmic reticulum stress response in beta cells. Otherwise, PTC-carrying transcripts were regulated by the nonsense-mediated decay (NMD) in basal conditions. Exposure to cell stress inducers and proinflammatory cytokines affected expression levels of the NMD-related gene SMG7 (>twofold decrease; p<0.001) without eliciting a robust unfolded protein response in WFS1 beta cells. This resulted in a dramatic accumulation of the PTC-containing isoforms c.316del (>100-fold increase over basal; p<0.001) and c.316-460del (>20-fold increase over basal; p<0.001), predisposing affected beta cells to undergo apoptosis. Cas9-mediated recovery of ASS retrieved the canonical transcriptional landscape, rescuing the normal phenotype in patient-derived beta cells.
Conclusions/interpretation: This study represents a new model to study wolframin, highlighting how each single mutation of the WFS1 gene can determine dramatically different functional outcomes. Our data point to increased vulnerability of WFS1 beta cells to stress and inflammation and we postulate that this is triggered by escaping NMD and accumulation of mutated transcripts and truncated proteins. These findings pave the way for further studies on the molecular basis of genotype-phenotype relationship in WS1, to uncover the key determinants that might be targeted to ameliorate the clinical outcome of patients affected by this rare disease.
Data availability: The in silico predicted N-terminal domain structure file of WT wolframin was deposited in the ModelArchive, together with procedures, ramachandran plots, inter-residue distance deviation and IDDT scores, and Gromacs configuration files (doi/10.5452/ma-cg3qd). The deep-sequencing data as fastq files used to generate consensus sequences of AS isoforms of WFS1 are available in the SRA database (BioProject PRJNA1109747).
Keywords: Cell stress; IPSCs; Inflammation; Nonsense-mediated decay; Wolfram syndrome; Wolframin.
© 2024. The Author(s).
Conflict of interest statement
Acknowledgements: We thank the Advanced Light and Electron Microscopy BioImaging Center (ALEMBIC) at San Raffaele Scientific Institute, Milan (Italy), for confocal immunofluorescence images and the Flow cytometry Resource, Advanced Cytometry Technical Applications Laboratory (FRACTAL), at San Raffaele Scientific Institute, Milan (Italy), for cell sorting experiments. We also thank F. Giannese and D. Lazarevic at the Center for Omics Sciences (COSR) of San Raffaele Scientific Institute, Milan (Italy), for providing support in library preparation, deep sequencing and bioinformatic analysis. We are grateful to A. Lombardo at the San Raffaele Telethon Institute for Gene Therapy (SR-TIGET), San Raffaele Scientific Institute, Milan (Italy), for the access to BLS2 work areas and the use of the 4D-Nucleofector System. S. Torchio conducted this study as partial fulfilment of an international PhD in Molecular Medicine at Vita-Salute San Raffaele University. Data availability: The in silico predicted N-terminal domain structure file of WT wolframin was deposited in the ModelArchive, together with procedures, ramachandran plots, inter-residue distance deviation and IDDT scores, and Gromacs configuration files (doi/10.5452/ma-cg3qd). The deep-sequencing data as fastq files used to generate consensus sequences of AS isoforms of WFS1 are available in the SRA database (BioProject PRJNA1109747). All raw data that were not directly included in the manuscript or that have not been deposited in online repositories, are available on request from the corresponding authors. Funding: This study was supported by a private family donation financing investigation on Wolfram syndrome 1 at the Diabetes Research Institute (DRI) of the IRCCS San Raffaele Hospital. Part of the activities were also supported through the funds from the European Union - Next Generation EU - PNRR M6C2 - Investment 2.1 Enhancement and strengthening of NHS biomedical research (PNRR-MR1-2022-12375914). Authors’ relationships and activities: The authors declare that there are no relationships or activities that might bias, or be perceived to bias, their work. Contribution statement: RC, GF and LP were responsible for the conception and design of the study. ST contributed to the experimental design and to the collection and analysis of the data, together with RC and GS. RC, ST, GS, VZ, LM, MTL, FM and FC conducted wet experiments. SP supported collection of data during revision activities. RC performed bioinformatic analysis. RC, ST, GS and LP interpreted the results. PC followed genetic testing in clinical practice. Medical evaluations and patient specimen collection was performed by GF and RB. GR and VB supported cell reprogramming activities. VZ, LM, MTL, SP and VS performed stem cell differentiation and beta cell function analysis. GC contributed to data interpretation. RC and ST wrote the original draft, and all authors contributed to the critical review and editing of the manuscript. All authors approved the final version to be published. LP takes responsibility for the integrity of the data and is the guarantor of this work.
Figures


Similar articles
-
Liraglutide Treatment Reverses Unconventional Cellular Defects in Induced Pluripotent Stem Cell-Derived β-Cells Harboring a Partially Functional WFS1 Variant.Diabetes. 2025 Jul 1;74(7):1273-1288. doi: 10.2337/db24-0720. Diabetes. 2025. PMID: 40202504 Free PMC article.
-
A novel mutation of WFS1 gene leading to increase ER stress and cell apoptosis is associated an autosomal dominant form of Wolfram syndrome type 1.BMC Endocr Disord. 2021 Apr 21;21(1):76. doi: 10.1186/s12902-021-00748-z. BMC Endocr Disord. 2021. PMID: 33879153 Free PMC article.
-
Loss of Function of WFS1 Causes ER Stress-Mediated Inflammation in Pancreatic Beta-Cells.Front Endocrinol (Lausanne). 2022 Mar 25;13:849204. doi: 10.3389/fendo.2022.849204. eCollection 2022. Front Endocrinol (Lausanne). 2022. PMID: 35399956 Free PMC article.
-
Wolfram syndrome 1 and Wolfram syndrome 2.Curr Opin Pediatr. 2012 Aug;24(4):512-7. doi: 10.1097/MOP.0b013e328354ccdf. Curr Opin Pediatr. 2012. PMID: 22790102 Review.
-
Mutational spectrum of the WFS1 gene in Wolfram syndrome, nonsyndromic hearing impairment, diabetes mellitus, and psychiatric disease.Hum Mutat. 2003 Oct;22(4):275-87. doi: 10.1002/humu.10258. Hum Mutat. 2003. PMID: 12955714 Review.
Cited by
-
Characterization of Novel WFS1 Variants in Three Diabetes Pedigrees.J Diabetes. 2025 Jul;17(7):e70114. doi: 10.1111/1753-0407.70114. J Diabetes. 2025. PMID: 40641032 Free PMC article.
-
Liraglutide Treatment Reverses Unconventional Cellular Defects in Induced Pluripotent Stem Cell-Derived β-Cells Harboring a Partially Functional WFS1 Variant.Diabetes. 2025 Jul 1;74(7):1273-1288. doi: 10.2337/db24-0720. Diabetes. 2025. PMID: 40202504 Free PMC article.
References
-
- Rigoli L, Bramanti P, Di Bella C, De Luca F (2018) Genetic and clinical aspects of Wolfram syndrome 1, a severe neurodegenerative disease. Pediatr Res 83:921–929. 10.1038/pr.2018.17 - PubMed
-
- Fonseca SG, Fukuma M, Lipson KL et al (2005) WFS1 is a novel component of the unfolded protein response and maintains homeostasis of the endoplasmic reticulum in pancreatic β-cells. J Biol Chem 280:39609–39615. 10.1074/jbc.M507426200 - PubMed
Publication types
MeSH terms
Substances
Grants and funding
LinkOut - more resources
Full Text Sources
Research Materials
Miscellaneous
