. 2024 Dec;44(1):1-15.
doi: 10.1080/01652176.2024.2424837. Epub 2024 Nov 9.

New preclinical biomarkers for prion diseases in the cerebrospinal fluid proteome revealed by mass spectrometry

Affiliations

New preclinical biomarkers for prion diseases in the cerebrospinal fluid proteome revealed by mass spectrometry

Sonia Pérez-Lázaro et al. Vet Q. 2024 Dec.

Abstract

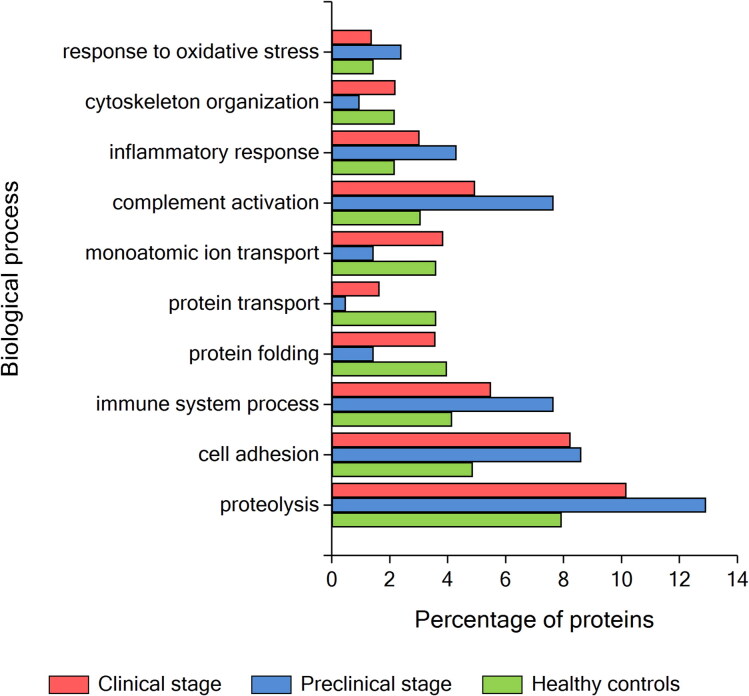
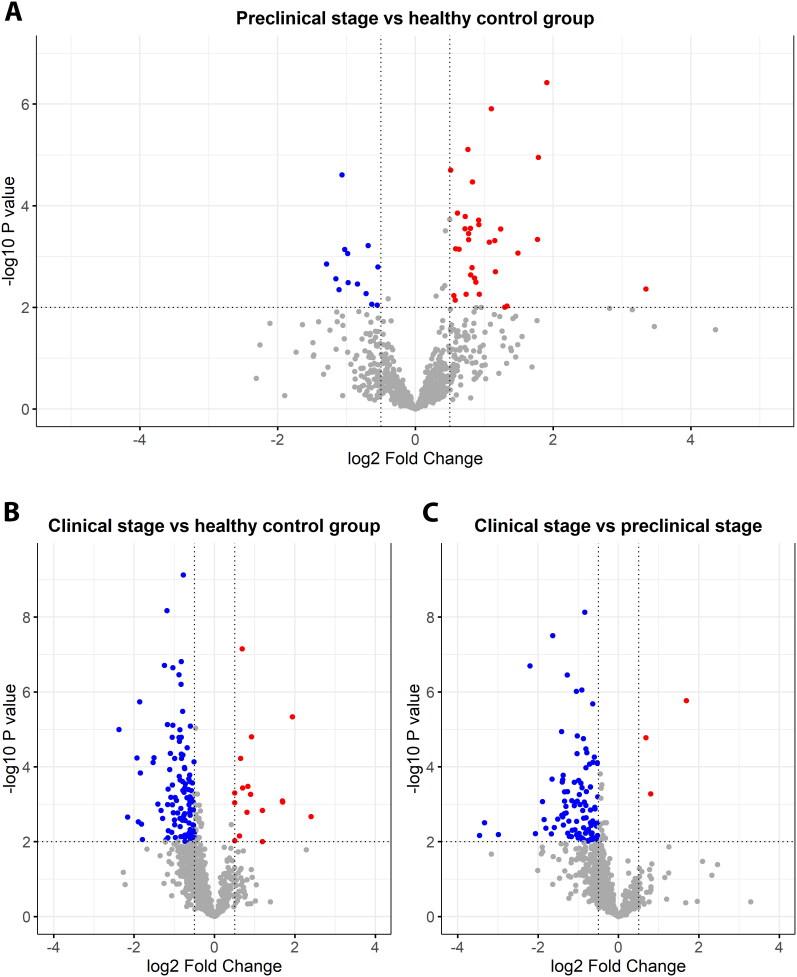
Current diagnostic methods for prion diseases only work in late stages of the disease when neurodegeneration is irreversible. Therefore, biomarkers that can detect the disease before the onset of clinical symptoms are necessary. High-throughput discovery proteomics is of great interest in the search for such molecules. Here we used mass spectrometry to analyse the cerebrospinal fluid proteome in an animal prion disease: preclinical and clinical sheep affected with natural scrapie, and healthy sheep. Interestingly, we found 46 proteins in the preclinical stage that were significantly altered (p < 0.01) compared to healthy sheep, mainly associated with biological processes such as stress and inflammatory responses. Five of them were selected for validation by enzyme-like immunosorbent assay: synaptotagmin binding, cytoplasmic RNA interacting protein (SYNCRIP), involved in nucleic acid metabolism; phospholipase D3 (PLD3) and cathepsin D (CTSD), both related to lysosomal apoptosis; complement component 4 (C4), an element of the classical immune response; and osteopontin (SPP1), a proinflammatory cytokine. These proteins significantly increased in the preclinical stage and maintained their levels in the clinical phase, except for CTSD, whose concentration returned to basal levels in the clinical group. Further research is ongoing to explore their potential as preclinical biomarkers of prion diseases.

Keywords: Prion; biomarkers; cerebrospinal fluid; diagnosis; mass spectrometry; neurodegenerative diseases; preclinical; scrapie.


Conflict of interest statement

No potential competing interest was reported by the authors.

Figures

Figure 1.
Figure 1.
Venn diagrams showing the distribution of proteins among the two scrapie-infected groups studied in the preclinical stage (PC) and clinical stage (C), compared to the healthy control group (HC). The total number of proteins identified in each group is specified next to the group name. Proteins shown were identified by microRPLC-MS/MS using a DDA mode: A) in all but one samples (n − 1) per group; B) common and uncommon proteins in every sample of each group.
Figure 2.
Figure 2.
Functional enrichment analysis by FunRich performed on all proteins identified by the common and uncommon analysis of the DDA data. Bars represent the percentage of proteins assigned to each biological process, for each of the clinical stages.
Figure 3.
Figure 3.
Gene Ontology analysis regarding KEGG pathways using ShinyGO, in which genes encoding significantly dysregulated proteins in the infected group compared to healthy animals with p-value < 0.05 and absolute value of log2FC > 0.5 are involved. Top 10 KEGG pathways altered are displayed, sorted by fold enrichment. Fold enrichment shows the ratio between the relative frequency of dysregulated proteins annotated to that pathway, and the total number of proteins in the reference species. Colour varies depending on the significance (-log10FDR), where the false discovery rate (FDR) value reflects the statistical chance of observing a number of proteins in a given list annotated to a specific pathway. Circle size shows the number of genes encoding input proteins involved in each pathway.
Figure 4.
Figure 4.
Volcano plots showing the results of the SWATH-MS analysis of CSF protein expression, representing three of the possible comparisons between groups: A) the preclinical stage group compared to the healthy control group; B) the clinical stage group compared to the healthy control group; C) the clinical stage group compared to the preclinical stage group. In all plots, the horizontal dotted line indicates a statistical significance (-Log10 p-value) of 2, i.e. a p-value of 0.01, while the vertical dotted lines represent fold change values (Log2 Fold Change) of −0.5 and +0.5, respectively. In each comparison, significantly upregulated CSF proteins are coloured in red and significantly downregulated CSF proteins are shown in blue. In grey, proteins without notable variation are marked.
Figure 5.
Figure 5.
Heatmap analysis of the 46 significantly dysregulated proteins identified in the preclinical stage group and healthy group comparison. Relative expression of each protein is displayed with a colour range from red (downregulated) to green (upregulated), representing z-scores of the proteins’ normalised peak areas. Clustering of proteins in rows, represented by a dendrogram in the left y-axis, was performed using a complete linkage method and the Spearman Rank Correlation method was applied for distance measurement. Columns represent all samples included in this study: 12 healthy sheep, 5 and 13 in the preclinical and clinical stages of the disease, respectively.
Figure 6.
Figure 6.
Interactions between proteins significantly dysregulated in the preclinical stage and those in the STRING sheep database. Network nodes (circles) represent individual proteins and edges refer to protein-protein association evidences, with a high confidence (0.700) interaction score. Edge (line) colours represent different interaction evidences: known interactions with light blue (from curated databases) and pink (experimentally determined), predicted co-occurrence with dark blue, textmining with light green, co-expression with black and protein homology with purple. Node colours refer to functional enrichment analysis in which proteins are involved as follows: dark blue for response to stress, light blue for cell adhesion, red for inflammatory response, brown for protein binding, yellow for extracellular matrix receptor interaction and green for complement and coagulation Cascades.
Figure 7.
Figure 7.
Concentration (Y-axis) of selected proteins (SYNCRIP, PLD3, C4, CTSD and SPP1) measured by ELISA in CSF samples of healthy controls (n = 12) and preclinical (n = 5) and clinical (n = 13) scrapie-infected sheep. The boxes are drawn from the first quartile to the third quartile and the median is shown as a horizontal line inside the box. The whiskers extend from the box to the most extreme data point within 1.5 times the interquartile range, with the data points outside that range being considered potential outliers. Significant differences between groups were measured using one-way ANOVA test followed by Tukey HSD for multiple pairwise-comparisons or Kruskal-Wallis followed by Dunn’s test, for normally and non-normally distributed data, respectively. *p-value < 0.05, **p-value < 0.01, ***p-value < 0.001, ****p-value < 0.0001.

References

    1. Acín C, Martín-Burriel I, Goldmann W, Lyahyai J, Monzón M, Bolea R, Smith A, Rodellar C, Badiola JJ, Zaragoza P.. 2004. Prion protein gene polymorphisms in healthy and scrapie-affected Spanish sheep. J Gen Virol. 85(Pt 7):2103–2110. doi: 10.1099/vir.0.80047-0. - DOI - PubMed
    1. Anjo, S.I., Santa, C., Manadas, B.. 2019. SWATH Mass Spectrometry applied to cerebrospinal fluid differential proteomics: establishment of a sample-specific method. In: Santamaría E, Fernández-Irigoyen J, editors. Cerebrospinal fluid (CSF) proteomics. Methods and protocols. Springer: Methods in Molecular Biology; p. 169–189. doi: 10.1007/978-1-4939-9706-0_11. - DOI - PubMed
    1. Benes P, Vetvicka V, Fusek M.. 2008. Cathepsin D – many functions of one aspartic protease. Crit Rev Oncol Hematol. 68(1):12–28. doi: 10.1016/j.critrevonc.2008.02.008. - DOI - PMC - PubMed
    1. Berkowitz S, Chapman J, Dori A, Gofrit SG, Maggio N, Shavit-Stein E.. 2021. Complement and coagulation system crosstalk in synaptic and neural conduction in the central and peripheral nervous systems. Biomedicines. 9(12):1950. doi: 10.3390/biomedicines9121950. - DOI - PMC - PubMed
    1. Blanc V, Navaratnam N, Henderson JO, Anant S, Kennedy S, Jarmuz A, Scott J, Davidson NO.. 2001. Identification of GRY-RBP as an apolipoprotein B RNA-binding protein that interacts with both apobec-1 and apobec-1 complementation factor to modulate C to U editing. J Biol Chem. 276(13):10272–10283. doi: 10.1074/jbc.M006435200. - DOI - PubMed