

TXNIP regulates pulmonary inflammation induced by Asian sand dust
- PMID: 39520910
- PMCID: PMC11671764
- DOI: 10.1016/j.redox.2024.103421
TXNIP regulates pulmonary inflammation induced by Asian sand dust
Abstract
Asian sand dust (ASD), a seasonal dust storm originating from the deserts of China and Mongolia, affects Korea and Japan during the spring, carrying soil particles and a variety of biochemical components. Exposure to ASD has been associated with the onset and exacerbation of respiratory disorders, although the underlying mechanisms remain unclear. This study investigates ASD-induced pulmonary toxicity and its mechanistic pathways, focusing on the role of thioredoxin-interacting protein (TXNIP). Using TXNIP knock-out (KO) mice and adeno-associated virus (AAV)-mediated TXNIP overexpression transgenic mice, we explored how TXNIP modulates ASD-induced pulmonary inflammation. Mice were exposed to ASD via intranasal administration on days 1, 3, and 5 to induce inflammation. ASD exposure led to significant pulmonary inflammation, evidenced by increased inflammatory cell counts and elevated cytokine levels in bronchoalveolar lavage fluid, as well as heightened protein expression of the TXNIP/NOD-like receptor pyrin domain-containing 3 (NLRP3) inflammasome. TXNIP KO mice exhibited attenuated airway inflammation and downregulation of the NLRP3 inflammasome compared to wild-type controls, while AAV-mediated TXNIP overexpression mice showed exacerbated inflammatory responses, including elevated NLRP3 inflammasome expression, compared to AAV-GFP controls. These findings suggest that TXNIP is a key regulator of ASD-induced pulmonary inflammation.
Keywords: Asian sand dust; Inflammasome; NLRP3; Pulmonary inflammation; TXNIP.
Copyright © 2024 The Authors. Published by Elsevier B.V. All rights reserved.
Conflict of interest statement
Declaration of competing interest The authors declare that they have no known competing financial interests or personal relationships that could have appeared to influence the work reported in this paper.
Figures


 PBS intranasal instillation; ASD10, 20, and 40 = 10, 20, and 40 mg/kg of ASD intranasal instillation, respectively. Data are presented as means ± SD (n = 5). ∗p < 0.05 and ∗∗p < 0.01.
 PBS intranasal instillation; ASD10, 20, and 40 = 10, 20, and 40 mg/kg of ASD intranasal instillation, respectively. Scale bar = 100 μm. Data are presented as means ± SD (n = 5). ∗p < 0.05 and ∗∗p < 0.01.
 PBS intranasal instillation; ASD10, 20, and 40 = 10, 20, and 40 mg/kg of ASD intranasal instillation, respectively. Data are presented as means ± SD (n = 5). ∗p < 0.05 and ∗∗p < 0.01.
 PBS intranasal instillation in wild type (WT) mice; WT ASD = ASD intranasal instillation in WT mice; KO NCPBS intranasal instillation in TXNIP knockout (KO) mice; KO ASD = ASD intranasal instillation in TXNIP (KO) mice. Data are presented as means ± SD (n = 5). ∗p < 0.05 and ∗∗p < 0.01.
 PBS intranasal instillation in wild type (WT) mice; WT ASD = ASD intranasal instillation in WT mice; KO NCPBS intranasal instillation in TXNIP knockout (KO) mice; KO ASD = ASD intranasal instillation in TXNIP (KO) mice. Scale bar = 100 μm. Data are presented as means ± SD (n = 5). ∗p < 0.05 and ∗∗p < 0.01.
 PBS intranasal instillation in wild type (WT) mice; WT ASD = ASD intranasal instillation in WT mice; KO NCPBS intranasal instillation in TXNIP knockout (KO) mice; KO ASD = ASD intranasal instillation in TXNIP (KO) mice. Data are presented as means ± SD (n = 5). ∗p < 0.05 and ∗∗p < 0.01.
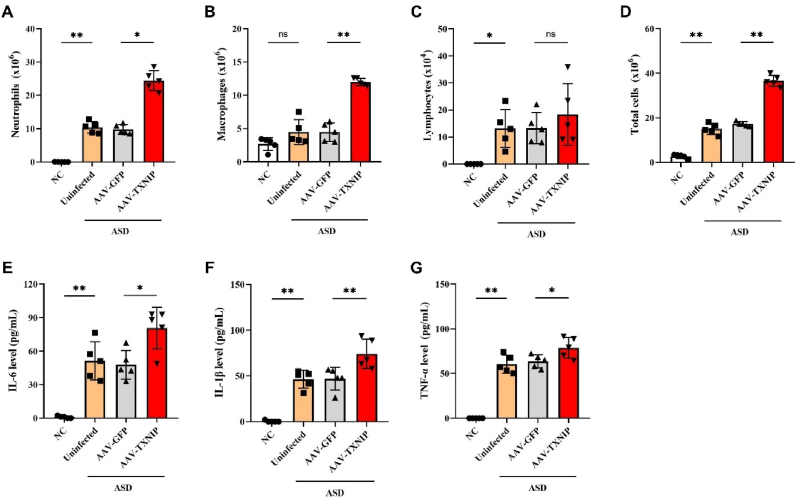 PBS intranasal instillation; Uninfected ASD = ASD intranasal instillation; AAV-GFP ASD = AAV-GFP intratracheal injection + ASD intranasal instillation. AAV-TXNIP ASD = AAV-TXNIP intratracheal injection + ASD intranasal instillation. Data are presented as means ± SD (n = 5). ∗p < 0.05 and ∗∗p < 0.01.
 PBS intranasal instillation; Uninfected ASD = ASD intranasal instillation; AAV-GFP ASD = AAV-GFP intratracheal injection + ASD intranasal instillation. AAV-TXNIP ASD = AAV-TXNIP intratracheal injection + ASD intranasal instillation. Scale bar = 100 μm. Data are presented as means ± SD (n = 5). ∗p < 0.05 and ∗∗p < 0.01.
 PBS intranasal instillation; Uninfected ASD = ASD intranasal instillation; AAV-GFP ASD = AAV-GFP intratracheal injection + ASD intranasal instillation. AAV-TXNIP ASD = AAV-TXNIP intratracheal injection + ASD intranasal instillation. Data are presented as means ± SD (n = 5). ∗p < 0.05 and ∗∗p < 0.01.
 PBS intranasal instillation; Uninfected ASD = ASD intranasal instillation; AAV-GFP ASD = AAV-GFP intratracheal injection + ASD intranasal instillation. AAV-TXNIP ASD = AAV-TXNIP intratracheal injection + ASD intranasal instillation. Data are presented as means ± SD (n = 5). ∗p < 0.05 and ∗∗p < 0.01.
Similar articles
-
Inhibition of NLRP3 inflammasome by thioredoxin-interacting protein in mouse Kupffer cells as a regulatory mechanism for non-alcoholic fatty liver disease development.Oncotarget. 2017 Jun 6;8(23):37657-37672. doi: 10.18632/oncotarget.17489. Oncotarget. 2017. PMID: 28499273 Free PMC article.
-
Copper oxide nanoparticles exacerbate chronic obstructive pulmonary disease by activating the TXNIP-NLRP3 signaling pathway.Part Fibre Toxicol. 2024 Nov 11;21(1):46. doi: 10.1186/s12989-024-00608-3. Part Fibre Toxicol. 2024. PMID: 39529109 Free PMC article.
-
Impeding Nucleotide-Binding Oligomerization Domain-Like Receptor 3 Inflammasome Ameliorates Cardiac Remodeling and Dysfunction in Obesity-Associated Cardiomyopathy.J Am Heart Assoc. 2024 Dec 3;13(23):e035234. doi: 10.1161/JAHA.124.035234. Epub 2024 Nov 27. J Am Heart Assoc. 2024. PMID: 39604027 Free PMC article.
-
microRNA-135a-5p regulates NOD-like receptor family pyrin domain containing 3 inflammasome-mediated hypertensive cardiac inflammation and fibrosis via thioredoxin-interacting protein.Bioengineered. 2022 Mar;13(3):4658-4673. doi: 10.1080/21655979.2021.2024956. Bioengineered. 2022. PMID: 35148667 Free PMC article.
-
Nod-like receptor protein 3 (NLRP3) inflammasome activation and podocyte injury via thioredoxin-interacting protein (TXNIP) during hyperhomocysteinemia.J Biol Chem. 2014 Sep 26;289(39):27159-27168. doi: 10.1074/jbc.M114.567537. Epub 2014 Aug 19. J Biol Chem. 2014. PMID: 25138219 Free PMC article.
Cited by
-
Asian sand dust exacerbates airway inflammation in a mouse model of asthma.Lab Anim Res. 2025 May 9;41(1):13. doi: 10.1186/s42826-025-00243-9. Lab Anim Res. 2025. PMID: 40346644 Free PMC article.
-
TXNIP promotes viral replication by disrupting MAVS-mediated antiviral signaling and serves as a therapeutic target for antiviral therapy.Redox Biol. 2025 Sep;85:103756. doi: 10.1016/j.redox.2025.103756. Epub 2025 Jul 5. Redox Biol. 2025. PMID: 40628121 Free PMC article.
References
Publication types
MeSH terms
Substances
LinkOut - more resources
Full Text Sources
Medical
Research Materials
