. 2024 Nov 9;12(11):e010170.
doi: 10.1136/jitc-2024-010170.

Depletion of conventional CD4+ T cells is required for robust priming and dissemination of tumor antigen-specific CD8+ T cells in the setting of anti-CD4 therapy

Affiliations

Depletion of conventional CD4+ T cells is required for robust priming and dissemination of tumor antigen-specific CD8+ T cells in the setting of anti-CD4 therapy

Delaney E Ramirez et al. J Immunother Cancer. .

Abstract

Background: Overcoming immune suppression is a major barrier to eliciting potent CD8+ T cell responses against cancer. Treatment with anti-CD4 monoclonal antibody is an effective means for eliminating CD4+Foxp3+ regulatory (Treg) cells in preclinical models and has also demonstrated efficacy in early clinical trials. However, the underlying basis for treatment efficacy, more specifically the implications of codepleting other CD4-expressing cell compartments in tumor-bearing hosts, is not well understood.

Methods: Tumor-bearing mice were treated with anti-CD4 versus other therapies that preserve helper T cell function, and the priming, tissue distribution, and maintenance of tumor antigen-specific CD8 T cells were assessed. Antibody blockade and transgenic mouse models were used to determine the mechanisms of CD8 T cell priming. Single-cell RNA-sequencing (scRNAseq) was used to further characterize CD8 T cells that are primed by anti-CD4 therapy and to identify immunosuppressive CD4 T cell subsets in human melanoma following immune checkpoint blockade (ICB).

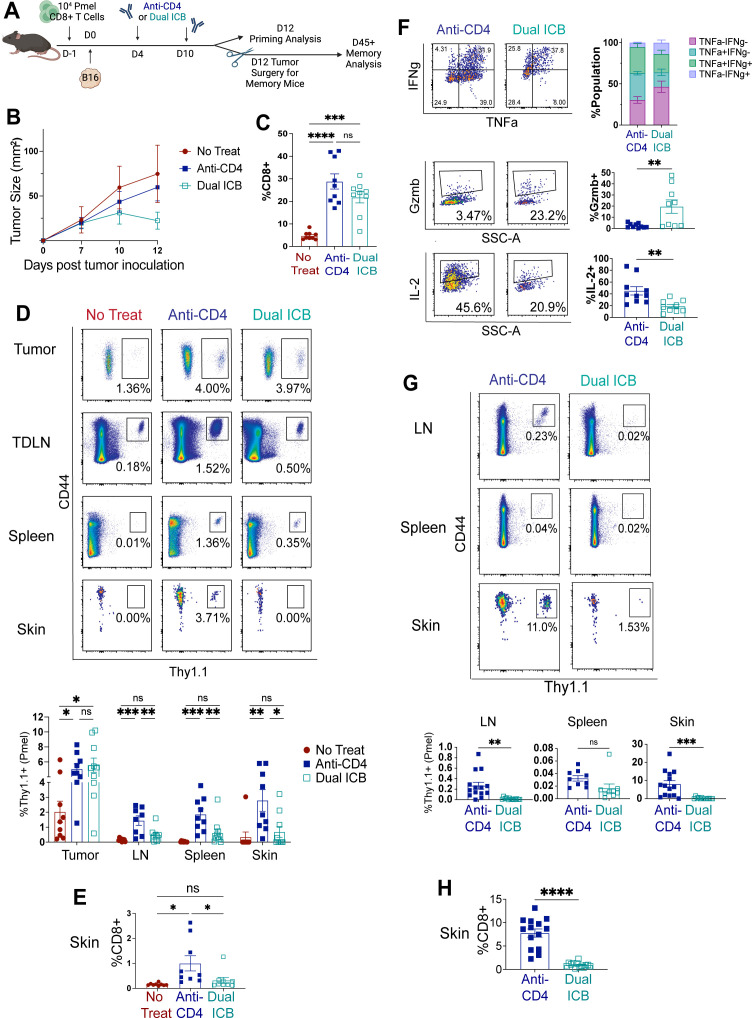
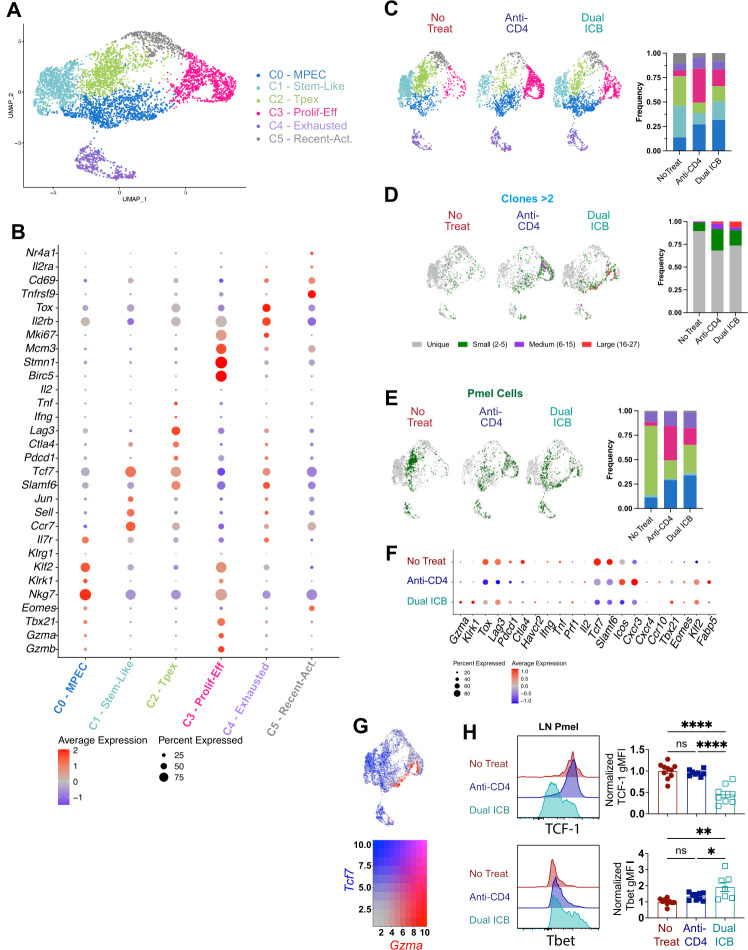
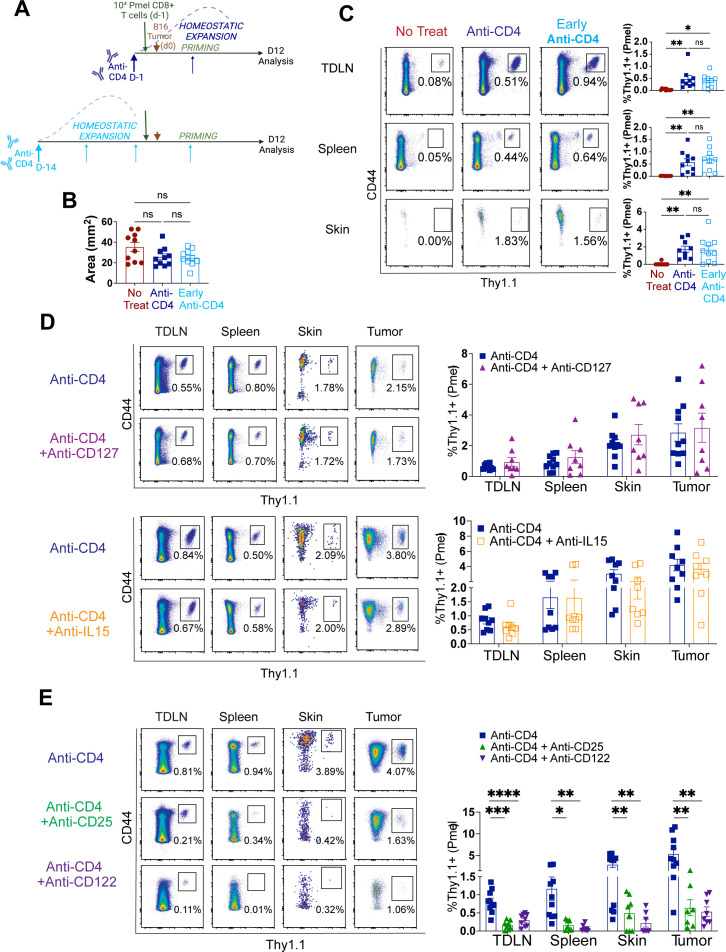
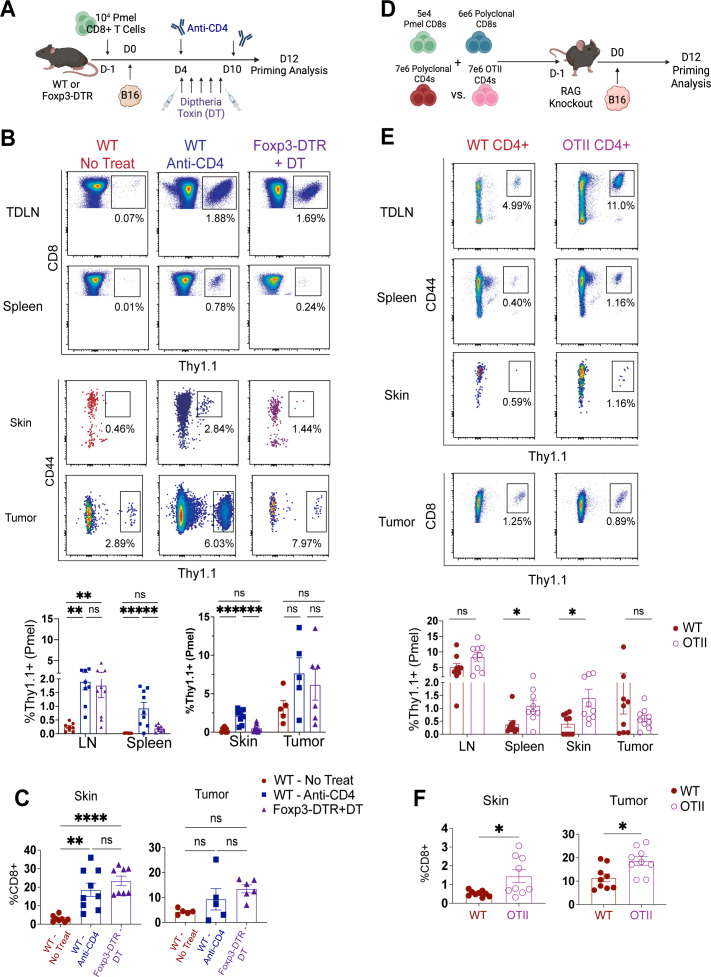
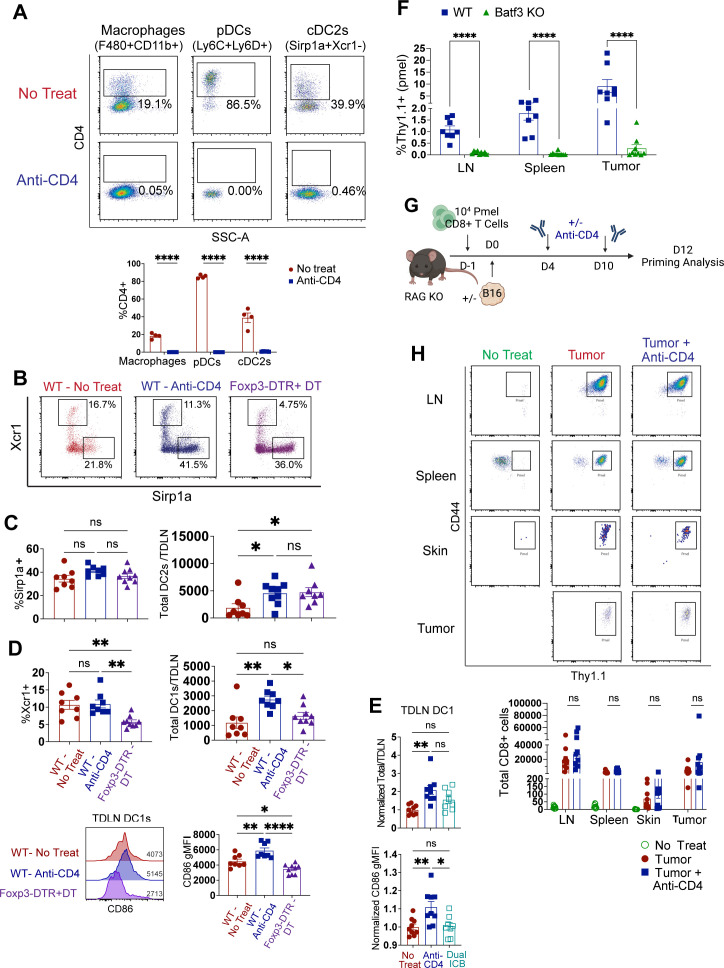
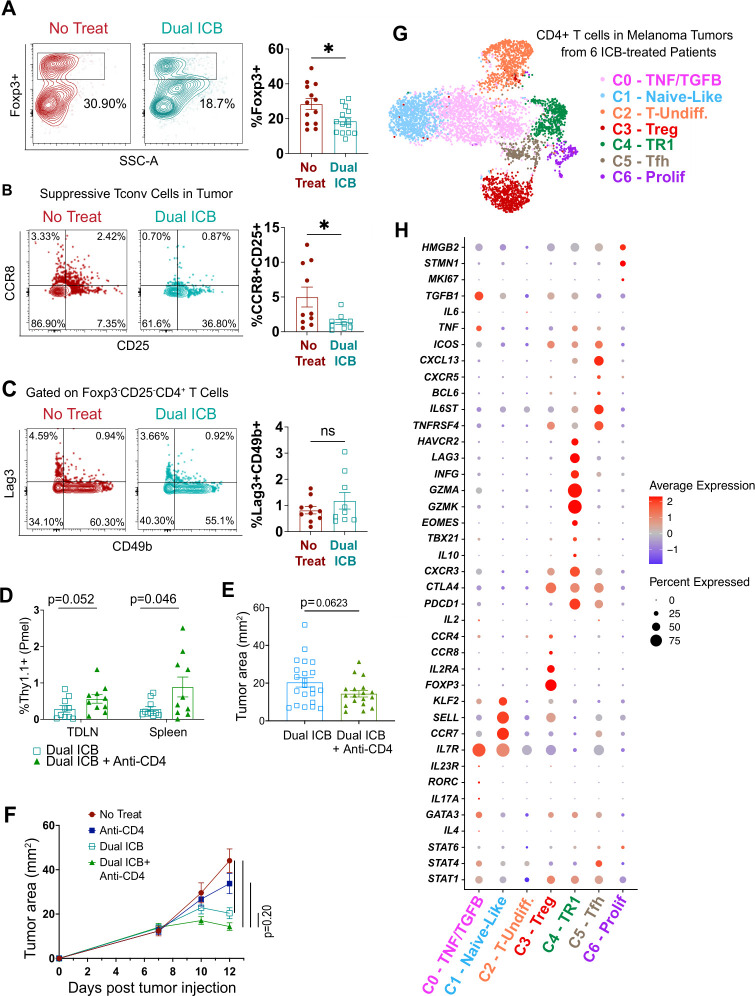
Results: Comparing anti-CD4 to dual ICB therapy, we show that anti-CD4 facilitates more robust priming of TCF-1+, IL-2-producing, tumor-specific CD8+ T cells that disseminate to tissues and form memory. By decoupling priming from homeostatic proliferation and associated cytokines, we find that anti-CD4 functions independently of creating homeostatic space for CD8+ T cells. We also show that depletion of CD4-expressing antigen-presenting cell subsets is not required for anti-CD4 efficacy. Instead, robust tumor-specific CD8+ T cell priming and memory generation required the removal of total antigen-specific CD4+ T cells, including both Tregs and CD4+ Foxp3-negative conventional (Tconv) cells. In particular, the elimination of CD4+ Tconv cells was necessary for the accumulation and maturation of conventional type-1 dendritic cells in tumor-draining LNs, which were required for CD8+ T cell priming. Accordingly, anti-CD4 treatment restored CD8+ T cell responses in mice cotreated with dual ICB. scRNAseq of melanoma tumors from patients who received ICB revealed the presence of Tr1 and Treg subsets, as well as CD4+ Tconv subsets that lacked clear transcriptional evidence of helper differentiation.

Conclusions: These findings underscore the underappreciated benefit of depleting CD4+ Tconv cells to promote systemic primary and memory CD8+ T cell responses against cancer.

Keywords: Immunosuppression; Immunotherapy; Memory; Monoclonal antibody; T cell.


Conflict of interest statement

Competing interests: None declared.

Figures

Figure 1
Figure 1. Priming, dissemination, and persistence of tumor Ag-specific CD8+ T cells is induced by treatment with anti-CD4 but not dual ICB (anti-CTLA-4 + anti-PD-1). (A) Naïve pmel CD8+T cells were transferred into mice 1 day prior to implanting intradermal B16 tumors. Mice were untreated or treated with either anti-CD4 or anti-PD1+ anti-CTLA-4 on days 4 and 10 after tumor inoculation. Flow cytometric analysis was performed on day 12 after tumor injections. (B) Tumor growth curves. (C) Proportion of CD8+ T cells in tumors on day 12, gated out of live lymphocytes. (D) Proportion of CD44hi Thy1.1+ pmel cells, gated out of live CD8+ T cells, in the indicated tissues on day 12, compared between treatment groups. (E) Normalized (relative to anti-CD4) proportion of CD8+ T cells in skin (gated on live lymphocytes) on day 12. (F) T cells from day 12 lymph nodes were restimulated for intracellular cytokine staining, and proportions of IFNγ,TNF-α, Gzmb, and IL-2-producing cells (gated on live CD8+Thy1.1+ pmel cells) were analyzed; gated on live CD8+Thy1.1+ pmel cells. (G) CD44hi Thy1.1+ pmel cells gated out of live CD8+ T cells, across tissues, at a memory timepoint (30 days after tumor excision surgery). (H) Proportion of CD8+ T cells in skin 30 days postsurgery; gated out of live CD45+lymphocytes. Each experiment was repeated at least two times with similar results and n≥4 mice per group; n.s. signifies a p>0.05. Data are pooled from two (C–F) or three (G, H) experiments. Each symbol represents an individual mouse, and flow plots depict representative mice; Bars signify the mean with error bars depicting SEM. For experiments with two groups, a paired t-test was used to determine statistical significance, and for those with more than two groups, a one-way ANOVA with multiple comparisons was used. ANOVA, analysis of variance; ICB, immune checkpoint blockade; TDLN, tumor draining lymph node; *p<0.05, **p<0.01, ***p<0.001, ****p<0.0001.
Figure 2
Figure 2. Compared with dual ICB, anti-CD4 induces a more diverse proliferating clonal repertoire, a reduction in progenitor-exhausted cells, and an enhancement in TCF7-expressing memory precursors. Endogenous CD44hi CD62Llo CD8+ T cells and CD44hi Thy1.1+ pmel cells were hashtag-labeled, FACS sorted and pooled (see online supplemental figure 1) from tdLNs of five untreated, five anti-CD4-treated, and five dual ICB-treated mice on day 12. Hashtag sequences were used to identify cells from each treatment group. Gene expression was determined by single-cell RNA sequencing (scRNAseq) of 460, 325, and 460 pmel cells and 1436, 1250, and 1355 endogenous effector cells from the no treat, anti-CD4 and Dual ICB groups, respectively. Using the 10X Genomics platform. The 10X Cellranger VdJ pipeline was used to determine TCR α and β-chain CDR3 sequences. (A) UMAP plots displaying 5204 cells from the treatment groups combined, with both RNA and TCR sequencing. Each dot represents a single cell. (B) DotPlot depicting cluster-defining genes. (C) UMAP plots depicting clustering by treatment group. (D) Plots depicting clonally expanded endogenous CD8+ T cells, by respective treatment group, superimposed on the overall UMAP (in gray). Colors depict overall level of clonal expansion, as specified in the legend; frequency of expanded clonotypes in each of the treatment groups is shown at right. (E) UMAP plot of pmel cells (in green), by treatment group, superimposed on the overall umap; frequency of pmel cells in each of the clusters from (A) is shown, at right. (F) Pseudobulk analysis of gene expression comparing pmel cells from each of the three different treatment groups, depicting relative expression of effector and memory-associated transcripts. (G) Blended FeaturePlot illustrating the overlap between Tcf7 and Gzma expression across clusters. Heatmap depicts colors that represent the extent of overlapping expression of each transcript. The colors in the upper right-hand corner depict the cells with the highest expression of each transcript that are simultaneously overlapping. Colors closer to each axis depict inverse expression of each transcript. (H) Flow cytometry analysis of Tcf1 and Tbet expression on pmel cells taken from tdLNs of anti-CD4 versus dual-ICB treated mice on day 12. Data are pooled from two independent experiments with similar results; one-way ANOVA with multiple comparisons was used to determine statistical significance, with n.s. indicating a p>0.05. For A-G, the analysis was done once. ANOVA, analysis of variance; ICB, immune checkpoint blockade; TDLN, tumor draining lymph node. *p<0.05, **p<0.01, ****p<0.0001.
Figure 3
Figure 3. IL-2 is required, but homeostatic space, IL-7, and IL-15 are all dispensible, for tumor Ag specific CD8+ T cell priming during anti-CD4 therapy. (A) As depicted, for B, C, mice were either left treated, or treated with anti-CD4 beginning either 14 days or 1 day(s) prior to transfer of 104 naïve pmel cells and B16 tumor cell inoculation on day 0. Proportion of CD44hi Thy1.1+ pmel cells out of live CD8+ T cells was analyzed across tissues, twelve days post tumor inoculation. (B) Tumor sizes on day 12. (C) Proportions of CD44hi Thy1.1+ pmel cells (gated on live CD8+ T cells) were analyzed across tissues on day 12. For (D, E) Pmel cells and B16 tumors were transferred and implanted into mice and mice were treated with anti-CD4 in addition to either PBS or neutralizing antibodies against CD127 or IL-15 (D) or CD25 or CD122 (E) on days 4 and 10 after tumor inoculation. Representative flow cytometry plots of proportions of pmel Thy1.1+ cells (gated out of live CD8+ T cells) across tissues from each treatment group are depicted with bar graphs adjacent to them. Bar graphs show mean and SEM of data. All experiments were repeated at least twice with n≥3 mice per group; data from each panel are pooled from two independent experiments. Flow plots depict representative mice; bars represent means and error bars represent SEM. One-way ANOVA with multiple comparisons was used to determine statistical significance for experiments with more than two groups. Paired t-test was used to determine statistical significance in experiments with two groups; n.s. indicates p>0.05. ANOVA, analysis of variance; TDLN, tumor draining lymph node; *p<0.05, **p<0.01, ***p<0.001, ****p<0.0001.
Figure 4
Figure 4. Removal of Ag-specific CD4+ T cells is required to induce systemic CD8+ T cell responses against tumor antigens. (A) Congenically marked Thy1.1+ pmel cells were transferred into Foxp3-DTR and WT B6 mice 1 day prior to tumor inoculation. WT mice were either untreated or treated with anti-CD4 on days 4 and 10 after tumor inoculation. Foxp3-DTR mice were treated for five consecutive days with DT beginning on day four post tumor injection. Tissues were harvested for flow cytometry analysis on day 12 after tumor inoculation. (B) Proportion of Thy1.1+ pmel cells; gated on live CD8+ T cells across tissues on day 12. (C) Proportion of total CD8+ T cells, gated on live CD45+ lymphocytes in skin and tumor on day 12. (D) RAG knockout mice were reconstituted with polyclonal CD8+ T cells and congenically marked pmel cells along with either polyclonal CD4+ T cells or OTII CD4+ T cells 1 day prior to tumor implantation. Tumors were left to grow for 12 days prior to analyzing pmel cell priming and dissemination by flow cytometry. (E) Proportion of CD44hi Thy1.1+ (TDLN, Spleen, Skin) or CD44hi (tumor) pmel cells, gated on live CD8+ T cells on day 12. (F) Proportion of total CD8+T cells, gated on live lymphocytes in skin and tumor on day 12. Experiments were repeated twice with n≥4 mice per group. Data are pooled from two independent experiments with similar results. Flow plots depict representative mice; bars represent means and error bars represent SEM One-way ANOVAs with multiple comparisons for experiments with three groups, and paired t-tests for experiments with two groups were used to determine statistical significance. ANOVA, analysis of variance; DT, diphtheria toxin; TDLN, tumor draining lymph node; WT, wild-type; *p<0.05, **p<0.01, ***p<0.001, ****p<0.0001.
Figure 5
Figure 5. cDC1-dependent priming of tumor-specific CD8+ T cells does not require depletion of CD4-expressing antigen-presenting cells. WT B6 mice were either untreated or treated with anti-CD4 on days 4 and 10 post intradermal B16 tumor implantation. TDLNs were digested and assessed by flow cytometry to identify various myeloid cell populations (A–D). (A) Flow plots of CD4+ non-T cells in WT tdLNs on day 12. (B) Flow plots showing cDC1 and cDC2s in tdLNs on day 12. Populations are gated out of live singlets, lymphocytes, F480/CD19 cells, CD11b±CD11c+/−, MHCII+Ly6C cells. Xcr1+Sirp1a cells are cDC1s and Xcr1Sirp1a+ cells are cDC2s. (C) Proportion of and total cDC2s per tdLN on day 12. (D) Proportion and total of cDC1s per tdLN on day 12. CD86 expression on cDC1s on day 12. (E) Mice were treated as described in figure 1A. Normalized (relative to no treat) number of cDC1s per TDLN and CD86 expression on cDC1s in TDLNs from untreated, anti-CD4 treated and dual ICB-treated mice. (F) Congenically marked pmel cells were transferred into WT B6 and Batf3 knockout mice 1 day prior to B16 implantation. Mice were treated with anti-CD4 on days 4 and 10 post tumor injection and then tissues were harvested on day 12 to assess priming by flow cytometry. Proportions CD44hi Thy1.1+ pmel cells out of CD8+ T cells across tissues in WT and Batf3 KO mice on day 12. (G) Naïve, congenically marked pmel cells were transferred into RAG knockout mice lacking CD4+ T cells. For two groups, intradermal B16 tumors were implanted 1 day later. Anti-CD4 treatment was given to deplete CD4+ non-APCs 4 days after tumor implantation. (G) Pmel cells across tissues on day 12 from RAG−/− mice reconstituted with pmel cells only. Experiments were repeated at least two times with similar results and n≥3 mice per group. Flow plots depict representative mice; bars represent means and error bars represent SEM. One-way ANOVA with multiple comparisons was used to determine statistical significance for experiments with more than two groups. Paired t-test was used to determine statistical significance in experiments with two groups. n.s. indicates p>0.05. ANOVA, analysis of variance; cDC2s, conventional type-2 dendritic cells; ICB, immune checkpoint blockade; TDLN, tumor draining lymph node; WT, wild-type; *p<0.05, **p<0.01, ****p<0.0001.
Figure 6
Figure 6. CD4+ Tconv cells with immunosuppressive features are present in mouse and human melanoma tumors following ICB therapy. (A–C) Mice were treated as described in figure 1A. After 12 days of growth, tumors were assessed by flow cytometry. (A) Flow plots of CD4+ Foxp3+ T cells (B) Foxp3CD25 Lag3+/-CD49b+/− CD4+ T cells. (C) Foxp3CCR8+/−CD25+/− CD4+ T cells. Bar graphs depict the mean and SEM. Experiments were repeated at least two times with n≥3 mice per group and similar results obtained each time. Data are pooled from 2 (B, C) or 3 (A) experiments. Paired t-tests were used to determine statistical significance. n.s. indicates p>0.05. (D–F) 104 naïve Pmel CD8+ T cells were transferred into mice 1 day prior to implanting intradermal B16 tumors. Mice were treated with either dual ICB or dual ICB + anti-CD4 on days 4 and 10 after tumor inoculation. (D) Pmel proportions (gated out of live CD8+) were assessed by flow cytometry on day 12. Bar graphs depict mean±SEM. Unpaired t-tests and Mann-Whitney U test were used to determine statistical significance. (E, F) Comparison between tumor sizes on day 12 (E), and growth curves (F) of B16 tumors in mice that were treated with dual ICB +/− anti-CD4 on days 4 and 10, as indicated. Unpaired t-test, and two-way ANOVA with multiple comparisons were used to determine statistical significance in E, F, respectively. (G) CD4+ TILs were FACs sorted from six different patients and submitted for scRNA seq using the 10X genomics platform. UMAP plot of 4738 cells from all patients. Each dot represents an individual cell. (H) DotPlot of defining genes for clusters. ANOVA, analysis of variance; ICB, immune checkpoint blockade; *p<0.05.

Similar articles

Cited by

References

    1. Nagai H, Horikawa T, Oka M, et al. Elimination of CD4+ T Cells Enhances Anti-Tumor Effect of Locally Secreted Interleukin-12 on B16 Mouse Melanoma and Induces Vitiligo-Like Coat Color Alteration. J Invest Dermatol. 2000;115:1059–64. doi: 10.1046/j.1523-1747.2000.00156.x. - DOI - PubMed
    1. Turk MJ, Guevara-Patiño JA, Rizzuto GA, et al. Concomitant tumor immunity to a poorly immunogenic melanoma is prevented by regulatory T cells. J Exp Med. 2004;200:771–82. doi: 10.1084/jem.20041130. - DOI - PMC - PubMed
    1. Yu P, Lee Y, Liu W, et al. Intratumor depletion of CD4+ cells unmasks tumor immunogenicity leading to the rejection of late-stage tumors. J Exp Med. 2005;201:779–91. doi: 10.1084/jem.20041684. - DOI - PMC - PubMed
    1. Sugiyama D, Nishikawa H, Maeda Y, et al. Anti-CCR4 mAb selectively depletes effector-type FoxP3+CD4+ regulatory T cells, evoking antitumor immune responses in humans. Proc Natl Acad Sci U S A. 2013;110:17945–50. doi: 10.1073/pnas.1316796110. - DOI - PMC - PubMed
    1. Rech AJ, Mick R, Martin S, et al. CD25 blockade depletes and selectively reprograms regulatory T cells in concert with immunotherapy in cancer patients. Sci Transl Med. 2012;4:134ra62. doi: 10.1126/scitranslmed.3003330. - DOI - PMC - PubMed

Substances