. 2024 Nov 9;15(11):811.
doi: 10.1038/s41419-024-07216-1.

Inhibition of VDAC1 oligomerization blocks cysteine deprivation-induced ferroptosis via mitochondrial ROS suppression

Affiliations

Inhibition of VDAC1 oligomerization blocks cysteine deprivation-induced ferroptosis via mitochondrial ROS suppression

Se-Kyeong Jang et al. Cell Death Dis. .

Abstract

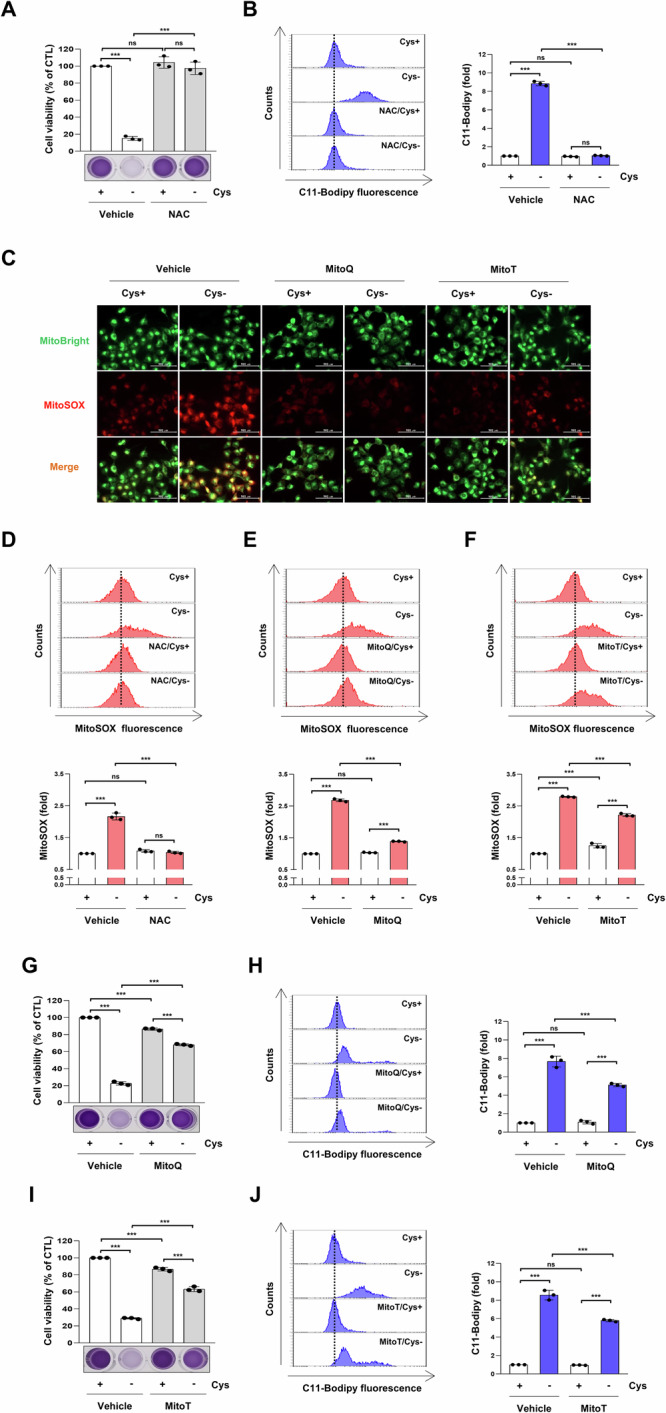
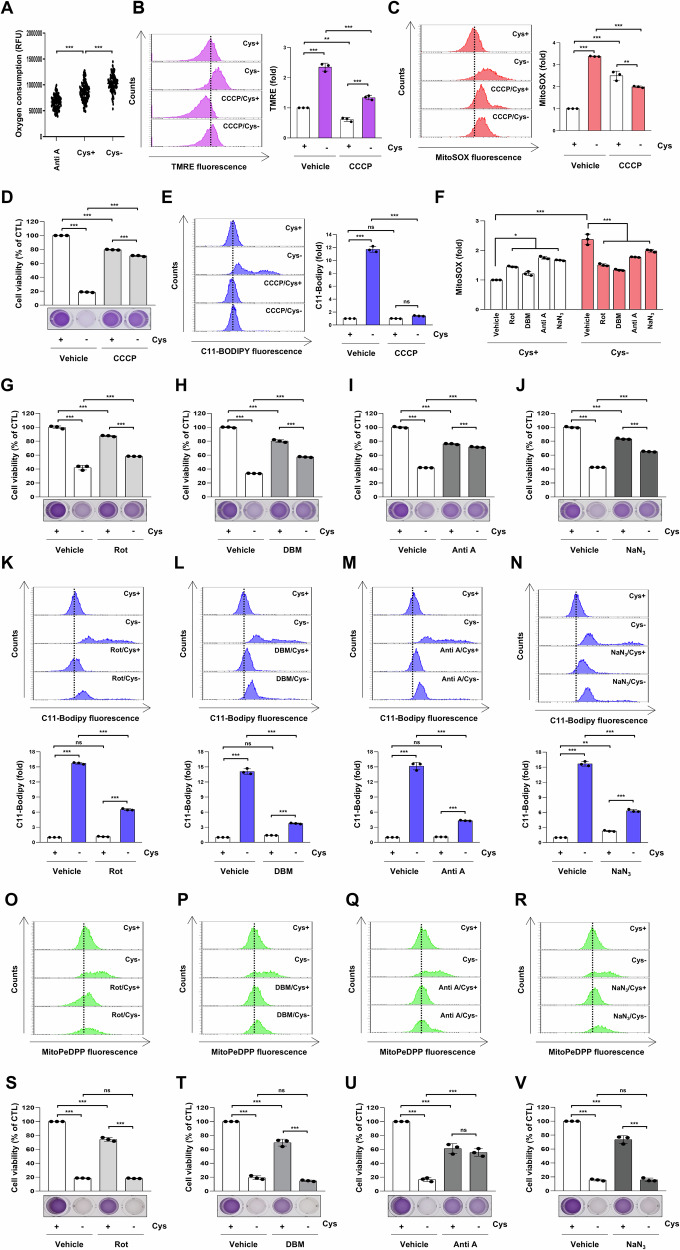
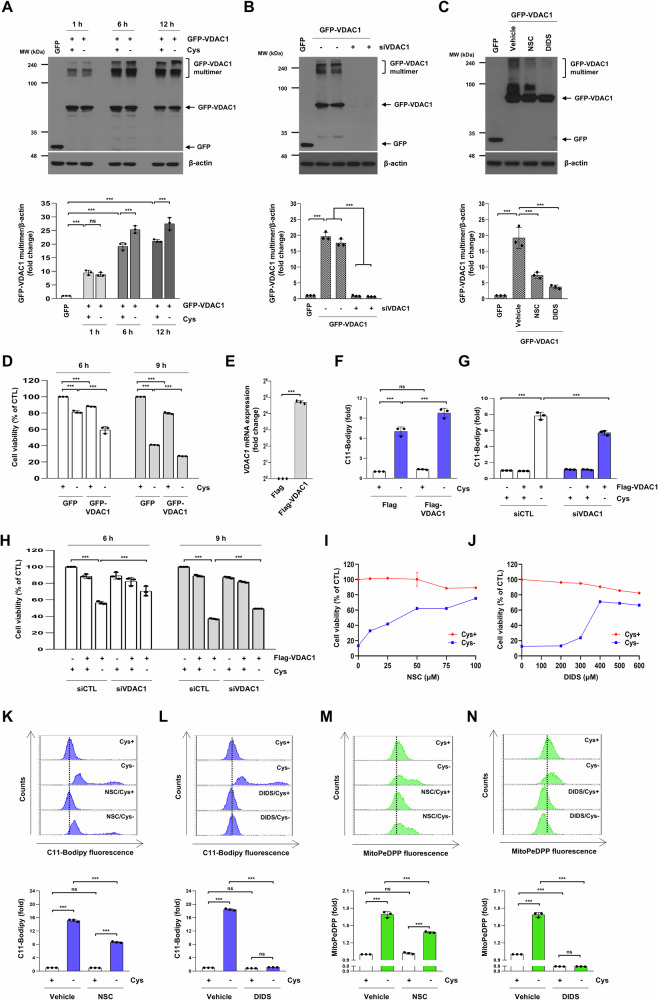
Ferroptosis, a regulated form of cell death dependent on reactive oxygen species (ROS), is characterized by iron accumulation and lethal lipid peroxidation. Mitochondria serve as the primary source of ROS and thus play a crucial role in ferroptosis initiation and execution. This study highlights the role of mitochondrial ROS and the significance of voltage-dependent anion channel 1 (VDAC1) oligomerization in ferroptosis induced by cysteine deprivation or ferroptosis-inducer RSL3. Our results demonstrate that the mitochondria-targeted antioxidants MitoQ and MitoT effectively block ferroptosis induction and that dysfunction of complex III of the mitochondrial electron transport chain contributes to ferroptosis induction. Pharmacological inhibitors that target VDAC1 oligomerization have emerged as potent suppressors of ferroptosis that reduce mitochondrial ROS production. These findings underscore the critical involvement of mitochondrial ROS production via complex III of the electron transport chain and the essential role of VDAC1 oligomerization in ferroptosis induced by cysteine deprivation or RSL3. This study deepens our understanding of the intricate molecular networks governing ferroptosis and provides insights into the development of novel therapeutic strategies targeting dysregulated cell death pathways.


Conflict of interest statement

The authors declare no competing interests.

Figures

Fig. 1
Fig. 1. Cysteine deprivation-induced ferroptosis.
A, B H1299 cells were incubated in a cysteine-deprived medium for the indicated time. CE H1299 cells were incubated in a control or cysteine-deprived medium with or without 2.5 μM Fer-1, 200 nM Lip-1, or 50 μM DFO for 24 h. A, CE Cell viability was measured by MTT assay, (n = 3; **p < 0.01, ***p < 0.001, ns not significantly different). FK H1299 cells were incubated in a control or cysteine-deprived medium with or without 2.5 μM Fer-1, 200 nM Lip-1, or 50 μM DFO for 12 h. B, FH A representative flow cytometry histogram of C11-BODIPY staining (upper panels) and the average MFI ± SD of C11-BODIPY staining (low panels) (n = 3; ***p < 0.001, ns not significantly different). IK A representative flow cytometry histogram of FerroOrange staining (upper panels) and the average MFI ± SD of FerroOrange staining (low panels) (n = 3; *p < 0.05, **p < 0.01, ***p < 0.001, ns not significantly different). Cys cysteine, DFO deferoxamine mesylate, Fer-1 ferrostatin-1, Lip-1 liproxstatin-1, MFI mean fluorescence intensity, SD standard deviation.
Fig. 2
Fig. 2. Mitochondrial ROS scavengers block ferroptosis.
A H1299 cells were incubated in a control or cysteine-deprived medium with or without 5 mM NAC for 24 h. B H1299 cells were incubated in a control or cysteine-deprived medium with or without 5 mM NAC for 12 h. C H1299 cells were incubated in a control or cysteine-deprived medium with or without 5 mM NAC, 1 μM MitoQ (ubiquinone derivative), or 200 μM MitoT (superoxide dismutase mimetic) for 12 h. A representative fluorescence microscopy image of MitoSOX red staining. The green fluorescence of MitoBright LT green shows the location of mitochondria (Scale bar = 100 μm). DF H1299 cells were incubated in a control or cysteine-deprived medium with or without 5 mM NAC, 1 μM MitoQ, or 200 μM MitoT for 12 h. A representative flow cytometry histogram of MitoSOX staining (upper panels) and the average MFI ± SD of MitoSOX staining (low panels) (n = 3; ***p < 0.001, ns not significantly different). G, I H1299 cells were incubated in a control or cysteine-deprived medium with or without 1 μM MitoQ or 200 μM MitoT for 24 h. A, G, and I Cell viability was measured by MTT assay (n = 3; ***p < 0.001, ns not significantly different). H, J H1299 cells were incubated in a control or cysteine-deprived medium with or without 1 μM MitoQ or 200 μM MitoT for 12 h. B, H, and J A representative flow cytometry histogram of C11-BODIPY staining (left panels) and the average MFI ± SD of C11-BODIPY staining (right panels) (n = 3; ***p < 0.001, ns not significantly different). Cys cysteine, MFI mean fluorescence intensity, MitoQ MitoQuinone, MitoT MitoTEMPO, NAC N-acetyl cysteine, SD standard deviation.
Fig. 3
Fig. 3. Inhibition of electron transport chain (ETC) activity blocks ferroptosis induced by cysteine deprivation.
A H1299 cells were incubated in a control or cysteine-deprived medium for 2 h. The oxygen consumption was measured using an extracellular oxygen consumption assay. The dots represent the values of oxygen consumption measured at 1.5 min intervals over a period of 180 min (n = 3; ***p < 0.001). H1299 cells treated with 75 μM Antimycin A for 2 h were used as a positive control for oxygen consumption rate inhibition. B, C, and E H1299 cells were incubated in a control or cysteine-deprived medium with or without 5 μM CCCP for 12 h. B A representative flow cytometry histogram of TMRE staining (left panel) and the average MFI ± SD of TMRE staining (right panel) (n = 3; **p < 0.01, ***p < 0.001). C A representative flow cytometry histogram of MitoSOX staining (left panel) and the average MFI ± SD of MitoSOX staining (right panel) (n = 3; **p < 0.01, ***p < 0.001). D H1299 cells were incubated in a control or cysteine-deprived medium with or without 5 μM CCCP for 24 h. F–R H1299 cells were incubated in control or cysteine-deprived medium with or without 200 nM Rotenone (complex I inhibitor), 1.5 mM DBM (complex II inhibitor), 75 μM Antimycin A (complex III inhibitor), or 1.5 mM NaN3 (complex IV inhibitor) for 12 h. F A representative flow cytometry of the average MFI ± SD of C11-BODIPY staining (n = 3; *p < 0.05, ***p < 0.001). E, KN A representative flow cytometry histogram of C11-BODIPY staining (left or upper panels) and the average MFI ± SD of C11-BODIPY staining (right or low panels) (n = 3; **p < 0.01, ***p < 0.001, ns not significantly different). OR A representative flow cytometry histogram of MitoPeDPP staining. SV H1299 cells were incubated in a control or cysteine-deprived medium with or without 200 nM Rotenone, 1.5 mM DBM, 75 μM Antimycin A, or 1.5 mM NaN3 for 24 h. D, GJ, and SV Cell viability was measured by MTT assay (n = 3; ***p < 0.001, ns not significantly different). Anti A antimycin A, Cys cysteine, DBM diethyl butylmalonate, NaN3 sodium azide, MFI mean fluorescence intensity, Rot rotenone, SD standard deviation, TMRE tetramethylrhodamine ethyl ester perchlorate.
Fig. 4
Fig. 4. Inhibition of VDAC1 oligomerization suppresses ferroptosis.
A H1299 cells were transfected with GFP or GFP-VDAC1 for 18 h and subsequently treated with a control or cysteine-deprived medium for the indicated time. B H1299 cells were co-transfected with CTL or VDAC1 siRNAs along with GFP or GFP-VDAC1 for 24 h. C H1299 cells were transfected with GFP or GFP-VDAC1 for 18 h and subsequently treated with 100 μM NSC15364 or 400 μM DIDS for 12 h. AC The indicated protein levels were estimated by western blot analysis. Band intensities of GFP-VDAC1 were quantified using Image (J), normalized to β-actin intensity, and plotted as a fold change relative to the control. D H1299 cells were transfected with GFP or GFP-VDAC1 for 18 h and subsequently treated with a control or cysteine-deprived medium for the indicated time. E H1299 cells were transfected with Flag or Flag-VDAC1 for 24 h. The indicated mRNA levels were estimated by quantitative real-time PCR analysis (n = 3; ***p < 0.001). F H1299 cells were transfected with Flag or Flag-VDAC1 for 18 h and subsequently treated with control or cysteine-deprived medium for 9 h. G, H H1299 cells were co-transfected with CTL or VDAC1 siRNAs along with Flag or Flag-VDAC1 for 18 h and subsequently treated with control or cysteine-deprived medium for the indicated time (H) or 9 h (G). I, J H1299 cells were incubated in a control or cysteine-deprived medium with or without NSC15364 or DIDS for the indicated concentration for 24 h. D, H, I, and J Cell viability was measured by MTT assay (n = 3; ***p < 0.001). KN H1299 cells were incubated in a control or cysteine-deprived medium with or without 100 μM NSC15364 or 400 μM DIDS for 12 h. F, G A representative flow cytometry of the average MFI ± SD of C11-BODIPY staining (n = 3; ***p < 0.001, ns not significantly different). K, L A representative flow cytometry histogram of C11-BODIPY staining (upper panels) and the average MFI ± SD of C11-BODIPY staining (low panels) (n = 3; ***p < 0.001, ns not significantly different). M, N A representative flow cytometry histogram of MitoPeDPP staining (upper panels) and the average MFI ± SD of MitoPeDPP staining (low panels) (n = 3; ***p < 0.001, ns not significantly different). CTL control, Cys cysteine, MFI mean fluorescence intensity, NSC NSC15364, SD standard deviation.
Fig. 5
Fig. 5. Inhibition of VDAC1 oligomerization blocks cysteine deprivation-induced ferroptosis via mitochondrial ROS suppression.
AE H1299 cells were incubated in a control or cysteine-deprived medium with or without 100 μM NSC15364 or 400 μM DIDS for 12 h. A A representative fluorescence microscopy image of MitoSOX red staining. The green fluorescence of MitoBright LT green shows the location of mitochondria (scale bar = 100 μm). B, C A representative flow cytometry histogram of MitoSOX staining (upper panels) and the average MFI ± SD of MitoSOX staining (low panels) (n = 3; *p < 0.05, ***p < 0.001, ns not significantly different). D, E A representative flow cytometry histogram of TMRE staining. F H1299 cells were incubated in a control or cysteine-deprived medium with or without 100 μM NSC15364 or 400 μM DIDS for 2 h. The oxygen consumption was measured using an extracellular oxygen consumption assay. The dots represent the values of oxygen consumption measured at 1.5-min intervals over a period of 180 min. H1299 cells treated with 75 μM Antimycin A for 2 h were used as a positive control for oxygen consumption rate inhibition, (n = 3; ***p < 0.001, ns not significantly different). Anti A antimycin A, Cys cysteine, MFI mean fluorescence intensity, NSC NSC15364, SD standard deviation, TMRE tetramethylrhodamine ethyl ester perchlorate.
Fig. 6
Fig. 6. Cysteine deprivation-induced ferroptosis is calcium-independent.
A H1299 cells were incubated in a control or cysteine-deprived medium with or without 50 μM DFO or 5 μM BAPTA for 24 h. Cell viability was measured by MTT assay, (n = 3; ***p < 0.001, ns not significantly different). B H1299 cells were incubated in a control or cysteine-deprived medium with or without 50 μM DFO or 5 μM BAPTA for 12 h. A representative flow cytometry histogram of C11-BODIPY staining (left panel) and the average MFI ± SD of C11-BODIPY staining (right panel) (n = 3; ***p < 0.001). Cys cysteine, DFO deferoxamine, MFI mean fluorescence intensity, SD standard deviation.
Fig. 7
Fig. 7. Inhibition of VDAC1 oligomerization blocks RSL3-mediated ferroptosis.
A H1299 cells were treated with 200 nM RSL3 and 100 μM NSC15364 for 18 h. Cell viability was measured by MTT assay, (n = 3; *p < 0.05, ***p < 0.001). BE H1299 cells were treated with 200 nM RSL3 and 100 μM NSC15364 for 9 h. B A representative flow cytometry histogram of C11-BODIPY staining (left panel) and the average MFI ± SD of C11-BODIPY staining (right panel) (n = 3; ***p < 0.001, ns not significantly different). C A representative flow cytometry histogram of MitoPeDPP staining (left panel) and the average MFI ± SD of MitoPeDPP staining (right panel) (n = 3; **p < 0.01, ***p < 0.001). D A representative flow cytometry histogram of MitoSOX staining (left panel) and the average MFI ± SD of MitoSOX staining (right panel) (n = 3; ***p < 0.001, ns not significantly different). E A representative flow cytometry histogram of TMRE staining (left panel) and the average MFI ± SD of TMRE staining (right panel) (n = 3; ***p < 0.001, ns not significantly different). F H1299 cells were treated with 200 nM RSL3 and 100 μM NSC15364 for 2 h. The oxygen consumption was measured using an extracellular oxygen consumption assay. The dots represent the values of oxygen consumption measured at 1.5-min intervals over a period of 180 min. H1299 cells treated with 75 μM Antimycin A for 2 h were used as a positive control for oxygen consumption rate inhibition, (n = 3; ***p < 0.001). Anti A antimycin A, Cys cysteine, MFI mean fluorescence intensity, NSC NSC15364, SD standard deviation, TMRE tetramethylrhodamine ethyl ester perchlorate.
Fig. 8
Fig. 8. Inhibition of VDAC1 oligomerization suppresses ferroptosis in various cell lines.
A, B MDA-MB-231 cells were incubated in a control or cysteine-deprived medium with or without NSC15364 or DIDS for the indicated concentration for 24 h. C, D HEYA8 cells were incubated in a control or cysteine-deprived medium with or without NSC15364 or DIDS for the indicated concentration for 24 h. AD Cell viability was measured by MTT assay (n = 3). E, G, I, and K MDA-MB-231 cells were incubated in a control or cysteine-deprived medium with or without 100 μM NSC15364 or 400 μM DIDS for 12 h. F, H, J, and L HEYA8 cells were incubated in a control or cysteine-deprived medium with or without 100 μM NSC15364 or 400 μM DIDS for 16 h. E, F A representative flow cytometry histogram of C11-BODIPY staining (upper panels) and the average MFI ± SD of C11-BODIPY staining (low panels) (n = 3; **p < 0.01, ***p < 0.001, ns not significantly different). G, H A representative flow cytometry histogram of MitoPeDPP staining (upper panels) and the average MFI ± SD of MitoPeDPP staining (low panels) (n = 3; *p < 0.05, ***p < 0.001). I, J A representative flow cytometry histogram of MitoSOX. K, L A representative flow cytometry histogram of TMRE. Cys cysteine, MFI mean fluorescence intensity, NSC NSC15364, SD standard deviation, TMRE tetramethylrhodamine ethyl ester perchlorate.

References

    1. Stockwell BR, Friedmann Angeli JP, Bayir H, Bush AI, Conrad M, Dixon SJ, et al. Ferroptosis: a regulated cell death nexus linking metabolism, redox biology, and disease. Cell. 2017;171:273–85. - PMC - PubMed
    1. Dixon SJ, Lemberg KM, Lamprecht MR, Skouta R, Zaitsev EM, Gleason CE, et al. Ferroptosis: an iron-dependent form of nonapoptotic cell death. Cell. 2012;149:1060–72. - PMC - PubMed
    1. Chen X, Kang R, Kroemer G, Tang D. Broadening horizons: the role of ferroptosis in cancer. Nat Rev Clin Oncol. 2021;18:280–96. - PubMed
    1. Poltorack CD, Dixon SJ. Understanding the role of cysteine in ferroptosis: progress & paradoxes. FEBS J. 2022;289:374–85. - PMC - PubMed
    1. Ziegler DM. Role of reversible oxidation–reduction of enzyme thiols-disulfides in metabolic regulation. Annu Rev Biochem. 1985;54:305–29. - PubMed

MeSH terms

LinkOut - more resources