. 2024 Nov 9;15(1):9723.
doi: 10.1038/s41467-024-54081-9.

In situ editing of tumour cell membranes induces aggregation and capture of PD-L1 membrane proteins for enhanced cancer immunotherapy

Affiliations

In situ editing of tumour cell membranes induces aggregation and capture of PD-L1 membrane proteins for enhanced cancer immunotherapy

Chunping Mao et al. Nat Commun. .

Abstract

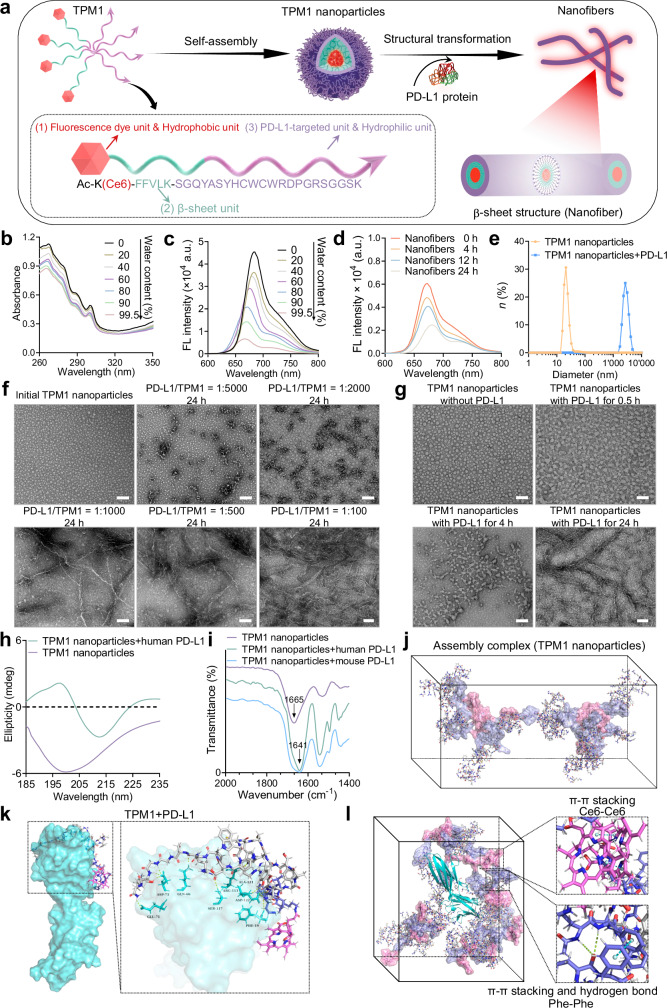
Immune checkpoint blockade (ICB) therapy has emerged as a new therapeutic paradigm for a variety of advanced cancers, but wide clinical application is hindered by low response rate. Here we use a peptide-based, biomimetic, self-assembly strategy to generate a nanoparticle, TPM1, for binding PD-L1 on tumour cell surface. Upon binding with PD-L1, TPM1 transforms into fibrillar networks in situ to facilitate the aggregation of both bound and unbound PD-L1, thereby resulting in the blockade of the PD-1/PD-L1 pathway. Characterizations of TPM1 manifest a prolonged retention in tumour ( > 7 days) and anti-cancer effects associated with reinvigorating CD8+ T cells in multiple mice tumour models. Our results thus hint TPM1 as a potential strategy for enhancing the ICB efficacy.


Conflict of interest statement

All authors declare no competing interests.

Figures

Fig. 1
Fig. 1. Assembly and fibrillar transformation of TPM1 and molecule simulation.
a Schematic illustration of self-assembly of TPM1 and structural transformation after incubation with PD-L1 protein. b, c UV-vis absorption (b) and fluorescence intensity (c) of Ce6 following the gradual addition of water (from 0 to 99.5%) to the DMSO solution of TPM1 nanoparticles. Each experiment was independently repeated three times with similar results. excitation wavelength, 405 nm. a.u., arbitrary units. d Fluorescence (FL) intensity of Ce6 from TPM1 nanoparticles at different time points. Experiment was independently repeated three times with similar results. a.u., arbitrary units. e The size distribution of the initial TPM1 nanoparticles and TPM1 nanoparticles incubated with human PD-L1 protein at the molar ratio of human PD-L1 protein/TPM1 of 1/1000 after 24 h. Experiment was independently repeated three times with similar results. f TEM images of the initial TPM1 nanoparticles and nanofibers transformed from TPM1 nanoparticles after incubation with human PD-L1 protein (MW≈26.8 kDa) at different molar ratios. Experiment was independently repeated three times with similar results. Scale bars, 100 nm. g TEM images of the initial TPM1 nanoparticles and nanofibers transformed from TPM1 nanoparticles after incubation with human PD-L1 protein (MW≈26.8 kDa) at different time points. The molar ratio of human PD-L1 protein/TPM1 was approximately 1/1000. Experiment was independently repeated three times with similar results. Scale bars, 100 nm. h CD spectra of initial TPM1 nanoparticles and TPM1 nanoparticles incubation with human PD-L1 protein for 24 h at the molar ratio of human PD-L1 protein/TPM1 of 1/1000. mdeg, millidegrees. Experiment was independently repeated three times with similar results. i FTIR spectra of initial TPM1 nanoparticles and TMP1 nanoparticles incubated with human or mouse PD-L1 protein for 24 h at the molar ratio of PD-L1 protein/TPM1 of 1/1000. Experiment was independently repeated three times with similar results. j Molecular simulation of transformation of TPM1 into complex (i.e., TPM1 nanoparticles) in water box based on hydrophobic core through hydrophobic interaction and π–π stacking of Ce6 molecules along with hydrophilic corona formed by PD-L1-targeted ligands. k Molecular docking simulation for TPM1 and PD-L1 (light green, PDB ID: 3BIS). Rectangle: the possible binding sites between TPM1 and PD-L1. l Molecular dynamics simulation of fibrillar transformation of TPM1 generated at t = 20 ns after interaction with PD-L1. Rectangle: the interaction forces of Ce6-Ce6 and Phe-Phe. Source data for (be, h, i) are provided as a Source Data file.
Fig. 2
Fig. 2. Fibrillar transformation of TPM1 on the cell membrane of PD-L1+ tumour cells.
a Representative western blots of PD-L1 in HFF, SKBR-3, and 4T1 cells (n = 3 independent experiments). b Quantitation of relative expression level of PD-L1 in HFF, SKBR-3, and 4T1 cells. Data are presented as mean ± SD (n = 3 independent experiment). Statistical analysis was performed using one-way ANOVA with a Tukey post hoc test. c Flow cytometry analysis of the surface expression of the PD-L1 on HFF, SKBR-3, and 4T1 cells. Experiment was independently repeated three times with similar results. d CLSM images of TPM1 nanoparticles (red) after interaction with SKBR-3, 4T1, and HFF cells for 4 h. Experiment was independently repeated three times with similar results. Scale bars, 20 μm. e CLSM images of TPM2 and TPM3 nanoparticles (red) after interaction with SKBR-3 and 4T1 cells. Each experiment was independently repeated three times with similar results. Scale bar, 20 μm. f SEM images of SKBR-3, 4T1, and HFF cells before (Untreated) and after TPM1 (TPM1 4 h), TPM2 (TPM2 4 h) and TPM3 (TPM3 4 h) treatments for 4 h. Rectangle: magnified insert. Experiment was independently repeated three times with similar results. g TEM images of untreated SKBR-3 cells (Untreated SKBR-3) and SKBR-3 cells treated with TPM1 nanoparticles (SKBR-3 + TPM1 24 h) for 24 h. Red arrows indicate the nanofibrillar networks. Experiment was independently repeated three times with similar results. Scale bar, 500 nm. h CLSM images of SKBR-3, 4T1, and HFF cells after incubation with TPM1 nanoparticles (red) for 24 h. Experiment was independently repeated three times with similar results. Scale bars, 20 μm. i CLSM images of SKBR-3 cells after incubation with TPM1 nanoparticles (red) followed by incubation with FITC-labelled anti-PD-L1 antibody (PD-L1 Ab, green). Experiment was independently repeated three times with similar results. FITC-labelled anti-PD-L1 antibody was used to detect PD-L1 on the cell membrane of the SKBR-3 cell. The overlap picture was drawn using MATLAB. Scale bars, 20 μm. Source data for (a, b) are provided as a Source Data file.
Fig. 3
Fig. 3. Biologic effects of the fibrillar-transformable TPM1 in vitro.
a CLSM image of SKBR-3 cells after incubation with TPM1 nanoparticles (red) and biotinylated PD-1 protein (green). Biotinylated PD-1 was labelled with Alexa Fluor™ 488-conjugated streptavidin. Experiment was independently repeated three times with similar results. Scale bar, 20 μm. b CLSM images of SKBR-3 cells incubated with TPM1 nanoparticles (red) for 4 h after treatment with or without IFN-γ (100 ng/mL) for 24 h. Experiment was independently repeated three times with similar results. Scale bars, 20 μm. c SEM images of SKBR-3 cells incubated with TPM1 nanoparticles (red) for 4 h after treatment with or without IFN-γ (100 ng/mL) for 24 h. Experiment was independently repeated three times with similar results. Rectangle: magnified insert. d CLSM images of SKBR-3 cells transfected with pGIPZ-PD-L1-EGFP plasmid (green) after treatment with TPM1 nanoparticles at different times. Experiment was independently repeated three times with similar results. White arrows indicate aggregation of PD-L1 protein. Scale bars, 5 μm. e CLSM images of SKBR-3 cells, SKBR-3 cells treated with Y-27632, and SKBR-3 cells expressing constitutively active RhoA V14 mutant after incubation with TPM1 nanoparticles (red) for 4 h. Experiment was independently repeated three times with similar results. Scale bars, 20 μm. f Quantitative analysis of relative fluorescence (FL) density of SKBR-3 cells, SKBR-3 cells treated with Y-27632, and SKBR-3 cells expressing constitutively active RhoA V14 mutant after incubation with TPM1 nanoparticles for 4 h. Data are presented as mean ± SD (n = 13 independent experiments). Statistical analysis was performed using one-way ANOVA with a Tukey post hoc test. g Schematic of the procedure for nanopillar cellular traction force measurement by microscopy. h The cellular force (F) of SKBR-3 cells with or without treatment of TPM1 nanoparticles. Experiment was independently repeated three times with similar results. Source data for (f, h) are provided as a Source Data file.
Fig. 4
Fig. 4. Immunotherapeutic effects of TPM1 on 4T1 cells in vitro.
a Experimental scheme for co-culture of activated CD8+ T cells and 4T1 tumour cells. CD8+ T cells were isolated from the mouse spleen, proliferated with IL-2, and activated with anti-CD3 and anti-CD28 Dynabeads. After activated CD8+ T cells were co-cultured with 4T1 cells, treatment of TPM1 nanoparticles was administrated. b SEM images of 4T1 cells and co-cultured CD8+ T cells after incubation with TPM1 nanoparticles for 4 h. Experiment was independently repeated five times with similar results. Scale bars, 1 μm. c and d The concentrations of IFN-γ (c) and GZMB (d) secreted by activated CD8+ T cells and in the co-culture supernatants of activated CD8+ T cells with 4T1 cells or 4T1 cells treated with anti-PD-L1 antibody (68 nM; Selleck, A2004), PD-L1-targeted peptides, TPM1 nanoparticles, TPM2 nanoparticles, or TPM3 nanoparticles. Data are presented as mean ± SD (n = 5 independent experiments). Statistical analysis was performed using ANOVA with a Tukey post hoc test; ns not significant. e Cellular viability of 4T1 cells treated with anti-PD-L1 antibody (68 nM; Selleck, A2004), PD-L1-targeted peptides, and TPM1 nanoparticles, TPM2 nanoparticles and TPM3 nanoparticles after co-culture with or without activated CD8+ T cells for 24 h. Data are presented as mean ± SD (n = 5 independent experiments). Statistical analysis was performed using one-way ANOVA with a Tukey post hoc test. f CLSM images of live 4T1 cells stained with Calcein-AM after treatments of anti-PD-L1 antibody (68 nM; Selleck, A2004), PD-L1-targeted peptides, and TPM1 nanoparticles, TPM2 nanoparticles and TPM3 nanoparticles after co-culture with or without activated CD8+ T cells. Scale bars, 200 μm. Experiment was independently repeated three times with similar results. Source data for (ce) are provided as a Source Data file.
Fig. 5
Fig. 5. Pharmacokinetics, bio-distribution and immunotherapeutic effect of TPM1 nanoparticles in 4T1 mouse model of breast cancer.
a In vivo blood pharmacokinetics of TPM1. The C-max, AUC, and T1/2 (h) were calculated by Kinetica 5.0. Data are mean ± SD (n = 3 independent experiments). b Quantitative analysis of ex vivo fluorescence images of tumour and main organs including heart (H), liver (Li), spleen (Sp), lung (Lu), kidney (K), intestine (I), and muscle (M) at later time points after intravenous injection of TPM1 nanoparticles in mice bearing 4T1 breast cancer. Data are presented as mean ± SD (n = 3 independent experiments). c Time-dependent ex vivo fluorescence images of tumour (T) and major organs at a later time point (10 h, 24 h, 48 h, 72 h, and 168 h) after intravenous injection of TPM1 nanoparticles in mice bearing 4T1 breast cancer. Images were representative shown out of 3 independent mice per group. d Schematic of tumour inoculation and treatment protocol for 4T1 mouse model of breast cancer. After the establishment of animal tumour model, mice bearing 4T1 breast cancer mice received five different treatments, including intravenous injection of PBS (200 μL per injection), intravenous injections of TPM1(13 mg/kg per injection), TPM2 (13 mg/kg per injection) or TPM3 nanoparticles (13 mg/kg per injection), or intraperitoneal injection of anti-PD-L1 antibody (5 mg/kg per injection; Selleck, A2004) every two days for nine days. e Tumour growth curves of 4T1 tumour-bearing mice after the five different treatments. Data are presented as mean ± SD (n =  5 mice in five independent groups). Statistical analysis was performed using two-way ANOVA with a Tukey post hoc test. f Representative gross images of tumours excised from 4T1 tumour-bearing mice after the five different treatments (n = 5 independent experiments). g Box plots of spleen weight excised from 4T1 tumour-bearing mice after the five different treatments (n = 5 independent experiments). Central bands denote medians. Boxes represent the interquartile range and whiskers represent maxima and minima. Dots represent individual data points. Statistical analysis was performed using one-way ANOVA with a Tukey post hoc test. h Cumulative survival of mice bearing 4T1 tumours after the five different treatments (n = 8 independent experiments). Statistical analysis of the survival curve was performed using the Log-rank test (Mantel-Cox). i Representative micrographs of hematoxylin-eosin (HE), Ki67, and terminal deoxynucleotidyl transferase-mediated dUTP-biotin nick end-labelling (TUNEL) staining of tumour specimens from 4T1 tumour-bearing mice after the five different treatments. Images were representative shown out of 5 independent mice per group. Scale bars, 50 μm. j Body weights of 4T1 tumour-bearing mice after the five different treatments. Data are presented as mean ± SD (n = 5 independent experiments). ns not significant (two-way ANOVA with a Tukey post hoc test). km Pro-inflammatory cytokines including TNF (k), IL-6 (l), and IL-1β (m) in the serum measured after a single dose of five different treatments at 21 days. Data are presented as mean ± SD (n = 5 independent experiments). ns not significant (one-way ANOVA with a Tukey post hoc test). Source data for (a, b, e, g, h, jm) are provided as a Source Data file.
Fig. 6
Fig. 6. Immunotherapeutic effect of TPM1 nanoparticles in mouse model of LLC pulmonary cancer.
a Schematic of tumour inoculation and treatment protocol for mice model of LLC pulmonary cancer. After the establishment of the animal tumour model, mice bearing LLC pulmonary cancer received five different treatments, including intravenous injection of PBS (200 μL per injection), intravenous injections of TPM1 (13 mg/kg per injection), TPM2 (13 mg/kg per injection) or TPM3 nanoparticles (13 mg/kg per injection), or intraperitoneal injection of anti-PD-L1 antibody (5 mg/kg per injection; Selleck, A2004) every two days for nine days. b Tumour growth curves for LLC tumour-bearing mice after the five different treatments. Data are presented as mean ± SD (n =  5 mice in five independent groups). Statistical analysis was performed using two-way ANOVA calculated statistical significance with a Tukey post hoc test. c Body weights of LLC tumour-bearing mice after the five different treatments. Data are presented as mean ± SD (n = 5 independent experiments). Statistical significance was calculated using two-way ANOVA with a Tukey post hoc test. ns not significant (two-way ANOVA with a Tukey post hoc test). di Flow cytometry analysis of the ratio of CD8+ T cells (d) and the ratio of Foxp3+ T cells (e) to CD45+CD3+CD4+ cells within LLC tumour tissues after the five different treatments, and the ratios of GZMB+ T cells (f), IFN-γ+ T cells (g), IL-2+ T cells (h), and TNF+ T cells (i) to CD8+ T cells within LLC tumour tissues after the five different treatments (n = 6 in five independent groups). Data are presented as mean ± SD. Statistical analysis was performed using one-way ANOVA with a Tukey post hoc test. ns not significant. j The relative mRNA expressions of GZMB, IFN-γ, IL-2, and TNF genes in LLC tumour tissues in mice bearing LLC pulmonary cancer after the five different treatments determined by quantitative real-time reverse transcription PCR. Data are presented as mean ± SD (n = 5 mice in five independent groups). Statistical analysis was performed using one-way ANOVA with a Tukey post hoc test. ns not significant. Source data for (bj) are provided as a Source Data file.
Fig. 7
Fig. 7. Enhanced anti-cancer activity of TPM1 nanoparticles in mouse model of 4T1 breast cancer via reinvigorating CD8+ T cells.
a Representative micrographs of immunohistochemistry and immunofluorescent staining of CD4 and CD8 in tumour tissues from mice bearing 4T1 breast cancer after receiving five different treatments including intravenous injection of PBS (200 μL per injection), intravenous injections of TPM1 (13 mg/kg per injection), TPM2 (13 mg/kg per injection) or TPM3 nanoparticles (13 mg/kg per injection), or intraperitoneal injection of anti-PD-L1 antibody (5 mg/kg per injection; Selleck, A2004) every two days for nine days. Images were representative shown out of 5 independent mice per group. Scale bars, 50 μm. b Flow cytometry analysis of the ratios of CD8+ T cells and CD4+ T cells to CD45+ CD3+ T cells in tumour tissues from mice bearing 4T1 breast cancer after the five different treatments (n = 6 mice in five independent groups). c Flow cytometry analysis of the ratio of Foxp3+ T cells to CD45+CD3+CD4+ T cells in tumour tissues from mice bearing 4T1 breast cancer after the five different treatments (n = 6 mice in five independent groups). d Flow cytometry analysis of the ratios of GZMB-, IFN-γ-, IL-2-, and TNF-producing CD8+ T cells to CD45+ CD3+ T cells in tumour tissues from mice bearing 4T1 breast cancer after the five different treatments (n = 6 mice in five independent groups).

Similar articles

Cited by

References

    1. Chow, A., Perica, K., Klebanoff, C. A. & Wolchok, J. D. Clinical implications of T cell exhaustion for cancer immunotherapy. Nat. Rev. Clin. Oncol.19, 775–790 (2022). - PMC - PubMed
    1. Konishi, J. et al. B7-H1 expression on non-small cell lung cancer cells and its relationship with tumour-infiltrating lymphocytes and their PD-1 expression. Clin. Cancer Res.10, 5094–5100 (2004). - PubMed
    1. Dong, H., Zhu, G., Tamada, K. & Chen, L. B7-H1, a third member of the B7 family, co-stimulates T-cell proliferation and interleukin-10 secretion. Nat. Med.5, 1365–1369 (1999). - PubMed
    1. Zou, W., Wolchok, J. D. & Chen, L. PD-L1 (B7-H1) and PD-1 pathway blockade for cancer therapy: mechanisms, response biomarkers, and combinations. Sci. Transl. Med.8, 328rv4 (2016). - PMC - PubMed
    1. Zhang, R. et al. D-mannose facilitates immunotherapy and radiotherapy of triple-negative breast cancer via degradation of PD-L1. Proc. Natl Acad. Sci. USA119, e2114851119 (2022). - PMC - PubMed

Publication types

MeSH terms

LinkOut - more resources