. 2024 Nov 9;15(1):9722.
doi: 10.1038/s41467-024-53729-w.

Multiplexed expansion revealing for imaging multiprotein nanostructures in healthy and diseased brain

Affiliations

Multiplexed expansion revealing for imaging multiprotein nanostructures in healthy and diseased brain

Jinyoung Kang et al. Nat Commun. .

Abstract

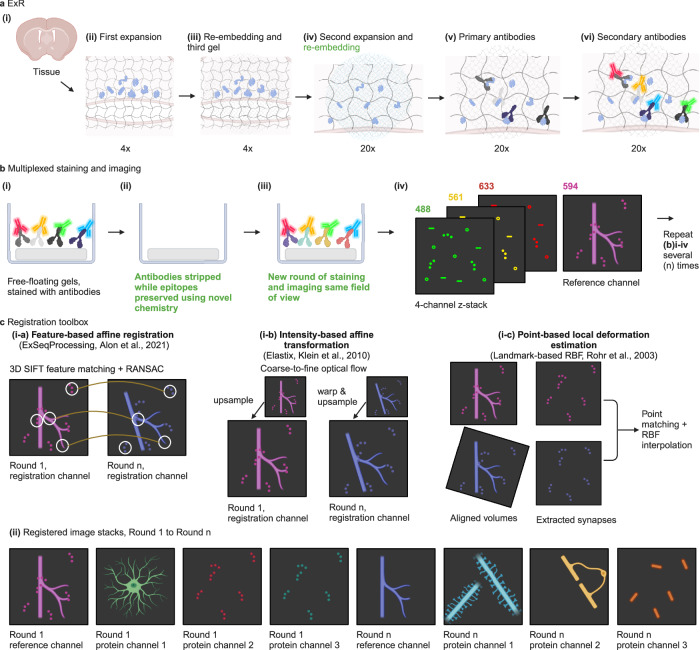
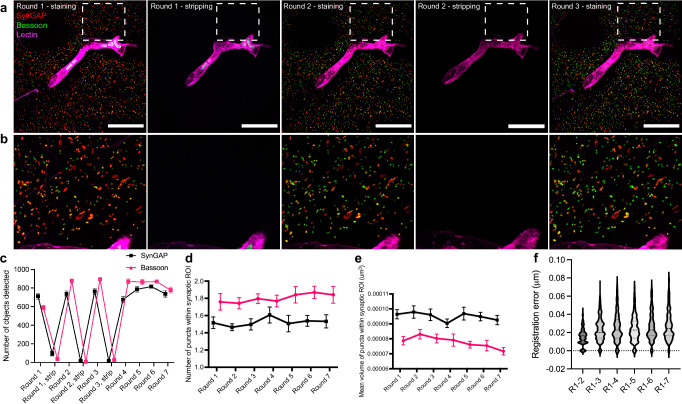
Proteins work together in nanostructures in many physiological contexts and disease states. We recently developed expansion revealing (ExR), which expands proteins away from each other, in order to support better labeling with antibody tags and nanoscale imaging on conventional microscopes. Here, we report multiplexed expansion revealing (multiExR), which enables high-fidelity antibody visualization of >20 proteins in the same specimen, over serial rounds of staining and imaging. Across all datasets examined, multiExR exhibits a median round-to-round registration error of 39 nm, with a median registration error of 25 nm when the most stringent form of the protocol is used. We precisely map 23 proteins in the brain of 5xFAD Alzheimer's model mice, and find reductions in synaptic protein cluster volume, and co-localization of specific AMPA receptor subunits with amyloid-beta nanoclusters. We visualize 20 synaptic proteins in specimens of mouse primary somatosensory cortex. multiExR may be of broad use in analyzing how different kinds of protein are organized amidst normal and pathological processes in biology.


Conflict of interest statement

J.K., M.E.S., and E.S.B. are co-inventors on a patent application for multiExR. The remaining authors declare no competing interests.

Figures

Fig. 1
Fig. 1. Schematic of multiExR procedure.
a Expansion revealing (ExR), a technology for decrowding of proteins through isotropic protein separation. ai Coronal section of mouse brain before staining or expansion. aii Anchoring and first gelation step. The specimen is embedded in a swellable hydrogel (gray wavy lines), mechanically softened via detergent and heat treatment, and expanded in water. aiii Re-embedding and second swellable gel formation. The fully expanded first gel is re-embedded in a charge-neutral gel (not shown), followed by the formation of a second swellable hydrogel (light gray wavy lines). aiv Final up to 20x expansion with the addition of water, followed by a recommended re-embedding step to preserve gel strength for multi-round imaging (blue wavy lines). av, Post-expansion primary antibody staining (Y-shaped proteins). avi Post-expansion staining with fluorescent secondary antibodies to visualize decrowded biomolecules. b Multiplexed ExR procedure. bi Free-floating gels are stained with conventional primary and secondary antibodies, and the images are collected. bii After imaging, primary and secondary antibodies are stripped using detergent and heat-based denaturation while endogenous proteins are preserved by physical anchoring in hydrogel networks. biii Gels are re-incubated with a new round of primary and secondary antibodies, and the same field of view is imaged again. biv A 3 or 4-channel z-stack is obtained on a confocal microscope. One or more of the four channels serves as the reference channel. After imaging, the antibody stripping and staining processes are repeated for up to 10 rounds. c Registration of multi-round images using the reference channel. The multi-round images are registered using one or a combination of the methods (i-a and i-c, or i-b and i-c) in this toolbox (see Supplementary Fig. 1 and “Methods” section for more details). i-a a feature-based affine registration algorithm,. i-b an intensity-based affine registration algorithm iteratively refining the estimation from the coarse scale of the image pairs to the fine scale. i-c, a point-based registration algorithm, designed specifically to further align fine structures. cii Registered multiExR images are obtained after applying calculated warps to all channels from later rounds, creating multi-channel image volumes. Schematic created with BioRender.com. Bolded, green text highlights technical innovations of the multiExR procedure.
Fig. 2
Fig. 2. Validation of multiExR technology by staining, stripping, and re-staining the same set of primary and secondary antibodies across multiple rounds in the mouse somatosensory cortex.
a Example field of view (max intensity projection) of registered validation dataset images in round 1, stripping after round 1, round 2, stripping after round 2, and round 3. Pixel intensities are adjusted to the same minimum and maximum values for staining and stripping rounds. b Zoom in of boxed region of (a). Scale bar, 5 μm in biological units (i.e., real size divided by expansion factor). c Mean number of objects detected in a field of view (see “Methods” section) after 7 staining rounds and the first 3 stripping rounds (n = 7 fields of view from one mouse for staining rounds, where the first 3 stripping rounds were imaged but stripping was performed between all rounds). d Mean number of puncta detected in manually-identified synaptic regions of interest (ROIs) after 7 staining rounds (the same n = 7 fields of view from one mouse, mean is taken over 51-53 ROIs per field of view). e Mean volume of puncta detected in manually-identified synaptic ROIs after 7 staining rounds (the same n = 7 fields of view from one mouse, mean is taken over 51-53 ROIs per field of view). Error bars in ce represent standard error of the mean across the fields of view. f Estimated population distribution (violin plot of density, with a dashed line at the median and dotted lines at the quartiles) of the registration error in a representative field of view (different from panels (a, b), as it was more representative of registration error). The 95% confidence interval for each round pair is [0.01467, 0.01578] for rounds 1–2, [0.02271, 0.02430] for rounds 1–3, [0.02443, 0.02635] for rounds 1–4, [0.02337, 0.02516] for rounds 1–5, [0.02491, 0.02881] for rounds 1–6, and [0.02657, 0.02855] for rounds 1–7 (see “Methods” section, n = 1000 randomly sampled subvolumes from one field of view from one mouse). Source data are provided as a Source Data file.
Fig. 3
Fig. 3. 23-plex nanoscale characterization of amyloid beta pathology and synapse loss in Alzheimer’s model mouse somatosensory cortex.
a, b 6-channel and composite maximum intensity projections of Aβ and synaptic proteins in representative fields of view and zoom-ins (lower panels) from WT (a) and 5xFAD (b), obtained using multiExR. Scale bar, 2 µm (upper panels), (i) and (ii) 500 nm. c Violin plots of the population distribution of registration error for these fields of view. d Total volume in intensity-thresholded regions (see Methods) for D54D2, 12F4, and 6E10 Aβ species in WT and 5xFAD registered fields of view (statistical significance determined using a linear mixed effects model without multiple comparisons correction, n = 17 fields of view from two WT and two 5xFAD animals, error bars are mean ± standard error of the mean. e Total volume of objects detected after intensity thresholding and size filtration in WT and 5xFAD registered fields of view (statistical significance determined using a linear mixed effects model without multiple comparisons correction, the same n = 17 fields of view from two WT and two 5xFAD animals, error bars are mean ± standard error of the mean) for various synaptic proteins (see Supplementary Table 7 for full statistics). WT wild type, 5xFAD 5x familial Alzheimer’s disease model mice. Source data are provided as a Source Data file.
Fig. 4
Fig. 4. Analysis of nanoscale colocalization of synaptic proteins and amyloid-beta in Alzheimer’s model mouse brain.
a Example 5-channel and composite maximum intensity projections of a 5xFAD field of view, cropped to show Aβ nanoclusters. (Scale bar, 1 μm). b Bar plots of total volume of select proteins within Aβ nanocluster ROIs (n = 71 ROIs from 9 fields of view from 2 5xFAD animals; Supplementary Table 8 for full statistics, error bars indicate mean ± standard error of the mean). c Bar plots of the fraction of volume of D54D2 occupied by AMPA receptor (error bars are mean ± standard error of the mean, statistical significance determined by Tukey’s multiple comparisons test following one-way ANOVA, p < 0.0001 for all asterisked comparisons except p = 0.0047 for GluA3 vs. GluA4, n = 44 nanocluster ROIs from 8 fields of view from 2 5xFAD animals; Supplementary Table 9(i) for full statistics). d Scatterplot of GluA2 (yellow circles) and GluA4 (blue triangles) volume vs. D54D2 volume within Aβ nanocluster ROIs. Lines indicate the best-fit lines from simple linear regressions, and the shaded regions indicate the 95% confidence interval on the best-fit line (n = 71 ROIs from 9 fields of view from 2 5xFAD animals; Supplementary Table 9(ii) for full statistics). e Scatter plot of GluA2 volume vs. GluA4 volume within Aβ nanocluster ROIs. Black line indicates the best-fit line from a simple linear regression, and the shaded region indicates the 95% confidence interval on the best-fit line (the same n = 71 ROIs from 9 fields of view from 2 5xFAD animals; Supplementary Table 9(iii) for full statistics). f Maximum intensity projections for selected channels of the ROIs circled in black in the plot in c. Scale bar, 50 nm. ****p < 0.0001, ***p < 0.001 **p < 0.01, ns, not significant. WT, wild type. 5xFAD, 5x familial Alzheimer’s disease model mice. The 5xFAD data are from the same animals and fields of view as Fig. 3. Source data are provided as a Source Data file.
Fig. 5
Fig. 5. 20-plex nanoscale characterization of synapses in the mouse somatosensory cortex.
a Example composite 5-channel maximum intensity projection a field of view showing synaptic proteins in mouse somatosensory cortex obtained using multiExR (from one of two mice from one batch of experiments). Scale bar, 2 μm in biological units. iii Single-channel and composite maximum intensity projections of synaptic proteins in the boxed regions from (a). Line-headed arrows indicate colocalized postsynaptic scaffold proteins; triangle-headed arrows indicate sandwich-like structures between pre- and postsynaptic scaffold proteins; red arrows indicate gephyrin with excitatory synaptic proteins nearby; blue arrows indicate colocalized AMPA receptors with transmembrane AMPA receptor regulatory proteins (Tarp gamma-2, Stargazin)). Scale bar, 500 nm in biological units. iii-iv Single-channel and composite maximum intensity projections of synaptic proteins forming sandwich-like structures from (i)-(ii). Scale bar, 100 nm in biological units.

References

    1. Good, M. C., Zalatan, J. G. & Lim, W. A. Scaffold proteins: Hubs for controlling the flow of cellular information. Science (80-)332, 680–686 (2011). - PMC - PubMed
    1. Chen, F., Tillberg, P. W. & Boyden, E. S. Expansion microscopy. Science (80-)347, 543–548 (2015). - PMC - PubMed
    1. Wassie, A. T., Zhao, Y. & Boyden, E. S. Expansion microscopy: principles and uses in biological research.Nat. Methods16, 33–41 (2018). - PMC - PubMed
    1. Sarkar, D. et al. Revealing nanostructures in brain tissue via protein decrowding by iterative expansion microscopy. Nat. Biomed. Eng.6, 1057–1073 (2022). - PMC - PubMed
    1. Hickey, J. W. et al. Spatial mapping of protein composition and tissue organization: a primer for multiplexed antibody-based imaging. Nat. Methods19, 284–295 (2021). - PMC - PubMed

Publication types

Substances

LinkOut - more resources