. 2024 Nov 9;15(1):9718.
doi: 10.1038/s41467-024-54129-w.

Enhancing anti-EGFRvIII CAR T cell therapy against glioblastoma with a paracrine SIRPγ-derived CD47 blocker

Affiliations

Enhancing anti-EGFRvIII CAR T cell therapy against glioblastoma with a paracrine SIRPγ-derived CD47 blocker

Tomás A Martins et al. Nat Commun. .

Abstract

A significant challenge for chimeric antigen receptor (CAR) T cell therapy against glioblastoma (GBM) is its immunosuppressive microenvironment, which is densely populated by protumoral glioma-associated microglia and macrophages (GAMs). Myeloid immune checkpoint therapy targeting the CD47-signal regulatory protein alpha (SIRPα) axis induces GAM phagocytic function, but CD47 blockade monotherapy is associated with toxicity and low bioavailability in solid tumors. In this work, we engineer a CAR T cell against epidermal growth factor receptor variant III (EGFRvIII), constitutively secreting a signal regulatory protein gamma-related protein (SGRP) with high affinity to CD47. Anti-EGFRvIII-SGRP CAR T cells eradicate orthotopic EGFRvIII-mosaic GBM in vivo, promoting GAM-mediated tumor cell phagocytosis. In a subcutaneous CD19+ lymphoma mouse model, anti-CD19-SGRP CAR T cell therapy is superior to conventional anti-CD19 CAR T. Thus, combination of CAR and SGRP eliminates bystander tumor cells in a manner that could overcome main mechanisms of CAR T cell therapy resistance, including immune suppression and antigen escape.


Conflict of interest statement

The authors declare the following competing interests: G.H. has equity in and is a co-founder of Incephalo Inc. H.L. is a member of the Scientific Advisory Board of GlycoEra and InterVenn and has received research support from Palleon Pharmaceuticals and consulting fees from Alector. Patent disclosure for the work described in this study: Chimeric antigen receptor constructs and uses thereof. International Patent Application No. PCT/EP2024/074131 on 30 August 2024. Assignee: the trustees of the University of Basel. Inventors: G.H., T.A.M. The remaining authors declare no competing interests.

Figures

Fig. 1
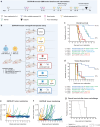
Fig. 1. Anti-EGFRvIII-SGRP CAR T cells constitutively secrete SGRP, enabling CD47-SIRPα axis disruption.
a Mechanism of action of conventional aEGFRvIII CAR T cell monotherapy in GBM. b Proposed aEGFRvIII-SGRP CAR T cell combination therapy whereby SGRP-mediated CD47 blockade induces phagocytic modulation of GAMs in the context of EGFRvIII-heterogenous GBM and its immunosuppressive iTME. c Outline of the SGRP engineering strategy, including specific AA substitutions to the endogenous human SIRPγ-V1 sequence and addition of an N-terminal IL-2 signal sequence (IL2sig) leading to constitutive SGRP secretion. d Polycistronic lentiviral constructs encoding mCherry (mC)-labeled aCD19 CAR or aEGFRvIII CAR under the control of EF1A promoter ± SGRP secretion. e Workflow of CAR T cell production applied throughout the study. ae Created in BioRender. Hutter, G. (2022) BioRender.com/u48r093. Representative plots of CAR:target protein binding by aCD19 CAR T cells (f) or aEGFRvIII CAR T cells (g) to CAR-bound biotinylated (bt)-CD19 (top plots) or bt-EGFRvIII (bottom plots); n = 2 healthy donors (HDs) assessed per CAR. h TATA-box binding protein (TBP)-normalized expression of mCherry and SGRP detected by real-time quantitative PCR (RT-qPCR) in aEGFRvIII CAR or aEGFRvIII-SGRP CAR T cells, showing mCherry expression in CARs transduced with either construct and SGRP expression specifically in aEGFRvIII-SGRP CARs; n = 4 HDs. Data are presented as scatter plots with mean values ± SD. Statistical differences were assessed by two-sided unpaired t tests with Welch’s correction. i Differentially secreted proteins in aEGFRvIII-SGRP CAR- vs aEGFRvIII CAR-conditioned media, highlighting the presence of SGRP exclusively in aEGFRvIII-SGRP CAR; n = 2 HDs. Mean SGRP expression: log10qValue/log2foldchange=8.60/6.65. Source data are provided as a Source Data file. Source data for (i) are provided as Supplementary Data 1.
Fig. 2
Fig. 2. Anti-EGFRvIII-SGRP CAR T cells have comparable in vitro efficacy and on-target activation to conventional anti-EGFRvIII CAR T cells.
a Assessment of CAR T cell on-target killing capacity by co-culture time-lapse of nEGFP+ U251vIII with mCherry+ target-specific (aEGFRvIII CAR ± SGRP) or nonspecific (aCD19 CAR ± SGRP) at a 1:1 E:T ratio for 72 h. b Assessment of CAR T cell off-target killing by co-culture time-lapse of nEGFP+ U251 with mCherry+ CAR T cells at a 1:1 E:T ratio for 72 h. c Dose-dependent CAR T cell killing capacity in a co-culture with U251vIII at defined time points. Dashed lines represent the mean confluence in control wells with only U251vIII cells. ac Curves and dots represent the mean of duplicate measurements. d Representative histograms of CAR T cell degranulation in 24 h co-cultures with U251vIII, BS153, U251, or U87 (gated on live mCherry+ singlets); Conditions were performed in duplicates with n = 2 HDs. e IFNγ release detected by ELISA in supernatants of CAR T cells co-cultured with EGFRvIII+ or EGFRvIII- GBM cell lines. Conditions were performed in triplicates with n = 2 HDs. f Schematic illustration of the experimental setup of an SGRP/aCD47 blocking assay on CD47+ BS153 cells. Created in BioRender. Hutter, G. (2024) BioRender.com/i60q967. g Scatter plots of the MFI of individual wells. Data are presented as mean values ± SD. Conditions were performed in triplicates. Statistical differences were assessed by two-sided unpaired t tests with Welch’s correction. Source data are provided as a Source Data file.
Fig. 3
Fig. 3. I.t. anti-EGFRvIII-SGRP CAR T cell therapy leads to survival benefit and long-term tumor control in an EGFRvIII-heterogenous GBM xenograft model.
a Experimental treatment and monitoring schedule. Animals were treated twice – at 7 and 14 days – after intracerebral (i.c.) tumor implantation using the same stereotactic coordinates and routinely monitored for clinical signs, weekly dual bioluminescence imaging (BLi), and morbidity/survival assessment. Plasma for cytokine analysis was collected on day 15–24 h after the second i.t. treatment. Systemic aCD47 therapy was administered in the relevant treatment groups on days 19, 22, 26, and 29. Animals were euthanized upon reaching the humane endpoint. Upon reaching 90 days of tumor-free survival, aEGFRvIII-SGRP CAR-treated animals (n = 5) were tumor-rechallenged in the ipsilateral hemisphere using the same stereotactic coordinates. b Experimental setup of orthotopic xenograft experiments in NSG mice encompassing co-implanted EGFRvIII+ U251vIII and EGFRvIII- U87 GBM cell lines mimicking tumor heterogeneity and therapeutic/control cohorts including local CAR T cell or antibody monotherapies or combinations (aCD19 CAR n = 8; aCD19-SGRP CAR n = 11; aEGFRvIII-SGRP CAR n = 19; others n = 10). CAR T cell dose: 5 × 105 cells delivered i.t.; Antibody dose: 5 µg delivered i.t. or 100 µg delivered i.p. a, b Created in BioRender. Hutter, G. (2024) BioRender.com/e30g370. c Kaplan–Meier plot of overall survival (in days). d Kaplan–Meier plot of tumor-free survival (in weeks), combining survival assessment with BLi monitoring scores. c, d Two-sided log-rank tests were used to compare treatment/control groups. e, f Tumor progression in EGFRvIII-mosaic xenografts was monitored for each mouse using differential BLi with either FFz or D-luciferin substrates (in weeks). e U251vIII NLuc-reporter BLi curves. f U87 Luc2-reporter BLi curves. cf The data were pooled from three independent experiments. g Kaplan–Meier plot of overall survival of aEGFRvIII-SGRP CAR-cured, tumor-rechallenged animals (in days). A two-sided log-rank test compared the rechallenge group (n = 5) to the historic vehicle control group (vehicle (h.c.); n = 10). Source data are provided as a Source Data file.
Fig. 4
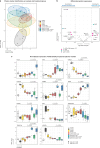
Fig. 4. Local anti-EGFRvIII-SGRP CAR T cell therapy induces a potent peripheral inflammatory mediator response.
a Non-metric multidimensional scaling (NMDS) plot of 92 examined soluble proteins in mouse plasma determined by proximity extension assay. Each data point represents one animal (n = 6 per condition). The ellipses represent the 95% confidence interval of each condition. b Differential expression analysis of aEGFRvIII-SGRP CAR vs aEGFRvIII CAR treatment groups. A two-sided test was used based on the limma-trend method with empirical Bayes moderation applied for variance estimation. Significant differences in protein expression are represented by differently colored data points: adj. P < 0.001, purple; adj. P < 0.05, teal; P < 0.05, pink; P > 0.05 or fold change <0.5, light grey. c Box plots with individual data points showing the normalized protein expression (NPX) of significant innate immune surrogate markers in plasma. Each data point represents one animal (n = 6 per condition). Data points above the assay’s limit of detection (>LOD) are illustrated in black, and those below (<LOD) are displayed in grey. The boxes’ central line represents the median, with the 75th percentile at the upper bound, the 25th percentile at the lower bound, and the whiskers representing all samples lying within 1.5 times the interquartile range. Statistics were calculated for the comparisons of interest using two-sided Mann–Whitney-U tests with Benjamini–Hochberg correction; Only significant statistics are shown. The experiment was repeated with two independent datasets with 16 overlapping biological replicates between the datasets. Source data are provided as Supplementary Data 2.
Fig. 5
Fig. 5. EGFRvIII-specific CAR T cells persist within the tumor, but only anti-EGFRvIII-SGRP CAR T cells eradicate EGFRvIII-mosaic GBM in histological brain sections.
a Brain and spleen collection at an intermediate post-therapeutic time point for multiplex immunofluorescence (IF). Created in BioRender. Hutter, G. (2024) BioRender.com/t61q547. b Histomorphological brain tumor size assessment on day 21 post-tumor implantation. The boxes’ central line represents the median, with the 75th percentile at the upper bound, the 25th percentile at the lower bound, and the whiskers representing all samples from min to max values. All comparisons were non-significant using a two-sided one-way ANOVA with Dunnett’s multiple comparisons. c H&E-stained sections of representative tumor-burdened brains on day 21 post-tumor implantation and seven days after the second treatment. Coronal sections of cerebrum from different treatment groups; Scale bars: 1000 µm. d DAPI-stained (yellow) stitched assemblies of coronal brain sections used for subsequent IF multiplexing with inserts and arrowheads highlighting regions magnified in (e); Scale bars: 1000 µm. bd The data were pooled from two independent experiments (aEGFRvIII CAR + aCD47 n = 5; others n = 6), and stainings were performed individually for each histological slide and staining cycle. e Representative micrographs of multiplexed IF assessments (n = 3 per condition); Left column: Overlays of 7 TME/tumor and proliferation markers; Center column: Overlays of DAPI and EGFRvIII staining; Right column: Overlays of CD206 and IBA1 staining; Scale bars: 50 µm. The data were pooled from two independent experiments, and stainings were performed individually for each histological slide and staining cycle. f Pie charts displaying relative comparisons of the percentage of marker-positive cells per all cells within the whole tumor or in the tumor core across experimental conditions (aCD19 CAR n = 1; aCD47 n = 3; others n = 2). No tumors were detected in any of the aEGFRvIII-SGRP CAR-treated brains analyzed. Source data are provided as a Source Data file and Supplementary Data 3.
Fig. 6
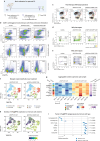
Fig. 6. Anti-EGFRvIII-SGRP CAR treatment leads to increased myeloid cell-mediated GBM phagocytosis.
a Brain tumor collection at an intermediate post-therapeutic time point for spectral FC (n = 5 per condition). Created in BioRender. Hutter, G. (2024) BioRender.com/f07x159. b Representative pseudocolor plots derived from individual mouse brains per condition displaying differential amounts of CD45+ cells (top row), mCherry+ CAR T cells (center row), and mTagBFP2+ tumor cells (bottom row). c Representative contour plots derived from individual mouse brains per condition with the relative amounts of GAM subpopulations. d MG-gated cells from (c) were subclassified into homeostatic MG or activated MG based on MHC-II expression. The color bar insert represents the MFI of the CD11c expression overlay. e MdC-gated cells from (c) were subclassified into transitory monocytes or MDMs based on Ly6C expression. f TSNE plots depicting 8 cell populations after merging and manual annotation of 22 populations generated by unbiased clustering of immune cell lineage marker expression. g Heatmap of aggregated marker expression per sample depicting significant changes between aEGFRvIII CAR and aEGFRvIII-SGRP CAR treatments. Significance cutoffs: false discovery rate = 0.05, log (fold change) = 0.5. h Overlay of mTagBFP2 expression on the TSNEs from (f), per therapeutic condition. i Scatter box plot of median mTagBFP2 tumor reporter expression in immune cell populations. Box plot displays pseudobulk expression levels of mTagBFP2 across conditions and populations. Statistical significance based on differential analysis is annotated with adjusted P values calculated using the diffcyt package with the diffcyt-DS-limma method. The boxes show the min and max values, excluding outliers. The boxes’ central line represents the median, with the 75th percentile at the upper bound, the 25th percentile at the lower bound, and the whiskers representing all samples lying within 1.5 times the interquartile range. Each dot represents one animal (n = 5 injected brain hemispheres per condition).
Fig. 7
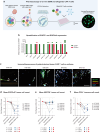
Fig. 7. Pharmacoscopy analysis of GBM:CAR co-cultures reveals low functionality of GBM-associated immune cells in long-term stored patient-derived samples.
a Overview of experimental setup. Frozen SCSs from patient-derived GBM (tumor center) were thawed and plated into 384 well plates at equal numbers. Beforehand, EGFRvIII status was determined on RNA extracts of matching samples. SCSs were co-cultured with aEGFRvIII, aEGFRvIII-SGRP, aCD19, or aCD19-SGRP CAR T cells for 48 h, fixed, stained, and imaged via confocal microscopy. Created in BioRender. Hutter, G. (2024) BioRender.com/p80p582. b Glyceraldehyde-3-phosphate dehydrogenase (GAPDH)-normalized expression of EGFRwt and EGFRvIII detected by RT-qPCR in indicated patient-derived SCSs, showing EGFRvIII positivity in BTB 635, BTB 639, BTB 676, BTB 692 and BTB 739, and no EGFRvIII detection in BTB 691 and BTB 716. GBM cell lines were used as controls for EGFRvIII expression: EGFRvIII- U87 and U251; EGFRvIII+ U251vIII. All GBM cell lines and patient-derived samples were positive for EGFRwt. c Exemplary IF readouts of co-cultures of CAR T cells with SCSs from EGFRvIII+ patient-derived GBM (n = 5) with white arrowheads showing viable NESTIN-stained tumor cells (green); Scale: 100 µm. Multiple micrographs were recorded from five replicate wells for each sample. d Mean EGFRvIII+ tumor cell count displayed as fold change relative to the aCD19 CAR control. e Mean NESTIN+ tumor cell count displayed as fold change relative to the aCD19 CAR control. f Mean CD14+ tumor cell count displayed as fold change relative to the aCD19 CAR control. df Statistics were calculated using a two-sided one-way ANOVA with Dunnett’s multiple comparisons. The experiment was performed once due to the scarcity of human material, particularly EGFRvIII+ GBM samples. Source data are provided as a Source Data file and Supplementary Data 4.
Fig. 8
Fig. 8. Systemic anti-CD19-SGRP CAR T cell therapy delays tumor growth and improves survival in a CD19+ lymphoma xenograft model.
a Experimental setup and timeline of interventions of peripheral CD19+ lymphoma model. Three days after tumor implantation in the right flank, mice were treated with a single i.v. infusion of CAR T cells, followed by 3 times weekly tumor volume assessment and clinical scoring. b Overview of experimental groups/therapeutic conditions and treatment dosages (vehicle n = 9; others n = 10). CAR T cell dose: 8 × 105 cells delivered i.v. a, b Created in BioRender. Hutter, G. (2024) BioRender.com/f99s127. c Kaplan–Meier plot of overall survival (in days). Two-sided log-rank tests were used to compare treatment/control groups. d Tumor volume measurements of individual mice (in days). c, d The data were pooled from two independent experiments. Source data are provided as a Source Data file.
Fig. 9
Fig. 9. Bypassing tumor immune suppression and antigen escape with CAR T cells that secrete a paracrine myeloid cell modulator.
a The EGFRvIII expression pattern in GBM is heterogeneous, the leading cause of antigen escape and failure of conventional EGFRvIII-targeted CAR T cell therapy (Fig. 1a). CD47 is a phagocytosis immune checkpoint typically overexpressed by GBM cells to evade recognition and targeting by phagocytes. The GBM immune response is hampered by infiltrating innate immune cells recruited by the tumor, aiding its progression by releasing trophic factors, cytokines, matrix peptidases, and inflammatory molecules. CCL2: C-C motif chemokine ligand 2; CSF1: colony stimulating factor 1; CSF2: colony stimulating factor 2; CX3CL1: C-X3-C motif chemokine ligand 1; CXCL2: C-X-C motif chemokine ligand 2; CXCL8: C-X-C motif chemokine ligand 8; CXCL12: C-X-C motif chemokine ligand 12; EGF: epidermal growth factor; IL1B: interleukin 1 beta; IL6: interleukin 6; IL10: interleukin 10; MMP9: matrix metallopeptidase 9; MMP14: matrix metallopeptidase 14; PGE2: prostaglandin E2; STIP1: stress induced phosphoprotein 1; TGFB: transforming growth factor beta. b Schematic overview of the proposed mode of action of SGRP-secreting CAR T cells with the primary mechanisms identified in our study. CAR T cell products predominantly consisting of CD4+ T cells eliminate target-positive tumor cells directly via perforin/granzyme and IFNγ. High local IFNγ and CCL3 levels induce host immune cell activation and chemotaxis. Bystander tumor cells are preferentially targeted by IFNγ-dependent remote cytolytic cell death or marked for phagocytosis by SGRP secreted by nearby target-engaged CAR T cells. PRF: perforin; GZM: granzyme. a, b Created in BioRender. Hutter, G. (2024) BioRender.com/l24e295.

References

    1. Cloughesy, T. F., Cavenee, W. K. & Mischel, P. S. Glioblastoma: from molecular pathology to targeted treatment. Annu. Rev. Pathol.9, 1–25 (2014). - PubMed
    1. Ostrom, Q. T. et al. CBTRUS Statistical report: primary brain and other central nervous system tumors diagnosed in the United States in 2012-2016. Neuro. Oncol.21, v1–v100 (2019). - PMC - PubMed
    1. Newick, K., O’Brien, S., Moon, E. & Albelda, S. M. CAR T cell therapy for solid tumors. Annu. Rev. Med.68, 139–152 (2017). - PubMed
    1. June, C. H. & Sadelain, M. Chimeric antigen receptor therapy. N. Engl. J. Med.379, 64–73 (2018). - PMC - PubMed
    1. Hou, A. J., Chen, L. C. & Chen, Y. Y. Navigating CAR-T cells through the solid-tumour microenvironment. Nat. Rev. Drug Discov.20, 531–550 (2021). - PubMed

Publication types

MeSH terms

LinkOut - more resources