. 2024 Nov 9;15(1):9709.
doi: 10.1038/s41467-024-54005-7.

Uncovering functional lncRNAs by scRNA-seq with ELATUS

Affiliations

Uncovering functional lncRNAs by scRNA-seq with ELATUS

Enrique Goñi et al. Nat Commun. .

Erratum in

Abstract

Long non-coding RNAs (lncRNAs) play fundamental roles in cellular processes and pathologies, regulating gene expression at multiple levels. Despite being highly cell type-specific, their study at single-cell (sc) level is challenging due to their less accurate annotation and low expression compared to protein-coding genes. Here, we systematically benchmark different preprocessing methods and develop a computational framework, named ELATUS, based on the combination of the pseudoaligner Kallisto with selective functional filtering. ELATUS enhances the detection of functional lncRNAs from scRNA-seq data, detecting their expression with higher concordance than standard methods with the ATAC-seq profiles in single-cell multiome data. Interestingly, the better results of ELATUS are due to its advanced performance with an inaccurate reference annotation such as that of lncRNAs. We independently confirm the expression patterns of cell type-specific lncRNAs exclusively detected with ELATUS and unveil biologically important lncRNAs, such as AL121895.1, a previously undocumented cis-repressor lncRNA, whose role in breast cancer progression is unnoticed by traditional methodologies. Our results emphasize the necessity for an alternative scRNA-seq workflow tailored to lncRNAs that sheds light on the multifaceted roles of lncRNAs.


Conflict of interest statement

The authors declare no competing interests.

Figures
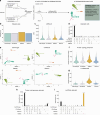
Fig. 1
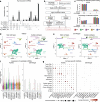
Fig. 1. Preprocessing choices strongly affect lncRNA detection in a scRNA-seq dataset consisting of 10k human PBMCs from a healthy donor.
a Benchmark explanation. Fastq files were preprocessed with the aligner-based Cell Ranger and STARsolo, and the pseudoaligners Kallisto and Salmon. Empty droplets, cells with high mitochondrial content and potential multiplets were filtered, followed by normalization. After dimensionality reduction, clustering and cell type annotation, we compare cell type detection, identification of protein-coding genes and lncRNAs depending on the preprocessing choice. b Mapping rate by each pipeline. c Number of UMIs per cell by each pipeline. d UpSet plot showing the overlap of retained high-quality cells by each pipeline. e UMAP plots displaying the main cell types identified across pipelines. f Number of detected protein-coding genes per cell across pipelines. g Number of detected lncRNAs per cell across pipelines. h UpSet plot displaying the overlap of highly-expressed protein-coding genes, (i) lncRNAs per pipeline. Only considering genes with more than 250 counts and present in more than 25 cells.
Fig. 2
Fig. 2. scATAC-seq multiome indicates an optimized preprocessing alternative for lncRNA quantification.
a Number of UMI counts per cell obtained when preprocessing the scRNA-seq with Cell Ranger and Kallisto. b Weighted nearest neighbors UMAP plot displaying the populations of cell types identified by Cell Ranger and Kallisto. c Methodology used for comparing the similarity between the scRNA-seq, processed with Cell Ranger or Kallisto, and the Gene Activity matrix obtained from the scATAC-seq data. Specifically, for each nucleus, we count the number of simultaneously expressed genes in the scRNA-seq (with higher expression than a threshold), both with Cell Ranger and Kallisto, and in the Gene Activity matrix (with higher signal than a threshold). d Boxplot displaying, for each nucleus (n = 2538), the number of simultaneously activated genes when the scRNA-seq is processed with Cell Ranger and Kallisto. Two-tailed student t-test for assessing differential expression. ns represents p-value > 0.1, * represents p-value ≤ 0.1, ** represents p-value ≤ 0.05, *** represents p-value ≤ 0.005 and **** represents p-value ≤ 0.0005. Boxplots represent 25 to 75 percentiles, whiskers are 1.5 x interquantile range (interquantile range = percentile75–percentile25) e Ratio of the number of nuclei for which there is more genes simultaneously activated with Kallisto divided by the number of nuclei for which there is more genes simultaneously activated with Cell Ranger. For each nucleus we have considered the expression of all genes (white), only protein-coding genes (gray) and only lncRNAs (yellow). In (d) and (e), the x-axis represents the different thresholds used for quantifying only a gene as simultaneously activated if it had: (t > 0) at least 1 UMI in RNA-seq and 1 read in ATAC-seq and, (t > 2) at least 3 UMIs in RNA-seq and 3 reads in ATAC-seq, (t > 5) at least 6 UMIs in RNA-seq and 6 reads in ATAC-seq, (t > 10/5) at least 11 UMIs in RNA-seq and 6 reads in ATAC-seq and (t > 10) at least 11 UMIs in RNA-seq and 11 reads in ATAC-seq. f ATAC-seq signal and RNA-seq expression, with both Cell Ranger and Kallisto, of protein-coding gene CYP2F1 (left) and lncRNA AC243960.3 (right).
Fig. 3
Fig. 3. Exclusive and commonly identified lncRNAs share similar characteristics.
a Normalized expression differences, b Length differences and c Differences in the number of proximal exons ( < 15 kb from the 3’ UTR) of (left) exclusive vs. common lncRNAs (right) exclusive vs. common protein-coding genes. In (a) and (b) only genes with more than 250 counts and present in more than 25 cells were considered and significance was assessed with a two-tailed Wilcoxon test. In (c) only genes with more than (up) 250 (down) 100 counts and present in more than (up) 25 (down) 10 cells were considered and significance was assessed with a one-tailed Wilcoxon test, testing if exclusive genes have more proximal exons. In (a), (b) and (c) common and exclusive lncRNAs and common and exclusive protein-coding genes have the following ‘n’ for each datasets; Hg_PBMCs_10k: 591, 1774, 9273 and 1653; Hg_PBMCs_5k: 424, 1112, 8479 and 1577; Hg_intestine_1: 261, 401, 8058 and 1368; Hg_intestine_2: 23, 11, 1744 and 376; Hg_pulm_fibrosis: 94, 38, 5543 and 712; Hg_lung_1: 404, 966, 9705 and 911; Hg_lung_2: 80, 50, 5365 and 1004; Mm_PBMCs_10k: 256, 372, 8937 and 844 and Mm_brain_1k: 93, 78, 6293 and 564. d Ratio of the percentage of the sequence covered by repeats of exclusive to common (left) lncRNAs (right) protein-coding genes. A jitter on the y-axis was included for ease of visualization. Thresholds for removing lowly-expressed genes; more than i) 25, ii) 50, iii) 100 and iv) 250 counts and present in more than i) 3, ii) 5, iii) 10 and iv) 25 cells. e SI differences to test if the SI of exclusive lncRNAs is significantly higher (one-tailed Wilcoxon test), than the SI of protein-coding genes. SI distributions were calculated across distinct sizes of clusters (5-9, 10-15, 16-22 and > 22 clusters. Only genes with more than 250 counts and present in more than 25 cells were considered. In (a), (b), (c) and (e) ns represents p-value > 0.1, * represents p-value ≤ 0.1, ** represents p-value ≤ 0.05, *** represents p-value ≤ 0.005 and **** represents p-value ≤ 0.0005 and boxplots represent 25 to 75 percentiles, whiskers are 1.5x interquantile range (interquantile range = percentile75 – percentile 25).
Fig. 4
Fig. 4. Inaccurate annotation of lncRNAs causes detection differences.
a Percentage of k-mers that overlapped with k-mers of intronic regions with different k-mers lengths. K-mers were generated from the transcript sequences of common and exclusive genes. b (left) UpSet plot displaying, for highly-expressed lncRNAs the percentage of them that are detected by Kallisto and Cell Ranger when testing different annotation schemes and (right) ratio of the number of highly-expressed lncRNAs that are exclusively detected by Kallisto divided by the number of highly-expressed lncRNAs that are commonly detected by Cell Ranger and Kallisto. Fold GENCODE hg19. c (left) UpSet plot displaying, for highly-expressed protein-coding genes the percentage of them that are detected by Kallisto and Cell Ranger when testing different annotation schemes and (right) ratio of the number of highly-expressed protein-coding genes that are exclusively detected by Kallisto divided by the number of highly-expressed protein-coding genes that are commonly detected by Cell Ranger and Kallisto when testing different annotation schemes. Fold GENCODE hg19. Highly-expressed genes defined as those with more than 250 counts and present in more than 25 cells. Results in (a), (b) and (c) where generated using the scRNA-seq dataset consisting of 10k human PBMCs from a healthy donor. d (left) Quantification error between the ground truth matrix with the simulated lncRNA expression and the lncRNAs preprocessing count matrices of Cell Ranger and Kallisto in n = 10 simulations. Quantification performed using the Frobenious norm to measure distance between matrices. Quantification errors are normalized to Cell Ranger quantification error (right) Percentage of highly-expressed lncRNAs detected by Cell Ranger and Kallisto in each of the n = 10 simulations from the 1500 lncRNAs whose expression is simulated. Highly-expressed genes defined as those with more than 500 counts. Boxplots represent 25 to 75 percentiles, whiskers are 1.5 x interquantile range (interquantile range = percentile75–percentile 25). Statistical significance was assessed with a two-tailed student t-test, ns represents p-value > 0.1, * represents p-value ≤ 0.1, ** represents p-value ≤ 0.05, *** represents p-value ≤ 0.005 and **** represents p-value ≤ 0.0005.
Fig. 5
Fig. 5. Biologically relevant lncRNAs are uncovered by ELATUS.
a UpSet plot displaying the overlap of lncRNAs exclusively found by Kallisto in the human scRNA-seq datasets analyzed. b ELATUS workflow to uncover biologically important lncRNAs. ELATUS starts importing the raw count matrices obtained with both Cell Ranger and Kallisto. Next, there is a quality control step to distinguish empty droplets from cells, filtering potential multiplets and cells with high mitochondrial content, followed by a normalization and clustering steps. Then, highly-expressed lncRNAs, both commonly detected by Cell Ranger and Kallisto and exclusively detected by Kallisto were selected. All the commonly detected lncRNAs were retained and from the exclusive lncRNAs, ELATUS retained those lncRNAs for which Cell Ranger assigned less than 10 counts, that were 40 times more expressed according to Kallisto than to Cell Ranger and that, according to Kallisto, had a SI > 0.15. ELATUS also retained the exclusive lncRNAs whose functionality has been independently validated by external studies. c UpSet plot displaying, as a percentage, the overlap of: left) protein-coding genes, and right) lncRNAs detected by Kallisto and Cell Ranger in each sample. Only genes with more than 250 counts in more than 25 cells were considered in both panels. d UMAP plots displaying the different TNBC cell population of: left) main cell types, and right) cell subtypes identified when preprocessing with Kallisto. e UMAP plots displaying the different TNBC cell population of: left) main cell types, and right) cell subtypes identified when preprocessing with Cell Ranger. f Violin plot showing the expression of some lncRNAs when preprocessing with Kallisto and Cell Ranger. g DotPlots showing, with Kallisto and Cell Ranger, the averaged normalized expression in each cellular subtype of these lncRNAs.
Fig. 6
Fig. 6. ELATUS-identified AL121895.1 is a cis-repressor that participates in triple negative breast cancer progression.
a Genomic locus of left) WT1-AS and right) AL121895.1. In blue and red are represented the isoform of WT1-AS and AL121895.1, respectively, that contain most scRNA-seq reads assigned by Kallisto. b RT-qPCR normalized RNA levels (mean + SD) of AL121895.1 and WT1-AS in MDA and KMS12 cell lines. AL121895.1 and WT1-AS expression has been normalized with respect to MDA and KMS12, respectively. N = 4 technical replicates. c RT-qPCR normalized RNA levels (mean + SD) showing the expression of AL121895.1 on MDA cells after treating them with (left) scramble (siSCR) or knocked down with the siRNA1 (si1), siRNA2 (si2) and the combination of both siRNAs (si1 & si2) (right) ASO control, or knocking them out with ASO 1 and ASO 2. N = 4 technical replicates d MTS proliferation assay (mean + SD) of MDA cells measured during three days treating them with scramble (siSCR) or knocked down with the siRNA1 (si1), siRNA2 (si2) and the combination of both siRNAs (si1 & si2). N = 3 technical replicates e RT-qPCR normalized RNA levels (mean + SD) showing the expression of EPB41L1 when treating them with (left) scramble (siSCR) or knocked down with the siRNA1 (si1), siRNA2 (si2) and the combination of both siRNAs (si1 & si2) (right) ASO control, or knocking them out with ASO 1 and ASO 2. N = 4 technical replicates. In (b), (c), (d) and (e) statistical significance was assessed with a two-tailed student t-test, ns represents p-value > 0.1, * represents p-value ≤ 0.1, ** represents p-value ≤ 0.05, *** represents p-value ≤ 0.005 and **** represents p-value ≤ 0.0005. f Correlation plot of the normalized expression of AL121895.1 and EPB41L1 in each cellular subtype of the TNBC samples preprocessed with Kallisto. g Functional classification by SEEKR using K-means clustering to find communities according to k-mer content of AL121895.1 together with described lncRNAs cis-activators and lncRNAs cis-repressors.

References

    1. Rahman, R. U. et al. Singletrome: a method to analyze and enhance the transcriptome with long noncoding RNAs for single cell analysis. 10.1101/2022.10.31.514182.
    1. Luo, H. et al. Single-cell long non-coding RNA landscape of T cells in human cancer immunity. Genomics Proteom. Bioinforma.19, 377–393 (2021). - PMC - PubMed
    1. Zheng, L. L. et al. ColorCells: a database of expression, classification and functions of lncRNAs in single cells. Brief. Bioinform22, 1–11 (2021). - PubMed
    1. Santus, L. et al. Single-cell profiling of lncRNA expression during Ebola virus infection in rhesus macaques. Nat. Commun. 2023 14:114, 1–14 (2023). - PMC - PubMed
    1. Statello, L., Guo, C.-J., Chen, L.-L. & Huarte, M. Gene regulation by long non-coding RNAs and its biological functions. Nat. Rev. Mol. Cell Biol.22, 96–118 (2021). - PMC - PubMed

Publication types

MeSH terms

Substances