. 2024 Nov 9;15(1):9720.
doi: 10.1038/s41467-024-54155-8.

α-tubulin detyrosination fine-tunes kinetochore-microtubule attachments

Affiliations

α-tubulin detyrosination fine-tunes kinetochore-microtubule attachments

Hugo Girão et al. Nat Commun. .

Abstract

Post-translational cycles of α-tubulin detyrosination and tyrosination generate microtubule diversity, the cellular functions of which remain largely unknown. Here we show that α-tubulin detyrosination regulates kinetochore-microtubule attachments to ensure normal chromosome oscillations and timely anaphase onset during mitosis. Remarkably, detyrosinated α-tubulin levels near kinetochore microtubule plus-ends depend on the direction of chromosome motion during metaphase. Proteomic analyses unveil that the KNL-1/MIS12/NDC80 (KMN) network that forms the core microtubule-binding site at kinetochores and the microtubule-rescue protein CLASP2 are enriched on tyrosinated and detyrosinated microtubules during mitosis, respectively. α-tubulin detyrosination enhances CLASP2 binding and NDC80 complex diffusion along the microtubule lattice in vitro. Rescue experiments overexpressing NDC80, including variants with slower microtubule diffusion, suggest a functional interplay with α-tubulin detyrosination for the establishment of a labile kinetochore-microtubule interface. These results offer a mechanistic explanation for how different detyrosinated α-tubulin levels near kinetochore microtubule plus-ends fine-tune load-bearing attachments to both growing and shrinking microtubules.


Conflict of interest statement

The authors declare no competing interests.

Figures

Fig. 1
Fig. 1. Genetic manipulation and super-resolution microscopy analysis of α-tubulin detyrosination/tyrosination in human cells.
a Establishment of U2OS cell lines knockout (KO) for TTL or VASH1/2 by CRISPR-Cas9 gene editing. Histone H2B-mRFP and detyrosinated or tyrosinated GFP-α-tubulin were optionally transduced for imaging purposes. b Expression levels (relative quantifications, reference = 1.00) of detyrosinated and tyrosinated tubulin in the KO lines analyzed by western blotting (values refer to relative levels obtained from the illustrated western blot, which was qualitatively validated by at least 2 independent experiments). GAPDH and endogenous α-tubulin were used as loading controls (c) Representative super-resolution CH-STED microscopy images of metaphase U2OS cells generated in (a), after immunofluorescence with anti-detyrosinated α-tubulin (green), total α-tubulin (magenta) and anti-centromere antibody (ACA; cyan). Scale bar is 5 μm. Source data are provided as a Source Data file.
Fig. 2
Fig. 2. α-tubulin detyrosination is required for timely mitotic progression and SAC satisfaction.
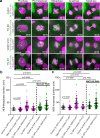
a Live-cell imaging of chromosome and microtubule behavior showing delayed chromosome alignment and anaphase onset in the VASH1/2 knockout (KO) with/without MATCAP RNAi; time is in h:min from nuclear envelope breakdown (NEB); scale bar is 5 µm. b Quantification of NEB-metaphase duration during live cell imaging; Control Tyrosinated (Tyr) GFP-α-tubulin = 57 cells, pool of 16 independent experiments, TTL KO Detyrosinated (Detyr) GFP-α-tubulin = 67 cells, pool of 18 independent experiments, VASH1/2 KO Tyr GFP-α-tubulin = 72 cells, pool of 20 independent experiments, TTL KO Tyr GFP-α-tubulin = 59 cells, pool of 12 independent experiments, Control Tyr GFP-α-tubulin + MATCAP RNAi = 68 cells, pool of 16 independent experiments, VASH1/2 KO Tyr GFP-α-tubulin + MATCAP RNAi = 102 cells, pool of 25 independent experiments; each data point represents an individual cell; bars represent mean and standard deviation; exact p-values are displayed above each respective data set; significance p < 0.05, unpaired two-tailed t-test. c Quantification of NEB-Anaphase onset duration from the same data set as in (b); each data point represents an individual cell; bars represent mean and standard deviation. Source data are provided as a Source Data file.
Fig. 3
Fig. 3. Detyrosinated α-tubulin accumulates on shrinking kinetochore microtubules.
a Immunofluorescence analysis of a 3D projection from a U2OS Parental cell using anti-tyrosinated (tyr) α-tubulin (white), anti-centromere antibody (ACA; magenta), anti-detyrosinated (detyr) α-tubulin antibodies (blue) and anti-EB1 (green); Grayscale panels show single channels for tyrosinated α-tubulin and detyrosinated α-tubulin (max intensity projection vs. sum projection). Scale bars 5 µm. a’ Single section from the same cell in (a); individual signals for each channel are also displayed in insets. b Line scan profile of the fluorescence intensities (F.I.) from the highlighted region from the inset in (a’). c Representation of the model of the distribution of tyrosinated and detyrosinated α-tubulin near oscillating kinetochores (kMTs = kinetochore microtubules). AP = anti-poleward, P = Poleward. d Quantification of the ratio between detyrosinated α-tubulin fluorescence intensity and tyrosinated α-tubulin fluorescence intensity of the growing (EB1 + ) kMTs and shrinking (EB1-) kMTs near oscillating kinetochores in the parental cell line; error bars represent mean and standard deviation; each point represents a kinetochore; quantifications from a pool of 3 independent experiments; at least 1 kinetochore pair per cell was measured (total kinetochore pairs = 95) from a total of 50 cells; exact p-values are displayed above each respective data set; significance p < 0.05, unpaired two-tailed t-test. e Quantification of the ratio of the detyrosinated α-tubulin normalized fluorescence intensity between the growing (EB1 + ) and shrinking (EB1-) kMTs from the same kinetochore pair, in the same data set as in (d). Source data are provided as a Source Data file.
Fig. 4
Fig. 4. α-tubulin detyrosination is required for the establishment of functional kinetochore-microtubule attachments governing metaphase chromosome oscillations.
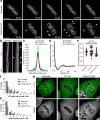
a Live-cell imaging of MG132-treated (<1 h) GFP-CENP-A-expressing Parental and VASH1/2 knockout (KO) cell lines. Arrowheads indicate movement of kinetochore (KT) pairs off the metaphase plate. Time is in min:sec; scale bar is 5 µm. b Chromokymographs obtained from live-cell imaging of MG132-arrested GFP-CENP-A-expressing Parental and VASH1/2 KO cell lines. Arrowheads indicate movement of KT pairs off the metaphase and recovery events. c Frame-to-frame displacement of sister-KTs and their distance from the metaphase plate center for the control condition (Parental; black), VASH1/2 KO (green) and TTL KO (magenta); quantifications from: Parental = 59 cells, 7 independent experiments, TTL KO = 65 cells, 7 independent experiments; VASH1/2 KO = 47 cells, 5 independent experiments. d Cumulative autocorrelation curves representing sister-KT oscillations in control (black), VASH1/2 KO (green) and TTL KO (magenta). The vertical axis represents the regularity of the oscillations and the horizontal axis represents the time (quantifications from the same data set of (c)). e Sister-KT velocity in control (gray), VASH 1/2 KO (green) and TTL KO (magenta). The velocity was quantified as the mean of all sister-KT pairs per cell, multiplied by the number of frames within 1 min (quantifications from the same data set of (c)). Exact p-values are displayed above each respective data set; significance p < 0.05, Dunn’s multiple comparison test. f Quantification of the percentage of cells with KTs out of the metaphase plate from the same data set of (c). g Immunofluorescence of U2OS Parental, TTL KO and VASH1/2 KO cell lines using anti-MAD1 (green) and anti-centromere antibodies (ACA; magenta) antibodies; scale bar is 5 µm. h Quantification of the percentage of cells with MAD1 positive KTs per cell from a pool of 3 independent experiments: Parental = 95 cells, TTL KO = 111 cells, VASH1/2 KO = 92 cells. Source data are provided as a Source Data file.
Fig. 5
Fig. 5. The KMN network and CLASP2 are enriched on tyrosinated and detyrosinated mitotic microtubules, respectively.
a Western blot analysis of the expression levels (relative quantification, reference = 1.00) of detyrosinated (detyr) and tyrosinated (tyr) α-tubulin in the knockout (KO) U2OS cell lines used in the mass-spec analysis (values refer to relative levels obtained from the illustrated western blot, which was qualitatively validated by at least 2 independent experiments). α-tubulin and GAPDH were used as loading controls. b Schematic representation of the protocol for isolation of microtubules (MTs) and microtubule-associated proteins (MAPs) from mitotic extracts derived from U2OS TTL KO and VASH1/2 KO cell lines. STLC =  S-trityl-L-cysteine; S = Supernatant; P = Pellet. c Wide-field fluorescence microcopy images of polymerized microtubules (stained with SiR-tubulin) obtained from the P3 fraction (see scheme in (b)) from the TTL KO and VASH1/2 KO cell lines; scale bar is 5 µm. d Western blot analysis of detyrosinated and tyrosinated α-tubulin in the P3 fractions from 3 independent experiments per condition. Total α- and β-tubulin were used as reference controls. e Summary of the most relevant mitotic hits obtained from mass-spec analysis of the isolated S3 fractions from the same 3 independent experiments as in (d), comparing abundance (Ab) ratios between VASH1/2 KO and TTL KO cell lines.
Fig. 6
Fig. 6. CLASP2 binds preferentially to detyrosinated microtubules in vitro.
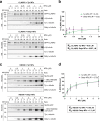
ac Microtubule (MT) co-pelleting assay using purified GFP-CLASP2 (a) or NDC80 “broccoli”-GFP (c) and tyrosinated (tyr) or detyrosinated (detyr) microtubules. P = pellet; S = supernatant. The ratios of GFP-CLASP2 and NDC80 “broccoli”-GFP between the pellet and supernatant fractions were quantified on the BlueSafe gel. Expression levels of detyrosinated and tyrosinated α-tubulin were confirmed by western blot (WB) analysis. MW Molecular weight. bd Quantifications of GFP-CLASP2 (b) or NDC80 “broccoli”-GFP (d) in the pellet fractions. Bound fraction (%) to microtubules were plotted after baseline subtraction (no microtubules). Estimated KD (equilibrium dissociation constant) was obtained after fitting the data to a non-linear regression (2 independent experiments with 2 replicates each). Error bars indicate standard deviation of the mean. Source data are provided as a Source Data file.
Fig. 7
Fig. 7. α-tubulin detyrosination promotes NDC80 diffusion along the microtubule lattice.
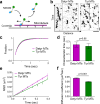
a Schematic of the single molecule experimental setup to visualize diffusion of NDC80 “broccoli”-GFP along coverslip-immobilized microtubules (MTs). b Representative kymographs for diffusing NDC80 “broccoli”-GFP molecules on detyrosinated (detyr) and tyrosinated (tyr) MTs. Scale bars are 0.5 sec and 2 μm. c Cumulative distribution of the residence time for NDC80 “broccoli”-GFP from experiments using either detyrosinated (magenta, n = 1138 molecules) or tyrosinated microtubules (green, n = 693). Lines are exponential fits. d Column graph shows characteristic residence times (indicated by the bar height, which corresponds also to the center of the error bars) derived from exponential fit in panel (c) with error bars showing standard error of the mean (SEM), and p value determined from two-tailed t-test, see Materials and Methods section “Analysis of NDC80 diffusion”. e Mean square displacement (MSD) with standard deviations for NDC80 “broccoli”-GFP molecules diffusing on detyrosinated (n = 2278 molecules) and tyrosinated (n = 1442) microtubules. f Column graph shows diffusion coefficients (indicated by the bar height, which corresponds also to the center of the error bars) derived from the MSD graph in panel (e) with error bars showing SEM for the molecules with longest diffusion time (n = 481) for detyrosinated and n = 281 for tyrosinated microtubules, and p value determined from two-tailed t-test. p-values are displayed above each respective data set; significance p < 0.05. Source data are provided as a Source Data file.
Fig. 8
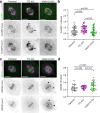
Fig. 8. NDC80 and CLASP2 preferentially associate with tyrosinated or detyrosinated spindle microtubules, respectively.
a Immunofluorescence analysis of the U2OS Parental, TTL KO and VASH1/2 KO cell lines using anti-NDC80 (green) and anti-β-tubulin (magenta) antibodies; NDC80 signal is presented in grayscale for better visualization (max = max intensity projection vs. sum = sum projection); scale bar is 5 µm (b). Quantification of the NDC80 fluorescence intensity normalized for the β-tubulin fluorescence intensity for each cell line (NDC80/β-tubulin); error bars represent mean and standard deviation; quantifications from a pool of 3 independent experiments: Parental = 30 cells, TTL KO = 30 cells, VASH1/2 KO = 30 cells; Exact p-values are displayed above each respective data set; significance p < 0.05, unpaired two-tailed t-test. c Immunofluorescence analysis of the U2OS Parental, TTL KO and VASH1/2 KO cell lines using anti-CLASP2 (green) and anti-α-tubulin (magenta) antibodies; CLASP2 signal is presented in grayscale for better visualization (max = max intensity projection vs. sum = sum projection); scale bar is 5 µm. (d) Quantification of the CLASP2 fluorescence intensity normalized for the α-tubulin fluorescence intensity for each cell line (CLASP2/α-tubulin); error bars represent mean and standard deviation; quantifications from a pool of 3 independent experiments: Parental = 51 cells, TTL KO = 47 cells, VASH1/2 KO = 38 cells; Exact p-values are displayed above each respective data set; significance p < 0.05, unpaired two-tailed t-test. Arrowheads in (a) and (c) draw attention to the spindle pool. Source data are provided as a Source Data file.
Fig. 9
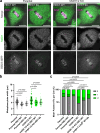
Fig. 9. A functional interplay between NDC80 and α-tubulin detyrosination regulates kinetochore-microtubule attachments during metaphase.
a Immunofluorescence of the U2OS Parental cell line and VASH1/2 KO cell line overexpressing GFP-HEC1 wild-type (WT) and phosphorylation mutants (9 A), using anti-MAD1 (green) and anti-centromere antibodies (ACA; magenta) antibodies; GFP-HEC1 is in white; scale bar is 5 μm. b Quantification of the metaphase plate width (ACA signal) from parental and VASH1/2 KO cell lines, with/without overexpression of GFP-HEC1 WT and 9 A mutant in both cell lines; each data point represents an individual cell; bars represent mean and standard deviation; 3 independent experiments, Parental = 95 cells; Parental+Hec1 WT = 52 cells; Parental+Hec1 9 A = 52 cells; VASH1/2 KO = 92 cells; VASH1/2 KO+Hec1 WT = 53 cells; VASH1/2 KO+Hec1 9 A = 60 cells; exact p-values are displayed above each respective data set; significance p < 0.05, unpaired two-tailed t-test. c Comparative analysis of the percentage of cells with one or more MAD1 positive kinetochores (KTs) per cell from the same pool of (b); exact p-values are displayed above each respective data set; significance p < 0.05, non-parametric Mann-Whitney two-tailed test. Source data are provided as a Source Data file.
Fig. 10
Fig. 10. Possible mechanism for the regulation of kinetochore mobility by microtubule detyrosination/tyrosination during metaphase chromosome oscillations.
The NDC80 complex has a preference for ‘younger’ tyrosinated α-tubulin. Black arrows show direction of chromosome motion. As the initial end-on microtubule (MT) contacts become stabilized, gradual α-tubulin detyrosination would lead to a different makeup of the kinetochore (KT)-bound MT ends, depending on the direction of motion. NDC80 complex diffusion along the ‘older’ MT lattice towards the pole is facilitated, whereas stronger binding to “younger” polymerizing end help preventing MT detachment from the trailing KT. CLASP2 might prevent MT detachments under higher friction with detyrosinated microtubules at KTs.

Similar articles

Cited by

References

    1. Janke, C. & Magiera, M. M. The tubulin code and its role in controlling microtubule properties and functions. Nat. Rev.21, 307–326 (2020). - PubMed
    1. McKenna, E. D., Sarbanes, S. L., Cummings, S. W. & Roll-Mecak, A. The tubulin code, from molecules to health and disease. Annu Rev. Cell Dev. Biol.39, 331–361 (2023). - PubMed
    1. Verhey, K. J. & Gaertig, J. The tubulin code. Cell Cycle6, 2152–2160 (2007). - PubMed
    1. Nieuwenhuis, J. et al. Vasohibins encode tubulin detyrosinating activity. Science 358, 1453–1456 (2017). - PubMed
    1. Aillaud, C. et al. Vasohibins/SVBP are tubulin carboxypeptidases (TCPs) that regulate neuron differentiation. Science 358, 1448–1453 (2017). - PubMed

Publication types

LinkOut - more resources