Clinical Trial
. 2025 Jan;31(1):176-188.
doi: 10.1038/s41591-024-03324-9. Epub 2024 Nov 9.

Oncolytic immunotherapy with nivolumab in muscle-invasive bladder cancer: a phase 1b trial

Affiliations
Clinical Trial

Oncolytic immunotherapy with nivolumab in muscle-invasive bladder cancer: a phase 1b trial

Roger Li et al. Nat Med. 2025 Jan.

Abstract

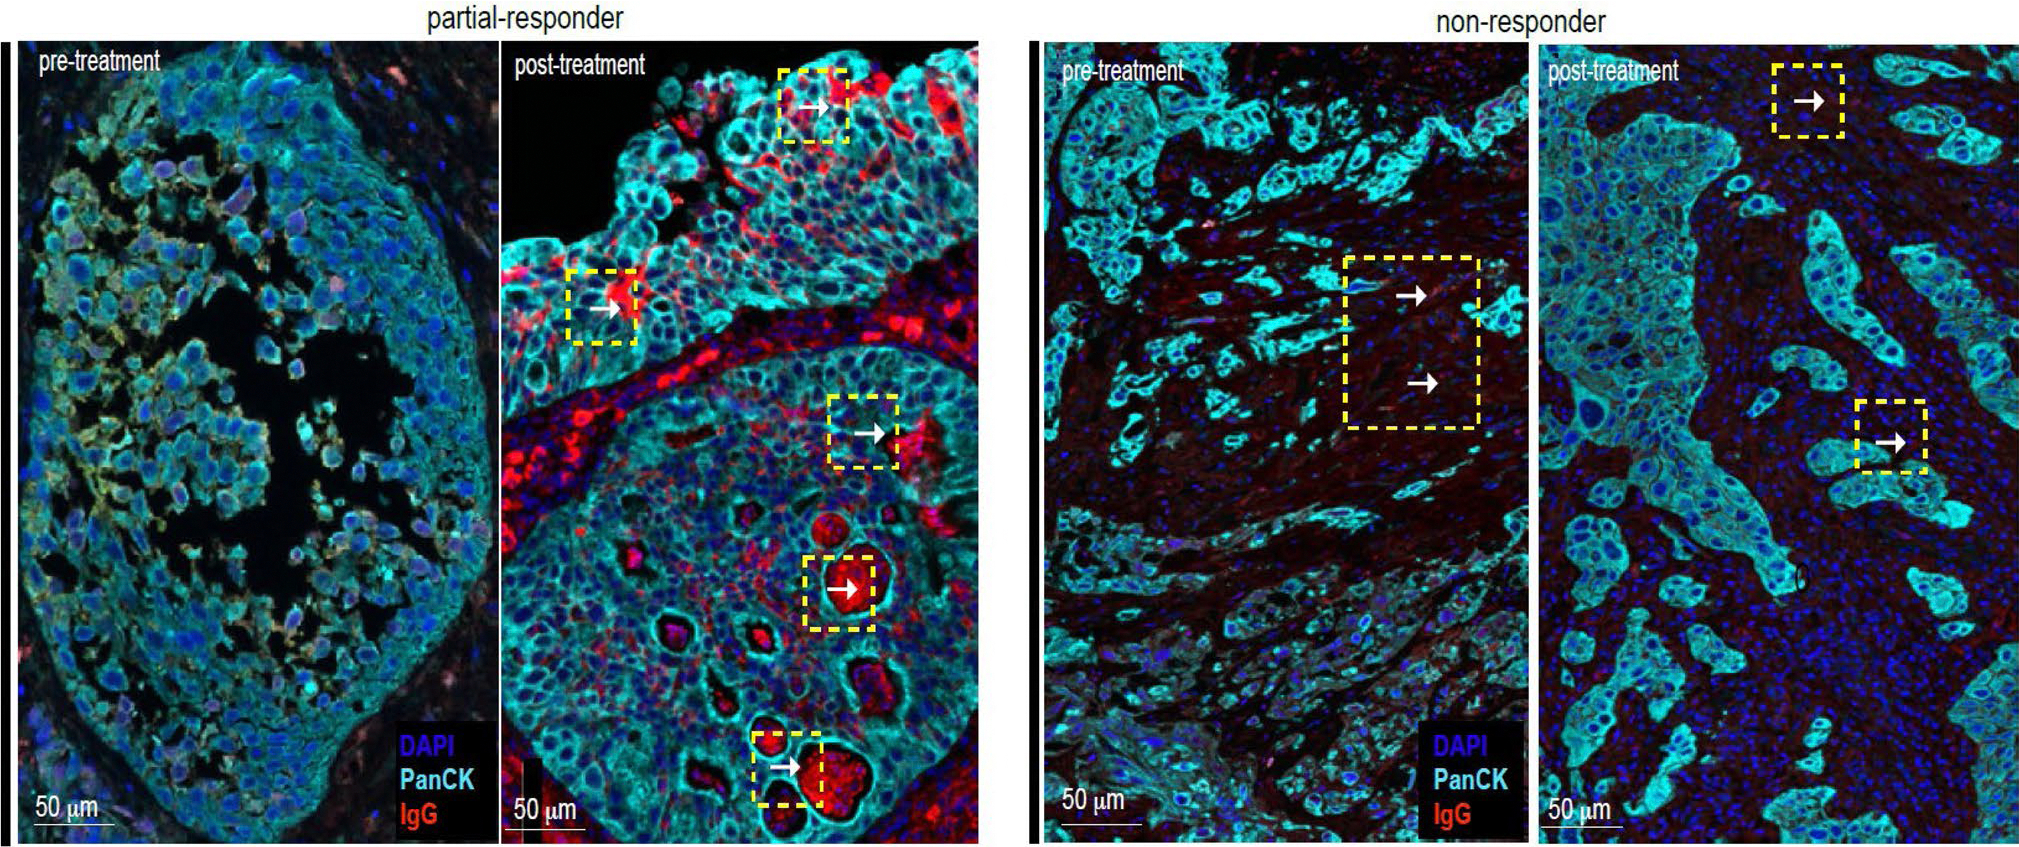
There is a critical unmet need for safe and efficacious neoadjuvant treatment for cisplatin-ineligible patients with muscle-invasive bladder cancer. Here we launched a phase 1b study using the combination of intravesical cretostimogene grenadenorepvec (oncolytic serotype 5 adenovirus encoding granulocyte-macrophage colony-stimulating factor) with systemic nivolumab in cisplatin-ineligible patients with cT2-4aN0-1M0 muscle-invasive bladder cancer. The primary objective was to measure safety, and the secondary objective was to assess the anti-tumor efficacy as measured by pathologic complete response along with 1-year recurrence-free survival. No dose-limiting toxicity was encountered in 21 patients enrolled and treated. Combination treatment achieved a pathologic complete response rate of 42.1% and a 1-year recurrence-free survival rate of 70.4%. Pathologic response was associated with baseline free E2F activity and tumor mutational burden but not PD-L1 status. Although T cell infiltration was broadly induced after intravesical oncolytic immunotherapy, the formation, enlargement and maturation of tertiary lymphoid structures was specifically associated with complete response, supporting the importance of coordinated humoral and cellular immune responses. Together, these results highlight the potential of this combination regimen to enhance therapeutic efficacy in cisplatin-ineligible patients with muscle-invasive bladder cancer, warranting additional study as a neoadjuvant therapeutic option. ClinicalTrials.gov identifier: NCT04610671 .


Conflict of interest statement

Competing interests: R.L. reports research support from Predicine, Veracyte, CG Oncology, Valar Labs, Merck and Janssen; clinical trial protocol committee participation with CG Oncology, Merck and Janssen; and is scientific advisor/consultant for Bristol Myers Quibb, Merck, Fergene, Arquer Diagnostics, Urogen Pharma, Lucence, CG Oncology, Janssen, Thericon, Iconovir, ImmunityBio and Pfizer. W.J.S. reports consultant work for Pacific Edge and Urogen Pharma. P.E.S. reports being the Vice Chair of the NCCN guidelines committee for bladder and penile cancer. J.Z. reports consultant work for Sanofi, AstraZeneca, Dendreon, Seagen, Bayer and Pfizer. G.D.G. reports consultant work for MyCareGorithm and stock options in Lantheus. J.M.B. reports consultant work for CG Oncology and Kalivir Immunotherapeutics and being a shareholder of CG Oncology and Kalivir Immunotherapeutics. C.P.N.D. reports consultant work for AstraZeneca and CG Oncology and intellectual property ownership related to the use of genetic alterations as a predictive biomarker for response to nadofaragene firadenovec. R.K.J. reports consultant work for AVEO, Bristol Myers Squibb, Sanofi, EMD Serono, Gilead Sciences, IDEOlogy Pfizer and Seattle Genetics/Astellas; speaker’s bureau for Gilead Sciences, Seagen and Seattle Genetics/Astellas; research funding from Bristol Myers Squibb, Gilead Sciences and the National Cancer Institute; and honoraria from FLASCO, Curio Science, DAVA Oncology, NCCN/Pfizer and OncLive/MJH Life Sciences. J.J.M. reports membership on the CG Oncology Board of Directors; being the Associate Center Director at Moffitt Cancer Center; ownership interest in Aleta Biotherapeutics, CG Oncology, Turnstone Biologics, Ankyra Therapeutics and AffyImmune Therapeutics; and consultant work for ONCoPEP, CG Oncology, Turnstone Biologics, Vault Pharma, Ankyra Therapeutics, AffyImmune Therapeutics, UbiVac, Vycellix and Aleta Biotherapeutics. J.R.C.-G. reports consultant work for Anixa Biosciences and Alloy Therapeutics; stock options in Compass Therapeutics, Anixa Biosciences and Alloy Therapeutics; patent licensed by Anixa Biosciences; intellectual property filed with Compass Therapeutics; and being the co-founder of Cellepus Therapeutics, a CAR T cell company. The other authors declare no competing interests.

Figures

Extended Data Fig. 1 |
Extended Data Fig. 1 |. Increases in viral replication is not associated with tumor intrinsic molecular features.
Fold change in GM-CSF, used as a surrogate marker for viral replication, was associated with neither baseline E2F target expression levels (n = 18; Pearson correlation R2 = 0.019; p = 0.58) (a), nor with molecular subtypes (n = 17; p = 0.228) (b).
Extended Data Fig. 2 |
Extended Data Fig. 2 |. Increase in T lymphocyte infiltration is not associated with baseline tumor/immune features nor treatment response.
Fold changes in infiltrating T lymphocyte levels were not associated with baseline tumor mutational burden (n = 19; CD3+ p = 0.33; CD4+ p = 0.23; CD8+ p = 0.81) (a); pre-treatment CD3+ lymphocytic infiltration (n = 19; CD3+ p = 0.27; CD4+ p = 0.44; CD8+ p = 0.43) (b); baseline tumor molecular subtypes (n = 17; CD3+ p = 0.11; CD4+ p = 0.305; CD8+ p = 0.16) (c); nor with treatment response (n = 19; CD3+ p = 0.97; CD4+ p = 0.9; CD8+ p = 0.5) (d). For dot-plots in a-c, correlation coefficients and P values were calculated using Pearson Correlation. For boxplots in d, boxes represent median (center) and first/third quartile (bottom and top, respectively) values; Tukey whiskers represent the ± 1.5 interquartile range (IQR); individual data points are shown in dots; Two-sided P values were calculated by Wilcoxon’s signed-rank test.
Extended Data Fig. 3 |
Extended Data Fig. 3 |. Phenotypic changes in T cell markers from pre-to post-treatment.
a, Gene expression levels of PDCD1 (PD-1), TNFRSF4 (b); LAG3 (c); and HAVCR2 (TIM3) (d) on bulk RNA sequencing were not different from pre-to post-treatment in pathologic complete responders vs. non-responders. Two-sided P values were calculated by Wilcoxon signed-rank test. Boxes represent median (center) and first/third quartile (bottom and top, respectively) values; Tukey whiskers represent the ± 1.5 interquartile range (IQR); individual data points are shown in dots colored by CR (blue) or NR (gray).
Extended Data Fig. 4 |
Extended Data Fig. 4 |. Enzyme-linked immunosorbent spot (ELISpot) analysis indicates heightened cell-mediated anti-tumor systemic reactivity in patients with pathologic complete response.
a, Representative plots showing fold changes in interferon-γ (IFN-γ) spot-forming units at weeks 2 and/or 6 compared to baseline in clinical responders and b, clinical non-responders. Significance increases were seen at the following timepoints in the following patients: Due to sample limitations, co-culture using neopeptide-primed monocyte-derived DCs with autologous T cells from each patient at each time point was conducted once without replicates.
Extended Data Fig. 5 |
Extended Data Fig. 5 |. No change was found in the tertiary lymphoid structure (TLS) density from pre-to post-treatment in non-responding patients following treatment.
a, Representative whole slide multiplex immunofluorescence images from a patient who did not respond to treatment, demonstrating lack of increase of TLS in the post-treatment samples. b, TLS density at baseline did not predict pathologic response to combined oncolytic immunotherapy and immune checkpoint inhibitor (n = 16; p = 0.594). Two-sided p values were calculated by Wilcoxon’s signed-rank test. Boxes represent median (center) and first/third quartile (bottom and top, respectively) values; Tukey whiskers represent the ± 1.5 interquartile range (IQR); individual data points are shown in dots colored by the response (responder = blue; non-responder = gray).
Extended Data Fig. 6 |
Extended Data Fig. 6 |. Features of mature vs. immature tertiary lymphoid structure (TLS).
a, TLS were scored according to morphological features on multiplex immunofluorescence. Immature TLS consisted of general clustering of CD20 + B cells with unclear shape and structure. Mature TLS consisted of large, oval or circular shaped conglomeration of CD20 + B cells. As expected, mature TLS were marked by higher surface areas (***p < 0.001) (b) and cellular density (**p = 0.00652) (c). Two-sided p values were calculated by Wilcoxon’s signed-rank test. Boxes represent median (center) and first/third quartile (bottom and top, respectively) values; Tukey whiskers represent the ± 1.5 interquartile range (IQR).
Extended Data Fig. 7 |
Extended Data Fig. 7 |. Heightened antibody response post-treatment is directed against tumor cells.
Of all pathologic complete responders, one patient exhibited downstaging of disease (cTis) on the post-treatment biopsy prior to attaining pathologic complete response at the time of radical cystectomy. On multiplex immunofluorescence staining of the post-treatment biopsy specimen, IgG was observed to coat tumor cells, suggesting specific antitumor humoral response.
Fig. 1 |
Fig. 1 |. Study design and clinical response of cisplatin-ineligible MIBC treated with neoadjuvant cretostimogene and nivolumab.
a, Study schema demonstrating the timing of neoadjuvant therapy, post-treatment assessment and radical cystectomy. Urine and peripheral blood samples were obtained before treatment at baseline, week 2 and week 6. b, Study CONSORT diagram. c, Individual pre-treatment clinical disease characteristics, treatment rendered and pathologic response for patients enrolled. d, Kaplan–Meier curve showing OS in the intention-to-treat population. One-year OS was 85.2% (95% CI: 71.1–100%). e, Kaplan–Meier curve showing the RFS in the intention-to-treat population. One-year RFS was 70.4% (95% CI: 53.0–93.4%). AE, adverse event; q1wk, once a week; q4wks, every 4 weeks.
Fig. 2 |
Fig. 2 |. Exploratory biomarker analyses based on the mechanism of action of the study agents.
a, Genetic construct of cretostimogene, a conditionally replicating dsDNA-based oncolytic adenovirus with the essential E1a gene genetically engineered under the control of a human E2F1 promoter, along with transgene encoding GM-CSF. b, Pre-ranked GSEA analysis using the hallmark gene sets revealed higher global expression of E2F targets in pre-treatment tumor samples from pathologic complete responders versus non-responders. NESs of GSEA are shown. Pathways were considered significant if FDR < 0.05. c, In pathologic non-responders, E2F target expression was decreased in the post-treatment samples, suggesting the elimination of free E2F1-high tumor clones through treatment. d, Using paired WES of the tumor and peripheral blood samples, somatic TMB was higher in the pathologic complete responders versus non-responders (**P = 0.0016). e, Baseline PD-L1 expression as measured by CPS was not significantly correlated with pCR (P = 0.37). f, Using fold change of urinary GM-CSF from pre-treatment to before second cretostimogene infusion as a surrogate measure, viral replication was found to correlate with baseline TMB (n = 18; Pearsonʼs correlation R2 = 0.34, *P = 0.012). ITR, inverted terminal repeat.
Fig. 3 |
Fig. 3 |. T cell response associated with combined oncolytic virotherapy and ICIs.
a, Urinary type I interferon-induced T-lymphocyte-attracting chemokines (CXCL9 and CXCL11) were significantly increased at week 2 as compared to baseline (***P = 0.00026 for CXCL9 and ****P < 0.0001 (P = 3.81 × 10⁻⁶) for CXCL-11) after oncolytic immunotherapy and maintained at higher levels by week 6 after combination treatment in all patients (*P = 0.021 for CXCL9 and ***P < 0.001 (P = 0.000483) for CXCL-11). b, Pro-inflammatory cytokines with tumor-promoting potential (IL-6, IL-8 and TNF) were relatively stable throughout the neoadjuvant treatment course (IL-6: baseline versus week 2 P = 0.87, baseline versus week 6 **P = 0.003, week 2 versus week 6, **P = 0.0094; IL-8: baseline versus week 2 P = 0.956, baseline versus week 6 *P = 0.044, week 2 versus week 6, *P = 0.03; TNF: baseline versus week 2 P = 0.19, baseline versus week 6 P = 0.154, week 2 versus week 6 *P = 0.033). c, Consistent increases in the tumor-infiltrating CD3+ (*P = 0.01), CD3+CD4+ (*P = 0.04) and CD3+CD8+ (*P = 0.01) T lymphocytes were detected in the post-treatment samples from both responders and non-responders. d, Expression levels of ENTPD1 (CD39) on bulk RNA-seq were elevated after treatment only in patients with pathologic CR and not in those without response (NR) (**P = 0.003 for CR and P = 0.31 for NR). e, To measure systemic anti-tumor response, we used ELISpot analyses on PBMCs collected at various timepoints on-treatment, using autologous mature DCs pulsed with synthetic neopeptides predicted from WES and RNA-seq from pre-treatment tumor samples co-cultured with autologous T lymphocytes. f, The number of total neopeptides predicted from the baseline tumor samples was higher in responders than non-responders (**P = 0.0045). g, Systemic autologous T cell response against the predicted neopeptides was broadly boosted in the responders compared to non-responders at various on-treatment timepoints. Two-sided P values were calculated using Wilcoxon signed-rank test. For box plots shown in ad and f: boxes represent median (center) and first and third quartile (bottom and top, respectively) values; Tukey whiskers represent the ±1.5 interquartile range (IQR); and individual data points are shown in dots. PanCK, pan-cytokeratin; Wk, week.
Fig. 4 |
Fig. 4 |. Combined OIT and ICI treatment induces the formation of mature TLSs.
a, On whole-slide multiplex immunofluorescence, the density of TLSs per unit of tissue surface area was found to be higher after treatment only in the pathologic complete responders (P = 0.07) and not in the non-responders (P = 0.34). b, Increase in the density of mature TLSs marked by dense B cell clusters adjacent to CD4/8 T cell conglomerates was significantly higher after treatment only in responders (**P = 0.0078) as compared to non-responders (P = 0.076). c, Urinary CXCL13 levels were uniformly increased after oncolytic immunotherapy and maintained at higher levels after combination treatment (**** P < 0.0001 (P = 1.34 × 10⁻⁵) at week 2 and **P = 0.004 at week 6). d, Density of CD138+ plasma cells was found to be higher in the TLSs on the post-treatment samples of responders (**P = 0.0078) as compared to non-responders (P = 0.082), indicating TLS maturation. Correspondingly, stromal CD138+ density was also found to be elevated only in the responders after treatment (P = 0.045) as compared to non-responders (P = 0.38). e, Isotype switching from IgM to IgA and IgG was found in the post-treatment samples from pathologic complete responders (P = 0.91 for IgM; **P = 0.003 for IgA; *P = 0.03 for IgG), further corroborating maturation of TLSs. Wilcoxon signed-rank test was used for statistical analyses using two-sided P values. For box plots shown in ae: boxes represent median (center) and first and third quartile (bottom and top, respectively) values. PanCK, pan-cytokeratin; Wk, week.

Comment in

  • Neoadjuvant therapy in MIBC.
    Leake I. Leake I. Nat Rev Urol. 2025 Jan;22(1):5. doi: 10.1038/s41585-024-00989-2. Nat Rev Urol. 2025. PMID: 39663416 No abstract available.

References

    1. Stein JP et al. Radical cystectomy in the treatment of invasive bladder cancer: long-term results in 1,054 patients. J. Clin. Oncol. 19, 666–675 (2001). - PubMed
    1. Grossman HB et al. Neoadjuvant chemotherapy plus cystectomy compared with cystectomy alone for locally advanced bladder cancer. N. Engl. J. Med. 349, 859–866 (2003). - PubMed
    1. International Collaboration of Trialists et al. International phase III trial assessing neoadjuvant cisplatin, methotrexate, and vinblastine chemotherapy for muscle-invasive bladder cancer: long-term results of the BA06 30894 trial. J. Clin. Oncol. 29, 2171–2177 (2011). - PMC - PubMed
    1. Flaig TW et al. NCCN Guidelines® Insights: Bladder Cancer, Version 2.2022. J. Natl Compr. Canc. Netw. 20, 866–878 (2022). - PubMed
    1. Galsky MD et al. Treatment of patients with metastatic urothelial cancer ‘unfit’ for cisplatin-based chemotherapy. J. Clin. Oncol. 29, 2432–2438 (2011). - PubMed

Publication types

Substances

Associated data