. 2024 Nov 9;17(1):459.
doi: 10.1186/s13071-024-06548-3.

Changes in lipid abundance are associated with disease progression and treatment response in chronic Trypanosoma cruzi infection

Affiliations

Changes in lipid abundance are associated with disease progression and treatment response in chronic Trypanosoma cruzi infection

Juan Carlos Gabaldón-Figueira et al. Parasit Vectors. .

Abstract

Background: Chagas disease, caused by the parasite Trypanosoma cruzi, is a zoonosis that affects more than seven million people. Current limitations on the diagnosis of the disease hinder the prognosis of patients and the evaluation of treatment efficacy, slowing the development of new therapeutic options. The infection is known to disrupt several host metabolic pathways, providing an opportunity for the identification of biomarkers.

Methods: The metabolomic and lipidomic profiles of a cohort of symptomatic and asymptomatic patients with T. cruzi infection and a group of uninfected controls were analysed using liquid chromatography/mass spectrometry. Differences among all groups and changes before and after receiving anti-parasitic treatment across those with T. cruzi infection were explored.

Results: Three lipids were found to differentiate between symptomatic and asymptomatic participants: 10-hydroxydecanoic acid and phosphatidylethanolamines PE(18:0/20:4) and PE(18:1/20:4). Additionally, sphinganine, 4-hydroxysphinganine, hexadecasphinganine, and other sphingolipids showed post-treatment abundance similar to that in non-infected controls.

Conclusions: These molecules hold promise as potentially useful biomarkers for monitoring disease progression and treatment response in patients with chronic T. cruzi infection.

Keywords: Trypanosoma cruzi; Hydroxydecanoic acid; Chagas disease; Lipidomics; Metabolomics; Phosphatidylethanolamine; Sphingolipids; Treatment response.


Conflict of interest statement

The authors declare no competing interests.

Figures
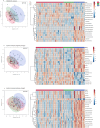
Fig. 1
Fig. 1
General metabolic trends observed in the clinical groups. PLS-DA analysis showing the separation between controls (n = 15 samples from 15 participants), asymptomatic (n = 40 samples from 20 participants), and symptomatic (n = 16 samples from eight participants) groups and heatmap of the top 20 most differentially abundant molecules (covariate-unadjusted one-way ANOVA) in the metabolomic (a), negatively charged, (b) and positively charged lipidomic analysis (c). Colours in the heatmap represent log10 peak intensity scale. In all cases: A stands for asymptomatic group, C for control group, and S for symptomatic group
Fig. 2
Fig. 2
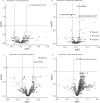
Differentially abundant metabolites in the clinical groups. Comparison of the metabolomic analysis of asymptomatic versus control participants (a). Comparison of symptomatic versus asymptomatic participants (b). Comparison of symptomatic participants versus controls in the negatively charged lipidomic analysis (c). Comparison of symptomatic group versus controls in the positively charged lipidomic analysis (d). Groups were compared using a multiple linear regression adjusted for sex and age, and treating participant ID as a random effect, to account for the inclusion of pre- and post-treatment samples. All P-values were adjusted using the Benjamini–Hochberg method to control the FDR. Features were considered to be differentially abundant if the logFC was >  ± 0.138, and had an FDR < 0.1
Fig. 3
Fig. 3
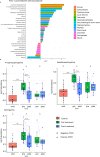
ROC curve analysis of features differentially abundant in symptomatic participants. ROC curves of the five differentially abundant molecules in symptomatic participants, and the combined model (a). Box-and-whisker plots of the abundance of metabolites in control (15 samples from 15 participants), asymptomatic (40 samples from 20 participants), and symptomatic participants (16 samples from eight participants) (b). In the box-and-whisker plots, lines represent the median, yellow dots represent group means, and boxes represent the interquartile range (IQR). Comparisons between different clinical groups were obtained using a multiple linear regression adjusted for sex and age and treating participant ID as a random effect, to account for the inclusion of pre- and post-treatment samples. All P-values were adjusted using the Benjamini–Hochberg method to control the FDR. In the statistical comparisons: *indicates 0.05 < P < 0.1, **indicates 0.01 < P < 0.05, and *** indicates P < 0.01. In all cases, A stands for the asymptomatic group, C for the control group, and S for the symptomatic group
Fig. 4
Fig. 4
Metabolic changes observed following anti-parasitic treatment with benznidazole. Metabolites differentially abundant in the asymptomatic post-treatment group (a). Box-and-whisker plots of 4-hydroxysphinganine, hexadecasphinganine, and sphinganine in control (C, 15 samples), asymptomatic (A, 20 samples pre- and post-treatment), and symptomatic groups (S, 8 samples pre- and post-treatment) (b). Yellow triangles represent group means. P-values for comparisons between different clinical groups were obtained using a multiple linear regression adjusted for sex and age. Comparisons between pre- and post-treatment time points were obtained using a paired t-test. All P-values were adjusted using the Benjamini–Hochberg method to control the FDR: *indicates 0.05 < P < 0.1, **indicates 0.01 < P < 0.05, and ***indicates P < 0.01

References

    1. Pérez-Molina JA, Molina I. Chagas disease. Lancet. 2018;391:82–94. - PubMed
    1. Ribeiro HG, Galdino OA, de Souza KSC, Rosa Neta AP, Lin-Wang HT, Cunha-Neto E, et al. Unraveling the role of miRNAs as biomarkers in Chagas cardiomyopathy: Insights into molecular pathophysiology. PLoS Negl Trop Dis. 2024;18:e0011865. - PMC - PubMed
    1. Sousa GR, Gomes JAS, Fares RCG, Damásio MPDS, Chaves AT, Ferreira KS, et al. Plasma cytokine expression is associated with cardiac morbidity in Chagas disease. PLoS ONE. 2014;9:e87082. - PMC - PubMed
    1. Keating SM, Deng X, Fernandes F, Cunha-Neto E, Ribeiro AL, Adesina B, et al. Inflammatory and cardiac biomarkers are differentially expressed in clinical stages of Chagas disease. Int J Cardiol. 2015;199:451–9. - PMC - PubMed
    1. Alonso-Padilla J, López MC, Esteva M, Zrein M, Casellas A, Gómez I, et al. Serological reactivity against T. cruzi-derived antigens: evaluation of their suitability for the assessment of response to treatment in chronic Chagas disease. Acta Trop. 2021;221:105990. - PubMed

LinkOut - more resources