. 2024 Nov 9;15(1):408.
doi: 10.1186/s13287-024-03973-0.

Identifying and optimizing critical process parameters for large-scale manufacturing of iPSC derived insulin-producing β-cells

Affiliations

Identifying and optimizing critical process parameters for large-scale manufacturing of iPSC derived insulin-producing β-cells

Haneen Yehya et al. Stem Cell Res Ther. .

Abstract

Background: Type 1 diabetes, an autoimmune disorder leading to the destruction of pancreatic β-cells, requires lifelong insulin therapy. Islet transplantation offers a promising solution but faces challenges such as limited availability and the need for immunosuppression. Induced pluripotent stem cells (iPSCs) provide a potential alternative source of functional β-cells and have the capability for large-scale production. However, current differentiation protocols, predominantly conducted in hybrid or 2D settings, lack scalability and optimal conditions for suspension culture.

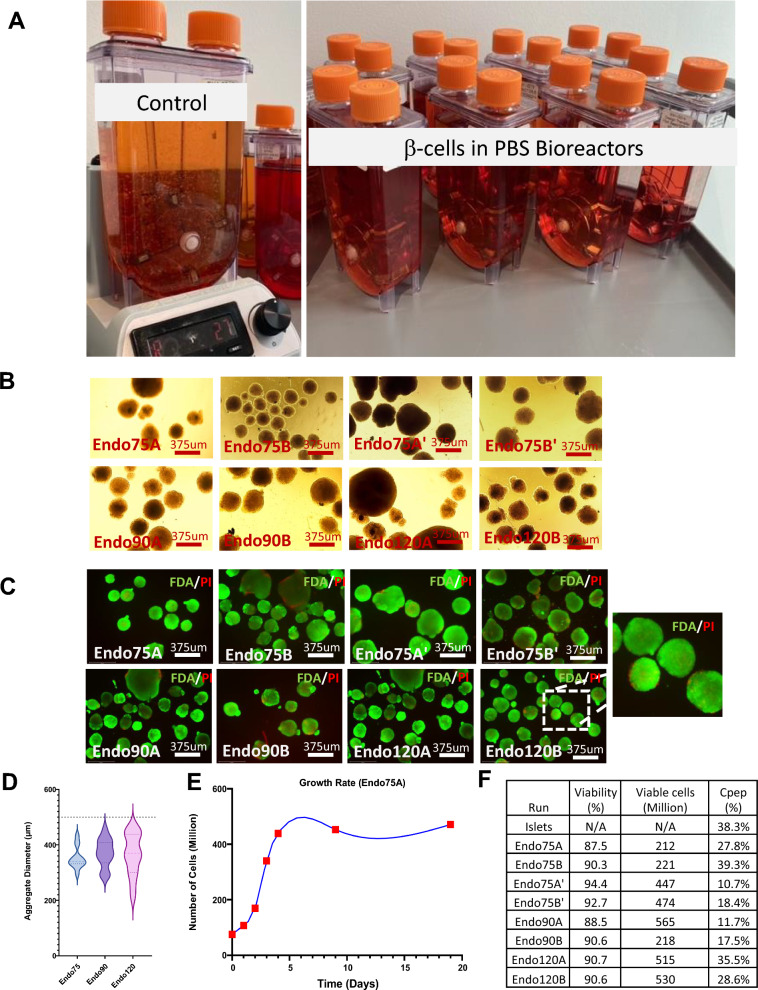
Methods: We examined a range of bioreactor scaleup process parameters and quality target product profiles that might affect the differentiation process. This investigation was conducted using an optimized High Dimensional Design of Experiments (HD-DoE) protocol designed for scalability and implemented in 0.5L (PBS-0.5 Mini) vertical wheel bioreactors.

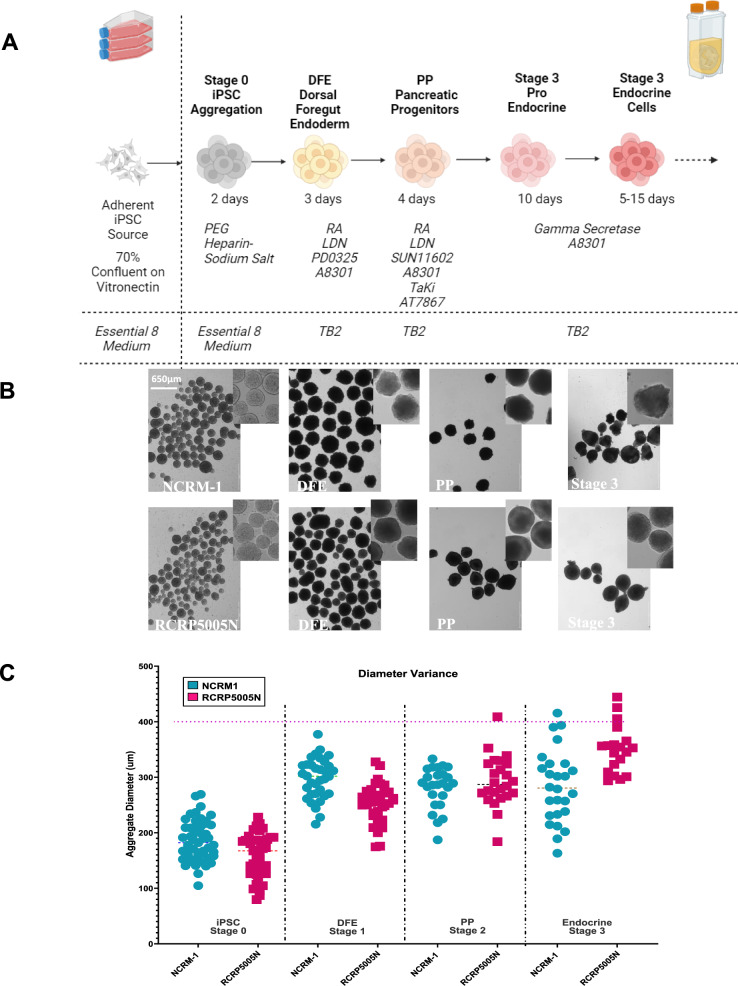
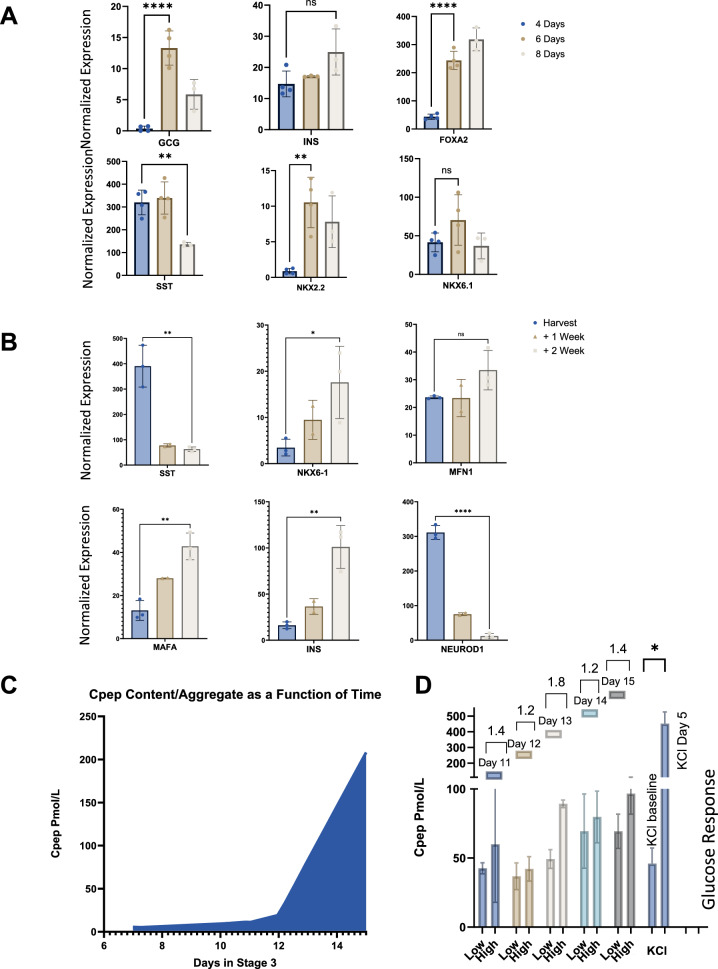
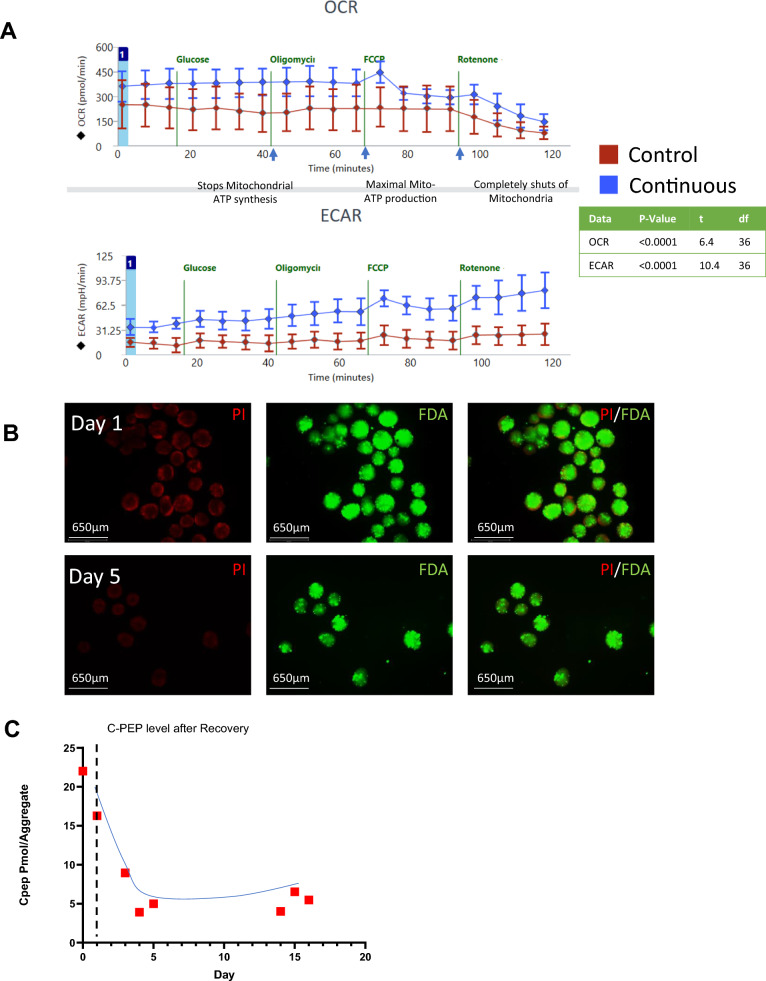
Results: A three stage suspension manufacturing process is developed, transitioning from adherent to suspension culture, with TB2 media supporting iPSC growth during scaling. Stage-wise optimization approaches and extended differentiation times are used to enhance marker expression and maturation of iPSC-derived islet-like clusters. Continuous bioreactor runs were used to study nutrient and growth limitations and impact on differentiation. The continuous bioreactors were compared to a Control media change bioreactor showing metabolic shifts and a more β-cell-like differentiation profile. Cryopreserved aggregates harvested from the runs were recovered and showed maintenance of viability and insulin secretion capacity post-recovery, indicating their potential for storage and future transplantation therapies.

Conclusion: This study demonstrated that stage time increase and limited media replenishing with lactate accumulation can increase the differentiation capacity of insulin producing cells cultured in a large-scale suspension environment.

Keywords: Bioprocess development; Bioreactor; Diabetes; DoE; Human induced pluripotent stem cell; Insulin producing cells; Islets; Optimization; Pancreatic cells; iPSCs; β-cells.


Conflict of interest statement

J.J. is founder of and shareholder of Trailhead Biosystems, Inc., Beachwood, OH, USA. M. B. is a shareholder in Trailhead Biosystems, Inc., Beachwood OH. This work has been filed as US Provisional Application No. application pending.

Figures

Fig. 1
Fig. 1
Bioreactor-based differentiation protocol timeline. A Schematic of the 3-stage differentiation pancreatic protocol used in bioreactors. Figure is created with BioRender.com B Images of bioreactor aggregates sampled throughout the different protocol stages. C Average aggregate size measurements on two different cell lines used throughout the protocol
Fig. 2
Fig. 2
Time study evaluating differentiation and function. A Gene expression profile from the end of stage 3 of harvested cells that had different prolonged PP induction timing of 4 days, 6 days, and 8 days B Gene expression profile of harvested endocrine cells with increasing 1-week intervals. C C-Peptide concentration per aggregate count as a function of time in endocrine induction media. D Glucose-Stimulated Insulin Secretion of endocrine aggregates as a function of time. The stimulation index for day 11, 12, 13, 14, 15 after the end of endocrine induction (10 days), was 1.4, 1.2, 1.8, 1.2 and 1.4 respectively. All bar charts show individual points with mean ± SD. *P < 0.05, **P < 0.01, ***P < 0.001, ****P < 0.0001
Fig. 3
Fig. 3
Characterization of glycolytic and stage specific markers throughout the differentiation protocol. A Glycolytic genes expression comparison between adherent and suspension culture over time. Comparisons are made at the end of each differentiation stage. B Gene expression profile of cells at different stages of the protocol. The stage being assayed is indicated below the graph. All bar charts show individual points with mean ± SD. *P < 0.05, **P < 0.01, ***P < 0.001, ****P < 0.0001
Fig. 4
Fig. 4
Impact of glucose consumption and lactate accumulation and profile on the differentiation and growth of cells A. Glucose and lactate concentration profile throughout the differentiation protocol on two bioreactors: the control which has frequent media changes at the different stages and the continuous which has no media changes but only spike in of differentiation factors at each stage. B Gene expression profile of cells for stage specific markers on both bioreactors after 20 days in stage 3 endocrine induction media. C Cell growth profile throughout the differentiation period on both control and continuous bioreactors. D The change of glucose over lactate concentration over time for the continuous bioreactor. All bar charts show individual points with mean ± SD. *P < 0.05, **P < 0.01, ***P < 0.001, ****P < 0.0001
Fig. 5
Fig. 5
Scale-up validation on multiple 0.5L bioreactors with different seeding densities. A An image of all bioreactors runs for this validation. B Dithizone staining of endocrine aggregates products. C Live dead staining on endocrine stage aggregates generated from all bioreactors using fluorescein diacetate for live staining and propidium iodide for dead staining. D Violin plot of the aggregate diameter variance on endocrine stage aggregate from all bioreactors runs including previous control. E The growth rate of cells over time for the Control media change bioreactor Endo75A. F Table summary of the viability of digested endocrine aggregates and their respective total cell count from each 500 ml bioreactor
Fig. 6
Fig. 6
Energy map profile and cryopreservation recovery on endocrine cells. A Seahorse data on OCR and their respective ECAR profiles on a control run with regular media changes versus a continuous bioreactor run. B Live dead staining using fluorescein diacetate for live staining and propidium iodide for dead staining. On endocrine aggregates that were recovered from cryopreservation. C-peptide concentration profile normalized to the number of aggregates on cryopreserved and recovered cells from bioreactors. OCR and ECAR charts show individual points with mean ± SD. *P < 0.05, **P < 0.01, ***P < 0.001, ****P < 0.0001

Similar articles

Cited by

References

    1. Roep BO, Thomaidou S, van Tienhoven R, Zaldumbide A. Type 1 diabetes mellitus as a disease of the β-cell (do not blame the immune system?). Nat Rev Endocrinol. 2021;17:150–61. - PMC - PubMed
    1. Sun H, Saeedi P, Karuranga S, Pinkepank M, Ogurtsova K, Duncan BB, et al. IDF Diabetes Atlas: Global, regional and country-level diabetes prevalence estimates for 2021 and projections for 2045. Diabetes Res Clin Pract. 2022;183. - PMC - PubMed
    1. T1D Index Website. 2024.
    1. Gamble A, Pepper AR, Bruni A, Shapiro AMJ. The journey of islet cell transplantation and future development. Islets. 2018;10:80–94. - PMC - PubMed
    1. Shapiro AMJ, Lakey JRT, Ryan EA, Korbutt GS, Toth E, Warnock GL, et al. Islet transplantation in seven patients with type 1 diabetes mellitus using a glucocorticoid-free immunosuppressive regimen. N Engl J Med. 2000;343:230–8. - PubMed

MeSH terms

LinkOut - more resources