. 2025 May;82(5):882-897.
doi: 10.1016/j.jhep.2024.10.044. Epub 2024 Nov 8.

Multi-modal analysis of human hepatic stellate cells identifies novel therapeutic targets for metabolic dysfunction-associated steatotic liver disease

Affiliations

Multi-modal analysis of human hepatic stellate cells identifies novel therapeutic targets for metabolic dysfunction-associated steatotic liver disease

Hyun Young Kim et al. J Hepatol. 2025 May.

Abstract

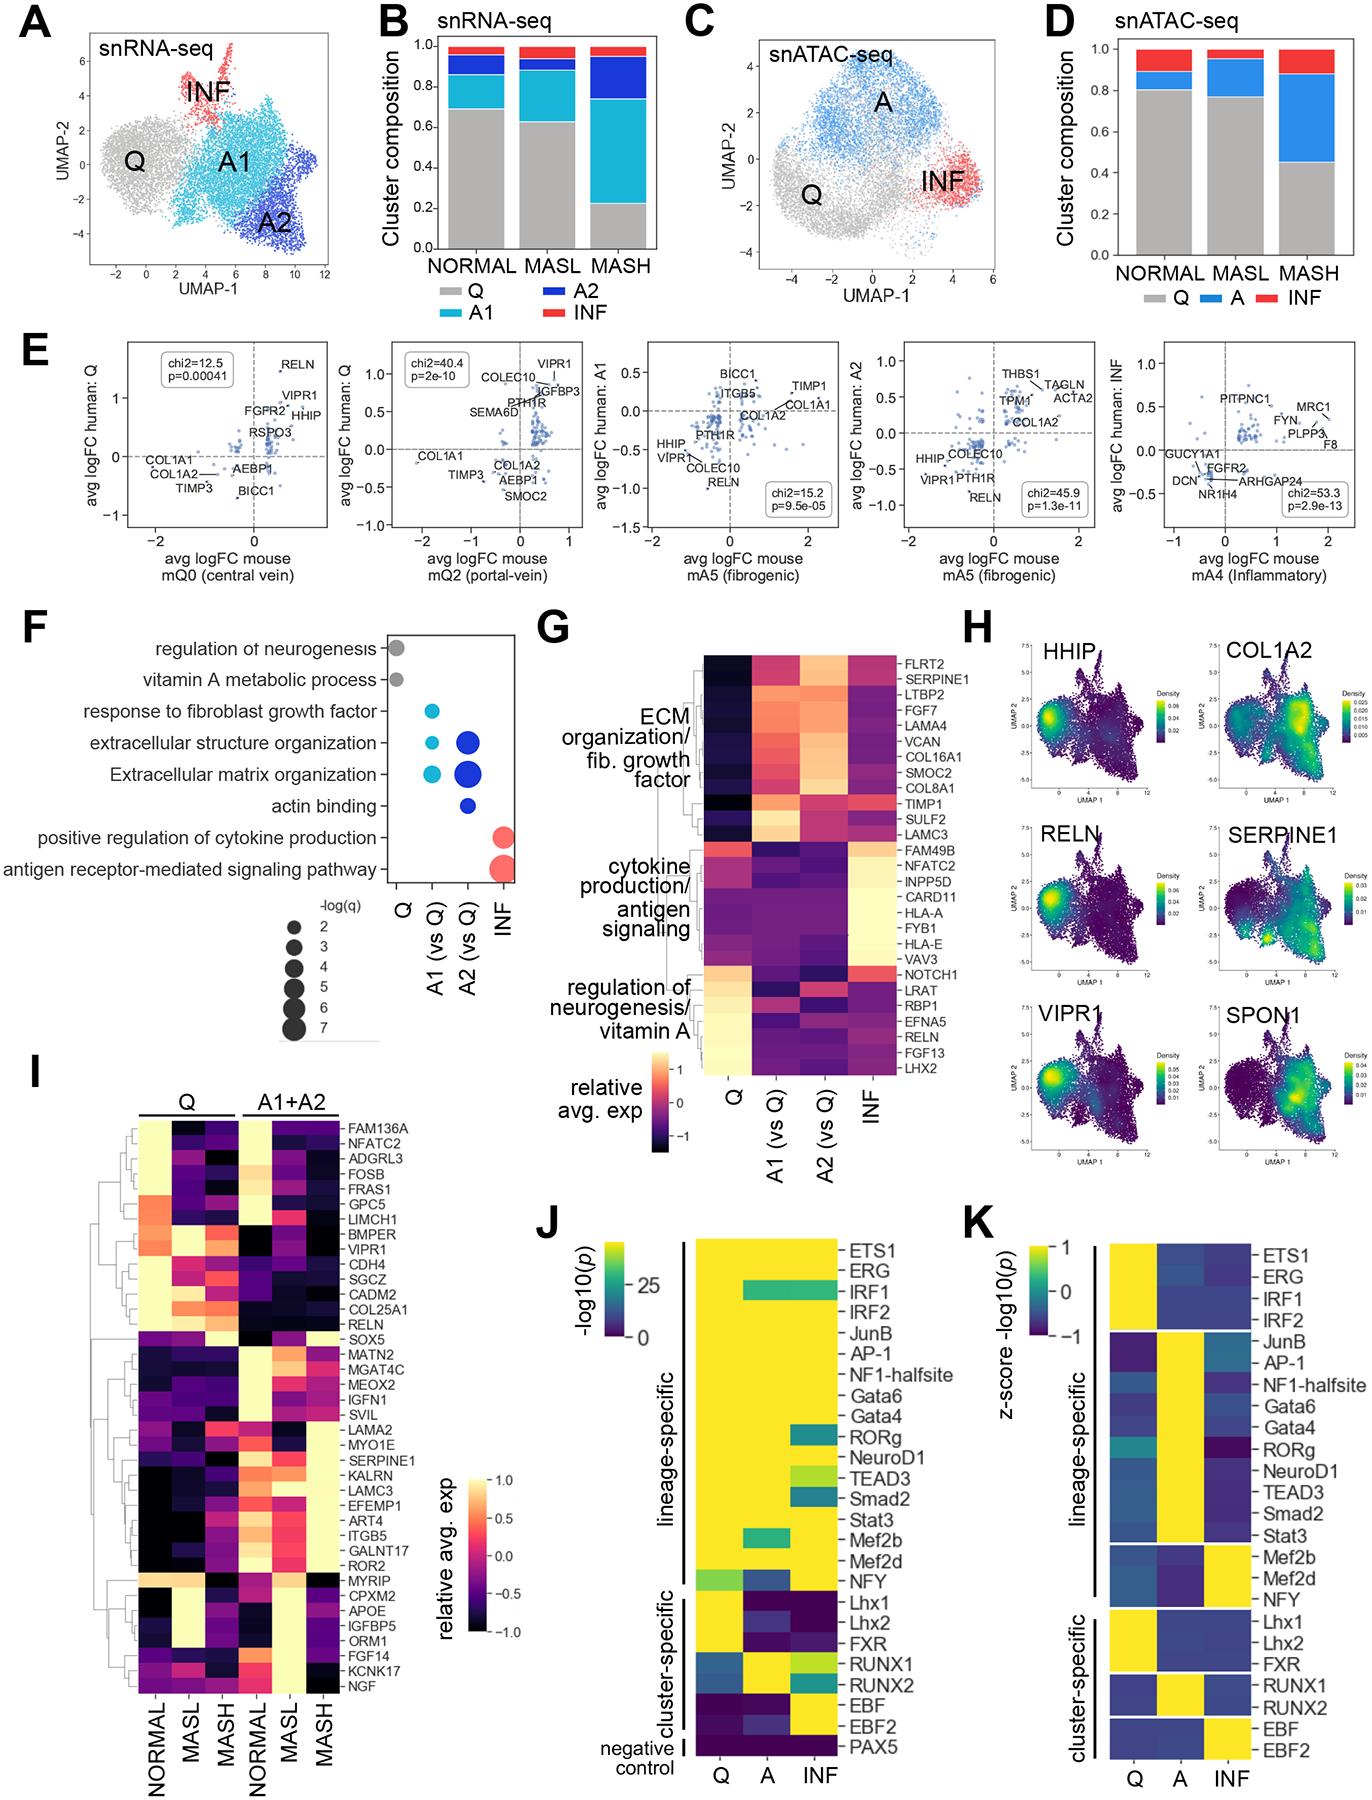
Background & aims: Metabolic dysfunction-associated steatotic liver disease ranges from metabolic dysfunction-associated steatotic liver (MASL) to metabolic dysfunction-associated steatohepatitis (MASH) with fibrosis. Transdifferentiation of hepatic stellate cells (HSCs) into fibrogenic myofibroblasts plays a critical role in the pathogenesis of MASH liver fibrosis. We compared transcriptome and chromatin accessibility of human HSCs from NORMAL, MASL, and MASH livers at single-cell resolution. We aimed to identify genes that are upregulated in activated HSCs and to determine which of these genes are key in the pathogenesis of MASH fibrosis.

Methods: Eighteen human livers were profiled using single-nucleus (sn)RNA-seq and snATAC-seq. High priority targets were identified, then tested in 2D human HSC cultures, 3D human liver spheroids, and HSC-specific gene knockout mice.

Results: MASH-enriched activated HSC subclusters are the major source of extracellular matrix proteins. We identified a set of concurrently upregulated and more accessible core genes (GAS7, SPON1, SERPINE1, LTBP2, KLF9, EFEMP1) that drive activation of HSCs. Expression of these genes was regulated via crosstalk between lineage-specific (JUNB/AP1), cluster-specific (RUNX1/2) and signal-specific (FOXA1/2) transcription factors. The pathological relevance of the selected targets, such as SERPINE1 (PAI-1), was demonstrated using dsiRNA-based HSC-specific gene knockdown or pharmacological inhibition of PAI-1 in 3D human MASH liver spheroids, and HSC-specific Serpine1 knockout mice.

Conclusion: This study identified novel gene targets and regulatory mechanisms underlying activation of fibrogenic HSCs in MASH, and demonstrated that genetic or pharmacological inhibition of select genes suppressed liver fibrosis.

Impact and implications: Herein, we present the results of a multi-modal sequencing analysis of human hepatic stellate cells (HSCs) from NORMAL, MASL (metabolic dysfunction-associated steatotic liver), and metabolic dysfunction-associated steatohepatitis (MASH) livers. We identified additional subclusters that were not detected by previous studies and characterized the mechanism by which HSCs are activated in MASH livers, including the transcriptional machinery that induces the transdifferentiation of HSCs into myofibroblasts. For the first time, we described the pathogenic role of activated HSC-derived PAI-1 (a product of the SERPINE1 gene) in the development of MASH liver fibrosis. Targeting the RUNX1/2-SERPINE1 axis could be a novel strategy for the treatment of liver fibrosis in patients.

Keywords: MASH; MASLD; activation of human HSCs; liver fibrosis; snRNA-seq and snATAC-seq.


Conflict of interest statement

Conflict of interest The authors of this study declare that they do not have any conflict of interest. Please refer to the accompanying ICMJE disclosure forms for further details.

Figures

Figure 1.
Figure 1.. Characterization of human NORMAL, MASL, and MASH HSCs across platforms
(A) Sample size, data types, number of cells across platforms per condition. (B) Heatmap: relative marker gene expression averaged by cell type in snRNA-seq. (C) Regions of open chromatin in cell type marker genes in snATAC-seq. (D-E) snRNA-seq: (D) UMAP plot showing identified cell types, (E) composition plot and table showing distribution of cells per condition. (F-G) snATAC-seq: (F) UMAP plot showing identified cell types, (G) composition plot and table showing distribution of cells per condition. (H) Principal component analysis of HSCs per condition. (I-K) snRNA-seq: (I) Relative expression (averaged by condition for nominally significant genes, p<0.05) which distinguish NORMAL, MASL, and MASH HSCs. (J) Heatmap: correlation between differential gene expression in HSCs across conditions. NORMAL and MASL tend to upregulate the same genes, Pearson R=0.51. NORMAL and MASL HSCs negatively correlated with genes induced in MASH HSCs. (K) Pathways which most distinguish gene expression of NORMAL, MASL, and MASH HSCs. (L-N) snATAC-seq: (L) Relative accessibility (averaged by condition for nominally significant peaks, p<0.05) distinguish NORMAL, MASL, and MASH HSCs. (M) Heatmap: correlation between differential accessibility peaks in HSCs across conditions. NORMAL and MASL upregulate similar genes, R=0.63. NORMAL and MASL negatively correlated with MASH. (N) Selected pathways which most distinguish chromatin accessibility in NORMAL, MASL, and MASH. (K, N) Size of the circle represents significance of the enrichment, with larger circles indicating a smaller p-value.
Figure 2.
Figure 2.. Integration of sequencing modalities through molecular interaction networks
(A-C) Molecular interaction networks in (A) NORMAL (B) MASL, and (C) MASH HSCs (p<0.05). Genes identified by both platforms are shown in large half-circles. (D) ECM organization subnetwork of genes accessible/upregulated in MASH HSCs. (E) Heatmap: relative expression of selected genes specific for NORMAL, MASL, and MASH HSCs.
Figure 3.
Figure 3.. Subclusters of NORMAL, MASL, and MASH HSCs
(A-B) snRNA-seq: (A) UMAP dimensionality reduction plot and (B) composition plot depicting subclusters by condition. (C-D) snATAC-seq: (C) UMAP dimensionality reduction plot and (D) composition plot showing subclusters by condition. (E-I) snRNA-seq: (E) Scatter plots demonstrating overlapping expression of the “marker genes” between mouse and human HSC subclusters. A χ2 test shows significance in direction of up/downregulation between mouse and human marker genes. (F) Dotplot: representative pathways distinguishing each HSC subcluster. A1 and A2 were compared to quiescent cells to highlight the fibrogenic pathways upregulated in both. Dot size reflects significance. (G) Heatmap: relative expression of genes from cluster-specific pathways in panel F. (H) UMAP density plots showing expression of selected quiescent and activated genes. (I) Heatmap of relative expression of selected genes in qHSC (Q) or aHSCs (A1+A2) per condition. (J-K) snATAC-seq: (J) Absolute and (K) relative motif enrichment and binding TFs for differentially accessible peaks/cluster are shown in heatmaps.
Figure 4.
Figure 4.. Unique characteristics of Q, A1, and A2 subclusters of MASH HSCs
(A) Boxplots: subcluster composition distribution within condition revealed cluster heterogeneity of NORMAL, MASL, and MASH HSCs. Data are mean ± SD; *p<0.05 and **p<0.01, Wilcoxon rank-sum test. (B) Stacked bar-chart showing the composition of Q, A1 and A2 HSCs by fibrosis score. (C) Table: severity of liver disease correlated with predominant cluster. A1 mostly aligned with stage 3 fibrosis (donors D14, D16); A2 mostly aligned with stage 4 (D12). Three donors had cells equally distributed between A1 and A2 (D11, D15, and D18, with stage 4 fibrosis). Three MASH HSCs (D10, D13, and D17 with stage 2 or 3 fibrosis) had a high proportion of cells in Q, demonstrating that some qHSCs may be transitioning to A1. (D) Pseudotime trajectory mapped to HSC UMAP coordinates. Direction of arrow indicates predicted cell state progression from Q to A1 to A2. (E) Distribution of HSCs by condition along the pseudotime coordinates. (F) Average expression of select activated (top row) and quiescent (bottom row) HSC marker genes plotted along binned pseudotime. Points: average expression of cells in bin, error bars: 3×SE. Point colors correspond to predominant subcluster within each pseudotime bin.
Figure 5.
Figure 5.. Genes that mediate ECM organization network in MASH HSCs
(A) Network of genes accessible and upregulated in MASH aHSCs, enriched in ECM organization pathway (blue), and actin filament organization (pink) (p<0.05). Selected genes for follow-up are highlighted in yellow. (B) Average expression of selected 6 core MASH aHSC genes by cluster (top) and condition (bottom); error bars: 95% confidence interval. (C) Differential expression/accessibility statistics. (D) Normalized accessibility peaks. (E) Accessibility plot for the regions surrounding SERPINE1. (F) Network of TFs which are known to target ≥2 prioritized aHSC genes. The networks of the master regulator RUNX1/2 are highlighted in red. (G) Network constructed from predicted regulatory relationships between signal-, cluster-, and lineage-specific TFs and selected core aHSC genes. Arrows indicate a significant motif binding event (adj. p<0.1; FIMO). (H) Proposed regulation of HSC activation via crosstalk between TFs. (I) EMSA assay demonstrated specific binding of RUNX1 from the lysates of CMV-RUNX1/2-Flag-transfected HEK293 (vs CMV-Flag-transfected HEK293) to the Serpine1 enhancer probe. Addition of anti-Flag Ab resulted in probe super-shift. (J) RUNX2 locus-specific ChIP analysis was performed using human HSC ± TGFβ1 (5 ng/ml, 24 h). Data are mean ± SD; ***p< 0.001, one-way ANOVA followed by Tukey’s test.
Figure 6.
Figure 6.. HSC-specific knockdown of SERPINE1 suppressed fibrogenic responses in human liver spheroids with MASH
(A-C) Cultured human MASH HSCs (donor n=2, D21 and D23, triplicates) were analyzed by qRT-PCR: (A) HSCs were stimulated ± human TGFβ1 (5 ng/ml, 24 h). (B) HSCs were transfected with gene-targeting (or scrambled) dsiRNA, the efficiency of gene knockdown was measured by qRT-PCR. Data are mean ± SD; *p<0.05 and ***p<0.001, unpaired two-tailed student t-test. (C) Expression of fibrogenic genes was assessed in gene-targeted (vs control) HSCs ±TGFβ1. (D) Human liver spheroids±MASH were generated using hepatocytes (D19) + NPCs (D22) + HSCs (D23), harvested, and immunostained. (scale bar=200 μm or 250 μm). (E-H) Expression of fibrogenic genes in control and MASH liver spheroids containing dsiRNA gene targeted HSCs was assessed using (E) qRT-PCR, (F-G) Western blotting, or (H) immunohistochemistry. (scale bar=200 μm). (I-J) Control and MASH liver spheroids containing RELN-knocked down HSCs were assessed using (I) qRT-PCR, and (J) Western blotting. (K-M) The effect of PAI-1 inhibitor TM5441 (0, 20, and 40 μM) on expression of fibrogenic genes was tested using (K) human HSCs ± TGFβ1 (24 h); or MASH (vs control) liver spheroids using (L) qRT-PCR or (M) Western blotting. (C-L) Data are mean ± SD; *p<0.05, **p<0.01, and ***p<0.001, one-way ANOVA followed by Tukey’s test.
Figure 7.
Figure 7.. HSC-specific genetic ablation of Serpine1 suppresses CCl4 liver fibrosis in mice.
HSCs were isolated from Serpine1f/f, HSCSerpine1f/-, and HSCΔSerpine1 mice (n=3–4/group) treated with CCl4- or corn oil (A-C) for 2 weeks: expression of (A) Serpine1 and (B) fibrogenic genes was analyzed by qRT-PCR and (C) Western blotting. (D-F) for 6 weeks: expression of (D) Serpine1 and (E) fibrogenic genes was analyzed by qRT-PCR and (F) Western blotting. (G) HSCΔSerpine1 and Serpine1f/f mice ± CCl4 (6 weeks): Serpine1 mRNA was measured in livers, (H) PAI-1 levels were measured in plasma. (I-L) Livers from CCl4 and control Serpine1f/f and HSCΔSerpine1 mice (n=5–10/group) were stained (I) with H&E, Sirius Red, and anti-ɑSMA antibody (scale bar=200 μm), positive area was calculated as percent. (J) Liver/body weight ratio and (K) fibrogenic gene expression were assessed. (L) Liver fibrosis was assessed in CCl4-injured Serpine1f/f and HSCΔSerpine1 mice using Second Harmonic Generation microscopy (scale bar=1mm or 200 μm), fibrillar collagen-positive area was calculated as percent. Data are mean ± SD; *p<0.05, **p<0.01, and ***p< 0.001, one-way ANOVA followed by Tukey’s test.

References

    1. Kisseleva T, Brenner D. Molecular and cellular mechanisms of liver fibrosis and its regression. Nature Reviews Gastroenterology & Hepatology 2021;18:151–166. - PubMed
    1. Liu X, Xu J, Rosenthal S, Zhang L-j, McCubbin R, Meshgin N, et al. Identification of Lineage-Specific Transcription Factors That Prevent Activation of Hepatic Stellate Cells and Promote Fibrosis Resolution. Gastroenterology 2020;158:1728–1744.e1714. - PMC - PubMed
    1. Rosenthal SB, Liu X, Ganguly S, Dhar D, Pasillas MP, Ricciardelli E, et al. Heterogeneity of HSCs in a Mouse Model of NASH. Hepatology 2021;74:667–685. - PMC - PubMed
    1. Heinz S, Benner C, Spann N, Bertolino E, Lin YC, Laslo P, et al. Simple Combinations of Lineage-Determining Transcription Factors Prime cis-Regulatory Elements Required for Macrophage and B Cell Identities. Molecular Cell 2010;38:576–589. - PMC - PubMed
    1. Song M-S, Alluin J, Rossi JJ. The Effect of Dicer Knockout on RNA Interference Using Various Dicer Substrate Small Interfering RNA (DsiRNA) Structures. Genes 2022;13:436. - PMC - PubMed