. 2025 Apr;19(4):1203-1228.
doi: 10.1002/1878-0261.13757. Epub 2024 Nov 10.

Replenishing co-downregulated miR-100-5p and miR-125b-5p in malignant germ cell tumors causes growth inhibition through cell cycle disruption

Affiliations

Replenishing co-downregulated miR-100-5p and miR-125b-5p in malignant germ cell tumors causes growth inhibition through cell cycle disruption

Marta Ferraresso et al. Mol Oncol. 2025 Apr.

Abstract

MicroRNAs (miRNAs) are short, nonprotein-coding RNAs, and their expression is dysregulated in malignant germ cell tumors (GCTs). Here, we investigated the causes and consequences of downregulated miR-99a-5p/miR-100-5p (functionally identical) and miR-125b-5p levels in malignant GCTs regardless of age, site, or subtype. Quantitative RT-PCR was used to assess miR-99a-5p/miR-100-5p, miR-125b-5p, and associated gene expression in malignant GCT tissues/cell lines [seminoma (Sem), yolk sac tumor (YST), embryonal carcinoma (EC)]. Cells were treated with demethylating 5-azacytidine and pyrosequencing was performed. Combination miR-100-5p/miR-125b-5p mimic replenishment was used to treat malignant GCT cells. Global messenger RNA (mRNA) targets of the replenished miRNAs were identified and Metascape used to study pathway effects. We found that expression levels of miR-99a-5p/miR-100-5p and miR-125b-5p, their respective pri-miRNAs, and associated genes from chromosomes 11 and 21 (chr11/chr21) were downregulated and highly correlated in malignant GCT cells. Treatment with 5-azacytidine caused upregulation of these miRNAs, with pyrosequencing revealing hypermethylation of their chr11/chr21 loci, likely contributing to miR-100-5p/miR-125b-5p downregulation. Combination miR-100-5p/miR-125b-5p mimic replenishment resulted in growth inhibition in Sem/YST cells, with miR-100-5p/miR-125b-5p mRNA targets enriched in downregulated genes, which were involved in cell cycle (confirmed by flow cytometry) and signaling pathways. Knockdown of the miR-100-5p/miR-125b-5p target tripartite motif containing 71 (TRIM71kd) recapitulated miR-100-5p/miR-125b-5p replenishment, with growth inhibition and cell cycle disruption of Sem/YST/EC cells. Further, replenishment led to reduced lin-28 homolog A (LIN28A) levels and concomitant increases in let-7 (MIRLET7B) tumor suppressor miRNAs, creating a sustained reversion of cell phenotype. In summary, combination miR-100-5p/miR-125b-5p mimic replenishment or TRIM71kd caused growth inhibition in malignant GCT cells via cell cycle disruption. Further studies are now warranted, including mimic treatment alongside conventional platinum-based chemotherapy.

Keywords: germ cell tumor; in vitro models; mRNA; methylation; microRNA; testis.


Conflict of interest statement

The authors declare no conflict of interest.

Figures
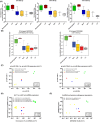
Fig. 1
Fig. 1
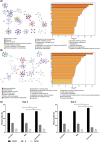
MiR‐99a‐5p, miR‐100‐5p, and miR‐125b‐5p expression and correlations of primary microRNA (pri‐miRNA), long interspersed noncoding RNA (lincRNA), and protein‐coding gene expression from chromosomes 11 and 21 in malignant germ cell tumor (GCT) clinical samples and cell lines relative to nonmalignant (gonadal and teratoma) control samples. (A) Normalized log2 microarray expression levels for miR‐99a‐5p, miR‐100‐5p, and miR‐125b‐5p. (B) Summated normalized log2 microarray intensity ratio boxplots showing seed intensity for the nucleotide (nt) sequences ‘ACCCGU’ (left; 2‐7nt seed of miR‐99a‐5p/miR‐100‐5p) and ‘CCCUGA’ (right; 2–7 nt seed of miR‐125b‐5p). The clinical samples in (A) and (B) represent normal gonads (n = 8, green), teratomas (Ter; n = 5, brown), seminoma (Sem; n = 13, blue), yolk sac tumor (YST; n = 12, yellow), embryonal carcinoma (EC; n = 3, red), and malignant GCT cell lines (CL; n = 6, gray). In all panels in (A) and (B), the horizontal bar = median expression and the box = minimum to maximum values with whiskers = standard deviation. It should be noted that it is not possible to reliably apply statistical testing to these normalized log2 microarray expression levels in (A) nor the derived intensity ratios in (B). (C) Correlations between expression of pri‐miRNAs from chromosome 11 (chr11; left panel; pri‐miR‐125b‐1 vs. pri‐miR‐100) and chromosome 21 (chr21; right panel; pri‐miR‐125b‐2 vs. pri‐miR‐99a). (D) Correlation between pri‐miRNA expression from chr11 and chr21. (E) Correlation between expression of associated lincRNA/protein‐coding genes on chr11 (MIR100HG/BLID) and chr21 (MIR99AHG), which include the regions encoding the miRNAs of interest. In (D, E), the comparison for each gene type is indicated by a symbol (circle, triangle, square, diamond), as described in the Figure. All expression values are referenced to the mean of pooled normal gonadal (ovary/testis) control samples. Color‐coding for (D) and (E) is as described in the color key (C). For experiments (C–E), statistical significance is determined using linear regression analysis.
Fig. 2
Fig. 2
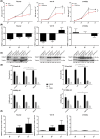
DNA methylation at chromosome 11 and 21 loci in malignant germ cell tumor (GCT) cells. In each panel in (A, B), the upper figure shows the cumulative levels of endogenous CpG DNA methylation across the chromosome 11 (chr11; A) or chromosome 21 (chr21; B) locus, while the lower figure represents the genomic location map of all the CpG sites examined. The colors in each bar (from the base to top) correspond to the individual CpG coordinates (from left to right) in the respective genomic map. The size of each bar represents the average percentage of methylation per CpG site, ranging from 0 (no methylation) to 100% (fully methylated). Accordingly, given 23 and 12 CpG sites assessed for chr11 and chr21, respectively, the maximum cumulative methylation score for each is 2300 and 1200. P‐values (Student's t‐test): ****P < 0.0001. The controls comprised five tissues/cell lines, namely three normal cervical squamous epithelium samples and the normal cell lines HFFF2 (fibroblasts) and 340‐RPE‐11tv (retina). (C) Overall DNA methylation percentage (%) for the malignant GCT cell lines, testis, and controls. The percentage given represents methylation across 35 CpG sites on both chr11 and chr21 and thus is out of a total cumulative methylation score of 3500.
Fig. 3
Fig. 3
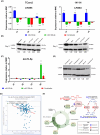
Phenotypic and genotypic effects of combination miR‐100‐5p and miR‐125b‐5p replenishment in malignant germ cell tumor (GCT) cells. (A) Growth curves for TCam2 (left) and 1411H (right) cells after transfection with total 16.7 nm concentration of combination miR‐100‐5p (8.33 nm) and miR‐125b‐5p (8.33 nm) mimics, or 16.7 nm mimic‐negative‐control (MNC). (B) TCam2 (left) and 1411H (right) cell number at day 7 (d7) after transfection with miR‐100‐5p and/or miR‐125b‐5p mimics, either alone or in combination, relative to MNC, which was assigned to 100%. All total concentrations used were 16.7 nm; where combination microRNA (miRNA) mimics were used, this was an 8.33 nm equimolar concentration of each. (C) Sylamer plots showing the single summed significance score (SSSS) of the seed complementary regions (SCRs) corresponding to miR‐99a‐5p/miR‐100‐5p (blue line) and miR‐125b‐5p (green line) in the ranked gene lists from TCam2 (left) and 1411H (right) cells at d2 following treatment with 16.7 nm combination miR‐100‐5p and miR‐125b‐5p mimic replenishment, compared with 16.7 nm MNC‐treated cells. Log10‐transformed P‐values for each SCR word are on the y‐axis, against the ranked gene list (from downregulated on the left to upregulated on the right) on the x‐axis. A positive y‐axis deflection on the left‐hand side of the plot signifies SCR enrichment in downregulated genes. Error bars = standard error of the mean (SEM). Statistical significance (Student's t‐test): *P ≤ 0.05, **P < 0.01, ***P < 0.005, ****P < 0.001; NS, nonsignificant. Note that all experiments were performed in biological triplicate (i.e., n = 3) for individual treatment conditions, each with technical replicates.
Fig. 4
Fig. 4
Validation of downregulated miR‐99a‐5p/miR‐100‐5p and miR‐125b‐5p messenger RNA (mRNA) targets in malignant germ cell tumor (GCT) cells following microRNA (miRNA) replenishment. (A) Quantitative RT‐PCR (qRT‐PCR) validation of expression levels in TCam2 (left) and 1411H (right) cells of the four downregulated mRNA targets TRIM71, FGFR3, ARID3B, and E2F7, that all contained the seed complementary region (SCR) for both miR‐99a‐5p/miR‐100‐5p and miR‐125b‐5p, identified from Sylamer analysis of microarray data at day (d) two following combination miR‐100‐5p/miR‐125b‐5p replenishment. Levels shown are for day 1 (d1), d2, and d3 post‐miRNA replenishment. For this work, cells were treated as described in Fig. 3, namely total miRNA/mimic‐negative‐control (MNC) concentrations were used at 16.7 nm; and for combination miRNA mimics, this was an 8.33 nm equimolar concentration of each. Target expression levels for these replenishment conditions are as per the color‐code below the qRT‐PCR plots. Error bars = standard error of the mean (SEM). Statistical significance (Student's t‐test): *P ≤ 0.05, **P < 0.01, ***P < 0.005, ****P < 0.001. Only significant comparisons are shown. Note that all experiments were performed in biological triplicate (i.e., n = 3) for individual treatment conditions, each with technical replicates. (B) Further validation of downregulated TRIM71 at the protein level at d2 and d3 by representative western blot for TCam2 (left) and 1411H (right) cells, from experiments performed in biological triplicate (i.e., n = 3). Tubulin protein is used as a loading control. The experimental condition used is shown above each blot. The quantification number under each band on the blot represents densitometry analysis of protein expression normalized to tubulin using imagej software and referenced to expression in MNC‐treated cells, which are given an arbitrary value of 1.00. The size of the specific protein is listed in kilodaltons (kDa) on the right‐hand side of the blots. (C) Co‐expression analysis of miR‐100‐5p levels (left) and miR‐125b‐5p levels (right) (x‐axis) with TRIM71 mRNA levels (y‐axis) in malignant GCT tissue samples (n = 156). Data obtained from the independent ENCORI Pan‐Cancer Analysis Platform. For the co‐expression analysis in (C), statistical significance is determined using linear regression analysis; the red line indicates the best fit line based on this analysis.
Fig. 5
Fig. 5
Metascape pathway analysis in malignant germ cell tumor (GCT) cells at day 2 (d2) following combination miR‐100‐5p and miR‐125b‐5p replenishment. Bar plots (right) and associated network analyses (left) for (A) TCam2 (d2; 832 genes) and (B) 1411H (d2; 852 genes), showing the top‐20 most significant functional pathways for the downregulated seed complementary region (SCR)‐containing messenger RNA (mRNA) targets of miR‐100‐5p or miR‐125b‐5p following 16.7 nm combination microRNA (miRNA) replenishment. (C) Bar plots of the percentage (%) of TCam2 cells in G0/G1‐ (black), S‐ (dark gray) and G2/M‐ (light gray) phase of the cell cycle as assessed by flow cytometry at d2 and day 3 (d3) following 16.7 nm combination miR‐100‐5p and miR‐125b‐5p replenishment, compared with mimic‐negative‐control (MNC)‐treated and untreated cells. Data represent the mean and error bars = standard error ofthe mean (SEM) of biological triplicate values. Statistical significance (Student's t‐test) with the appropriate MNC comparison: *P ≤ 0.05, **P < 0.01. Only significant comparisons are shown.
Fig. 6
Fig. 6
Knockdown of TRIM71 (TRIM71kd) recapitulates combination miR‐100‐5p and miR‐125b‐5p replenishment in malignant germ cell tumor (GCT) cells. (A) Growth curves for TCam2 (left), 1411H (center), and 2102Ep (right) cells following transfection with 40 nm TRIM71 or nontargeting control (NTC) short interfering RNA (siRNA) compared with untreated cells. (B) TRIM71 messenger RNA (mRNA) levels by quantitative RT‐PCR (qRT‐PCR) and (C) representative TRIM71 protein levels by western blotting for malignant GCT cells corresponding to the growth curves in (A), from experiments performed in biological triplicate (i.e., n = 3). Tubulin protein is used as a loading control. The experimental condition used is shown above each blot. The quantification number under each band on the blot represents densitometry analysis of protein expression normalized to tubulin using imagej software and referenced to expression in nontargeting control (NTC)‐treated cells, which are given an arbitrary value of 1.00. The size of the specific protein is listed in kilodaltons (kDa) on the right‐hand side of the blots. (D) Bar plots of the percentage (%) of malignant GCT cells for TCam2 (upper panels) and 2012Ep (lower panels) in G0/G1‐ (black), S‐ (dark gray), and G2/M‐ (light gray) phase of the cell cycle as assessed by flow cytometry at day 2 (d2) and d3 following 40 nm TRIM71kd, compared with NTC‐treated and untreated cells. (E) CDKN1A mRNA levels by qRT‐PCR in malignant GCT cells following 40 nm TRIM71kd. Note that all experiments in (A, B, D, E) were performed in biological triplicate (i.e., n = 3) for individual treatment conditions, each with technical replicates; the data shown in (A, B, D, E) represent the mean and error bars = standard error of the mean (SEM) of these biological triplicate values. Statistical significance (Student's t‐test) with the appropriate NTC comparison: *P ≤ 0.05, **P < 0.01, ***P < 0.005. Only significant comparisons are shown.
Fig. 7
Fig. 7
Combination miR‐100‐5p/miR‐125b‐5p replenishment results in LIN28A depletion and late concomitant increases in let‐7 tumor suppressor microRNA (miRNA) levels in malignant germ cell tumor (GCT) cells. (A) LIN28A quantitative RT‐PCR (qRT‐PCR) levels in TCam2 (left) and 1411H (right) cells at day (d) 1, d2, and d3 following microRNA (miRNA) replenishment. For this work, cells were treated as described in Fig. 3, namely total miRNA/mimic‐negative‐control (MNC) concentrations were used at 16.7 nm; and for combination miRNA mimics, this was an 8.33 nm equimolar concentration of each, as per the color‐code below the qRT‐PCR plots. (B) Representative LIN28A protein levels by western blot on d2 and d3 in TCam2 cells. (C) Let‐7b‐5p miRNA expression levels as quantified by qRT‐PCR at d1, d2, d3, and d6, and (D) representative LIN28A protein levels by western blot at d4 and d7; both following mimic replenishment in TCam2 cells as detailed in (A) above. Note that the experiments in (A) and (C) were performed in biological triplicate (i.e., n = 3) for individual treatment conditions, each with technical replicates; the data shown in (A) and (C) represent the mean and error bars = SEM of these biological triplicate values. For (A) and (C), statistical significance using Student's t‐test is shown with the appropriate comparisons: *P ≤ 0.05, **P < 0.01, ***P < 0.005, ****P < 0.001. Only significant comparisons are shown. For representative western blots shown in (B) and (D), these were from experiments performed in biological triplicate (i.e., n = 3), with tubulin protein used as a loading control. The experimental condition used is shown above each blot. The quantification number under each band on the blot represents densitometry analysis of protein expression normalized to tubulin using imagej software and referenced to expression in mimic‐negative‐control (MNC)‐treated cells, which are given an arbitrary value of 1.00. The size of the specific protein is listed in kilodaltons (kDa) on the right‐hand side of the blots. (E) Co‐expression analysis of let‐7b‐5p levels (x‐axis) with LIN28A mRNA levels (y‐axis) in malignant GCT tissue samples (n = 156). Data obtained from the independent ENCORI Pan‐Cancer Analysis Platform. For the co‐expression analysis in (E), statistical significance is determined using linear regression analysis; the red line indicates the best fit line based on this analysis. (F) Graphical abstract summarizing potential miRNA effects on the cell cycle in malignant GCTs derived from data from this manuscript and published studies. Reduced levels (blue arrows) of tumor suppressor miR‐100‐5p/miR‐125b‐5p miRNAs result in increased levels (red arrows) of, for example, TRIM71, with concomitant reductions in cyclin‐dependent kinase (CDK)‐interacting protein/kinase inhibitory protein (CIP/KIP) family members such as CDKN1A (blue arrow) [43], coding for p21 protein. In turn, this allows cell cycle progression through reduced physical inhibition (i.e., increased activity; black arrows) of CDK2 and CDK4 [58]. As demonstrated in this study, replenishment of these downregulated miRNAs, or TRIM71kd, reduces cell cycle proliferation through converse effects on the pathway and thus G0/G1 and G1/S transition. Further contributions to malignant GCT pathogenesis are likely from, for example, reduced miRNA‐mediated control of LIN28A levels. High LIN28A levels cause increased degradation of let‐7 tumor suppressor miRNA family members, reducing its own inhibition via the LIN28A/let‐7 feedback loop, resulting in cellular proliferation [21]. To add to the complexity, TRIM71 itself is also a direct mRNA target of the let‐7 family [42]. Finally, the effects of overexpressed oncogenic miR‐371~373 and miR‐302/367 miRNAs also converge on the cell cycle through CIP/KIP family members [22]. 3′UTR, 3′ untranslated region. Schematic created with BioRender.com.

References

    1. Palmer RD, Murray MJ, Saini HK, van Dongen S, Abreu‐Goodger C, Muralidhar B, et al. Malignant germ cell tumors display common microRNA profiles resulting in global changes in expression of messenger RNA targets. Cancer Res. 2010;70(7):2911–2923. - PMC - PubMed
    1. Teilum G. Classification of endodermal sinus tumour (mesoblatoma vitellinum) and so‐called “embryonal carcinoma” of the ovary. Acta Pathol Microbiol Scand. 1965;64(4):407–429. - PubMed
    1. Murray MJ, Nicholson JC, Coleman N. Biology of childhood germ cell tumours, focussing on the significance of microRNAs. Andrology. 2015;3(1):129–139. - PMC - PubMed
    1. Coradini PP, Cigana L, Selistre SG, Rosito LS, Brunetto AL. Ototoxicity from cisplatin therapy in childhood cancer. J Pediatr Hematol Oncol. 2007;29(6):355–360. - PubMed
    1. Kollmannsberger C, Kuzcyk M, Mayer F, Hartmann JT, Kanz L, Bokemeyer C. Late toxicity following curative treatment of testicular cancer. Semin Surg Oncol. 1999;17(4):275–281. - PubMed