. 2024 Nov 10;22(1):691.
doi: 10.1186/s12951-024-02951-1.

Silver nanoparticle induced immunogenic cell death can improve immunotherapy

Affiliations

Silver nanoparticle induced immunogenic cell death can improve immunotherapy

Ara Sargsian et al. J Nanobiotechnology. .

Erratum in

Abstract

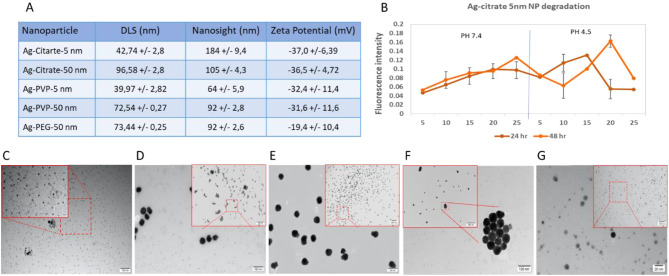
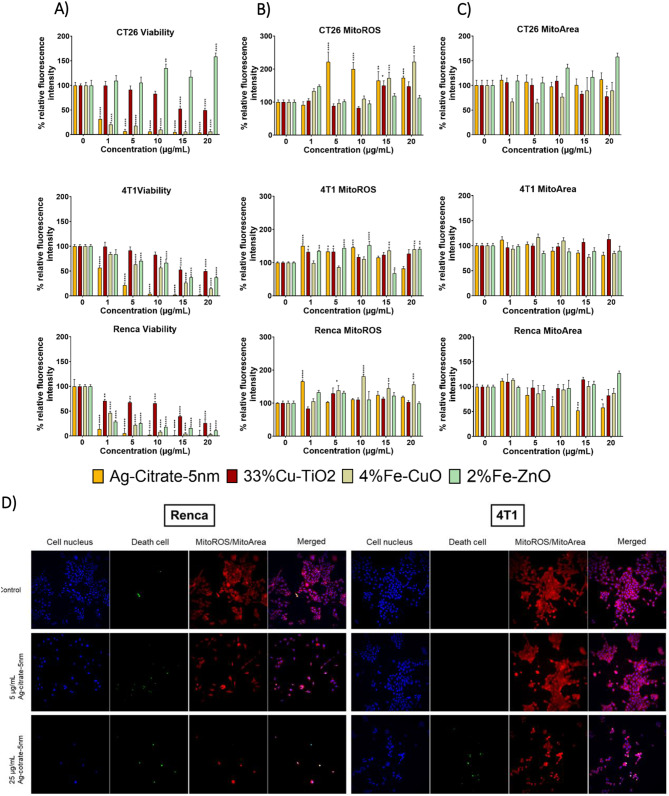
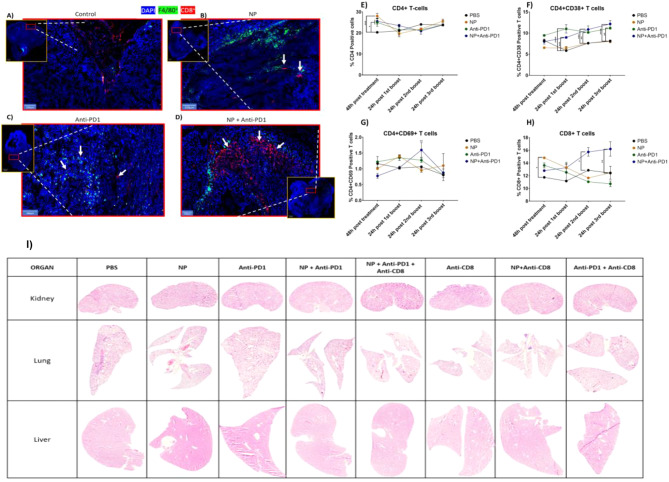
Cancer immunotherapy is often hindered by an immunosuppressive tumor microenvironment (TME). Various strategies are being evaluated to shift the TME from an immunologically 'cold' to 'hot' tumor and hereby improve current immune checkpoint blockades (ICB). One particular hot topic is the use of combination therapies. Here, we set out to screen a variety of metallic nanoparticles and explored their in vitro toxicity against a series of tumor and non-tumor cell lines. For silver nanoparticles, we also explored the effects of core size and surface chemistry on cytotoxicity. Ag-citrate-5 nm nanoparticles were found to induce high cytotoxicity in Renca cells through excessive generation of reactive oxygen species (ROS) and significantly increased cytokine production. The induced toxicity resulted in a shift of the immunogenic cell death (ICD) marker calreticulin to the cell surface in vitro and in vivo. Subcutaneous Renca tumors were treated with anti-PD1 or in combination with Ag-citrate-5 nm. The combination group resulted in significant reduction in tumor size, increased necrosis, and immune cell infiltration at the tumor site. Inhibition of cytotoxic CD8 + T cells confirmed the involvement of these cells in the observed therapeutic effects. Our results suggest that Ag-citrate-5 nm is able to promote immune cell influx and increase tumor responsiveness to ICB therapies.

Keywords: Cancer; Immunogenic cell death; Immunotherapy; In vivo; Silver nanoparticles.


Conflict of interest statement

Declarations Competing interests The authors declare no competing interests.

Figures

Fig. 1
Fig. 1
Characterization of silver nanoparticles of different surface coatings and different sizes. (A) Table representing the physical characteristics of the different nanoparticles including; hydrodynamic diameter based on dynamic light scattering (DLS) and nanoparticle tracking analysis (NanoSight), polydispersity index (PdI), and surface charge based on the ζ-potential of the different nanoparticles. All data are displayed as mean ± standard deviation (n = 3). TEM images of (B) Ag-citrate-5 nm NP degradation following 24 h and 48 h incubation in culture media at PH 7.4 and PH 4.5. at 5, 10, 15, 20, and 25 µg/ml concentrations. (C) Ag-citrate-5 nm NPs, (D) Ag-Citrate-50 nm NPs, (E) Ag-PVP-5 nm NPs, (F) Ag-PVP-50 nm NPs, and (G) Ag-PEG-50 nm NPs. The respective scale bars are indicated in both the main image as well as the highlighted (red square) magnified high resolution images
Fig. 2
Fig. 2
In vitro analysis of Ag NP cytotoxicity in different cells. Representative bar graphs generated for the indicated cells (4T1, A549, Renca, HeLa) and mesenchymal stem cells (MSC). (A) Effect on the viability of cells. (B) Effect on mitochondrial ROS production in living cells. (C) Effect on the mitochondrial area. D) Effect on cellular morphology. The data are presented for cells exposed to different inorganic NPs at the indicated concentrations for 24 h and expressed relative to the level of untreated control cells (100%). The data are gathered from three independent experiments (n=3). The level of significance was indicated when appropriate (*:p< 0.05; **:p< 0.01; ***:p < 0.001; ****:p<0.0001)
Fig. 3
Fig. 3
In vitro cytotoxicity of different NP types against murine cancer cells. Representative bar graphs generated for the indicated cells (CT26, 4T1, and Renca. (A) Effect on the viability of cells. (B) Effect on mitochondrial ROS production. (C) Effect on the mitochondrial area. The data are presented for cells exposed to different inorganic NPs at the indicated concentrations for 24 h and expressed relative to the level of untreated control cells (100%). The data are gathered from three independent experiments (n = 3). (D) Representative high-content images of Renca (left panel) and 4T1 (right panel) cells stained with the indicated dyes to measure cell death or mitochondrial ROS for control conditions (top row), or cells exposed to Ag-citrate-5 nm at 5 µg/ml (middle row) or at 25 µg/ml (bottom row) for 24 h. The level of significance was indicated when appropriate (*:p < 0.05; **:p < 0.01; ***:p < 0.001; ****:p < 0.0001)
Fig. 4
Fig. 4
Immunostimulatory effects of Ag NPs evaluated in vitro (A) A schematic describing the mechanism of AgNP induced immunogenic cell death. (B) Histograms displaying the level of surface-located calreticulin in Renca, 4T1 and CT26 cells exposed to Ag-citrate-5 nm (5 µg/ml), 2% Fe-ZnO (15 µg/mL), 4% Fe-CuO (5 µg/mL), and to 33% Cu-TiO2 (30 µg/mL) for 24 h. (C) Histograms displaying the level of surface-located calreticulin in Renca cells exposed to differently coated and sized AgNPs at a concentration of 5 µg/mL for 24 h as measured by ImageStream analysis. (D) Cytokine expression in Renca cells after exposure to 5 µg/ml Ag-citrate-5 nm in vitro for 24 h. Results are presented as mean ± SEM (n = 3) in percentages of calreticulin detected on the cell surface or of intracellularly expressed cytokines. The level of significance was indicated when appropriate (*:p < 0.05; **:p < 0.01; ***:p < 0.001; ****:p < 0.0001)
Fig. 5
Fig. 5
Therapeutic effects of Ag-citrate-5 nm on Renca tumors and syngergy with anti-PD1 ICB. (A) Relative photon flux (radiance) of Renca-luc + tumors either injected (a) peritumorally with PBS (100 µl/animal; control), (b) peritumorally with Ag citrate-5 nm (20 µg/mouse), (c) intraperitoneally with an anti-PD-1 antibody (150 µg/animal). The mice in the combination groups were injected peritumorally with Ag citrate-5 nm (20 µg/mouse) and intraperitoneally with anti-PD-1 antibody (150 µg/animal). The combination groups and the IT group were in total injected intraperitoneally with anti-PD-1 three times (boost) with an interval of 4 days between injections. Further control groups include (1) intraperitoneal administration of anti-CD8 (150 µg/ml), (2) anti-PD1 + anti-CD8, (3) Ag citrate-5 nm + anti-CD8 or Ag citrate-5 nm + anti-PD1 + anti-CD8. Representative bioluminescence images of mice with Renca Luc+ flank tumors in different treatment groups. These groups also include treatment with anti-CD8 antibody either as monotherapy, or in combination with NPs, anti-PD1 or both where anti-CD8 antibody (150 µg/animal) was administered intraperitoneally three times with an interval of 4 days between injections. (B) Tumor flux of Renca Luc+ cells in photon per flux. Subcutaneous Renca tumors were treated with higher concentration of Ag-citrate-5 nm (50 µg/mouse) and Anti-PD1 (200 µg/mouse). Representative bioluminescence images of mice with Renca Luc+ flank tumors in different treatment groups. Representative image of the tumors at the final timepoint. (C) Bar graphs displaying the level of caspase and elastase at the tumor as measured through non-invasive optical imaging. Representative fluorescence images of mice with Renca Luc+ flank tumors in different treatment groups. (D) Bar graphs showing the cancer cell-selective calreticulin translocation to the cell surface as evaluated through ImageStream based flow cytometry upon treatment with the various conditions. The results are presented as the mean of the animals/group ± SEM. The level of significance was indicated when appropriate (*:p < 0.05; **:p < 0.01; ***:p < 0.001)
Fig. 6
Fig. 6
Effect of Ag-citrate-5 nm, with or without IT, on immune cell activation in the spleen and tumor tissue. Representative fluorescence images of tumor tissue section obtained from Renca luc+ tumors treated with (A) PBS, (B) Ag-citrate-5 nm monotherapy, (C) anti-PD1 monotherapy or (D) combination therapy. The images reveal tissue sections stained for F4/80 (green, macrophages), CD8 (CD8+ T cells, red) and counterstained with DAPI (cell nuclei, blue). Scale bars of 100 μm are indicated in the bottom left corner. Bar graphs displaying the levels of (E) CD4+ T cells in the spleen, (F) CD4+ CD38+ active T cells in the spleen, (G) CD4+ CD69+ active T cells in the spleen or (H) CD8+ T cells in the spleen. The results are presented as the normalized mean + SEM in percentages related to the control group (PBS =100%). The level of significance was indicated when appropriate (*:p<0.05; **:p< 0.01; ***:p<0.001; ****:p<0.0001). I) Representative H&E stained images of kidney (top row), lung (middle row) and liver (bottom row) tissue sections of tumor-bearing mice treated with the respective agents indicated at the top

References

    1. Guan X. Cancer metastases: challenges and opportunities. Acta Pharm Sin B. 2015;5(5):402–18. - PMC - PubMed
    1. Robert C. A decade of immune-checkpoint inhibitors in cancer therapy. Nat Commun 2020 111 [Internet]. 2020 Jul 30 [cited 2021 Nov 28];11(1):1–3. https://www.nature.com/articles/s41467-020-17670-y - PMC - PubMed
    1. Jia L, Zhang Q, Zhang R. PD-1/PD-L1 pathway blockade works as an effective and practical therapy for cancer immunotherapy. Cancer Biol Med [Internet]. 2018 May 1 [cited 2021 Nov 28];15(2):116. https://www.pmc/articles/PMC5994550 - PMC - PubMed
    1. De Sousa Linhares A, Battin C, Jutz S, Leitner J, Hafner C, Tobias J et al. Therapeutic PD-L1 antibodies are more effective than PD-1 antibodies in blocking PD-1/PD-L1 signaling. Sci Reports 2019 91 [Internet]. 2019 Aug 7 [cited 2021 Nov 28];9(1):1–9. https://www.nature.com/articles/s41598-019-47910-1 - PMC - PubMed
    1. Zhou Z, Wang H, Li J, Jiang X, Li Z, Shen J. Recent progress, perspectives, and issues of engineered PD-L1 regulation nano-system to better cure tumor: A review. Int J Biol Macromol. 2024;254(Pt 2):127911. - PubMed

MeSH terms

LinkOut - more resources