

Analyzing immune cell infiltrates in skeletal muscle of infantile-onset Pompe disease using bioinformatics and machine learning
- PMID: 39523364
- PMCID: PMC11551188
- DOI: 10.1038/s41598-024-78634-6
Analyzing immune cell infiltrates in skeletal muscle of infantile-onset Pompe disease using bioinformatics and machine learning
Abstract
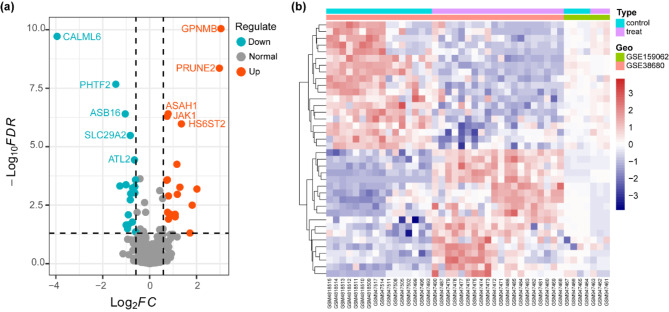
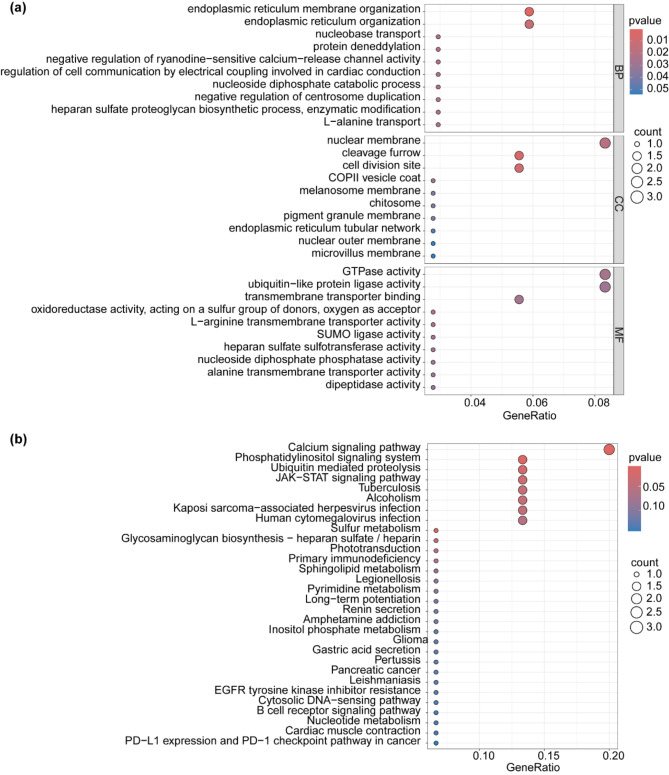
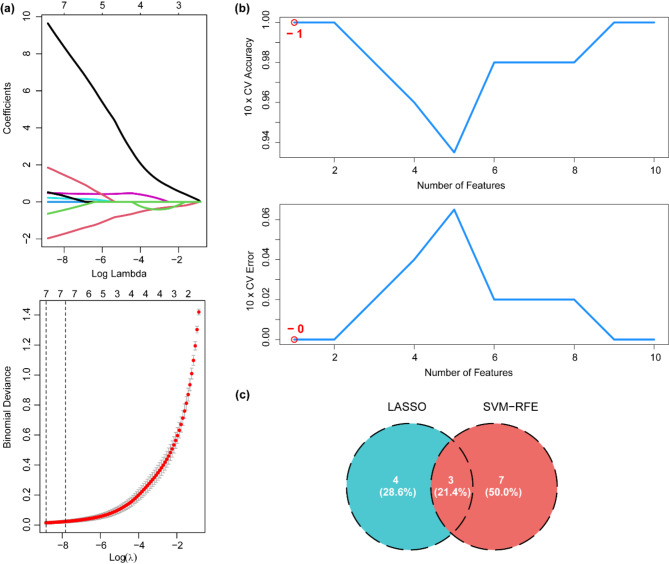
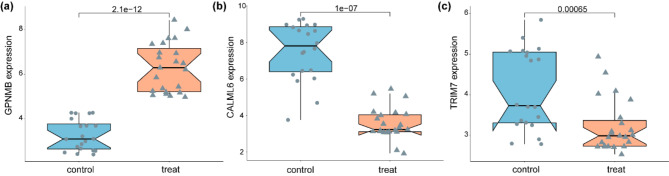
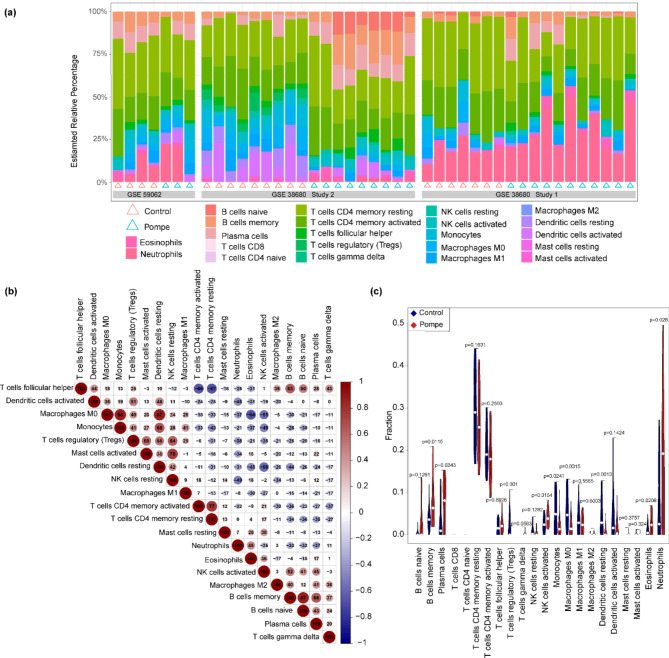
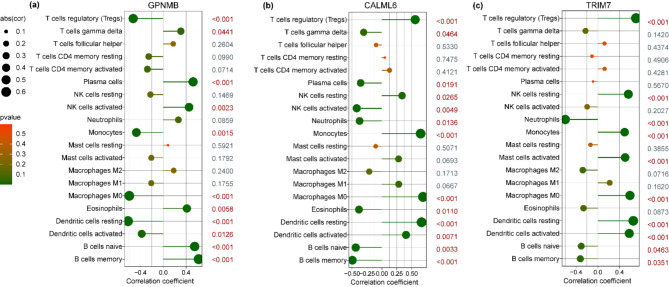
Pompe disease, a severe lysosomal storage disorder, is marked by heart problems, muscle weakness, and respiratory difficulties. This study aimed to identify novel markers for infantile-onset Pompe disease by analyzing key genes and immune cells infiltrating affected skeletal muscles, building on existing research linking its progression to the immune cell infiltration. The datasets GSE38680 and GSE159062 were downloaded and differential expression genes (DEGs) were identified. Potential markers were screened using support vector machine recursive feature elimination (SVM-RFE) analysis and least absolute shrinkage and selection operator (LASSO) regression models. To analyze DEGs and immune processes, 22 immune cell types in affected tissues were examined using CIBERSORT. Kyoto Encyclopedia of Genes and Genomes (KEGG) pathway analysis revealed significant enrichment in the calcium signaling pathway, phosphatidylinositol signaling system, ubiquitin-mediated proteolysis and JAK-STAT signaling pathway. Machine learning identified GPNMB, CALML6 and TRIM7 as key genes. Immune cell infiltration analysis showed that the expression levels of the above three genes were closely related to immune cells in our target population under study, including T cells regulatory (Tregs), monocytes, macrophages M0, resting and activated dendritic cells, naive and memory B cells. Overall, our study results may provide new clues for exploring markers related to Pompe disease by highlighting key genes and their relationship with immune infiltration, offering insights into the disease's development. However, previous studies have shown limited evidence of significant immune cell infiltration in muscle biopsies from Pompe patients, and this lack of direct evidence necessitates further investigation and experimental validation in laboratory settings to confirm these associations.
Keywords: GEO datasets; Immune cells infiltration; Machine learning; Pompe disease; Signatures.
© 2024. The Author(s).
Conflict of interest statement
Figures
Similar articles
-
The shared biomarkers and immune landscape in psoriatic arthritis and rheumatoid arthritis: Findings based on bioinformatics, machine learning and single-cell analysis.PLoS One. 2024 Nov 7;19(11):e0313344. doi: 10.1371/journal.pone.0313344. eCollection 2024. PLoS One. 2024. PMID: 39509434 Free PMC article.
-
Bioinformatics analysis of effective biomarkers and immune infiltration in type 2 diabetes with cognitive impairment and aging.Sci Rep. 2024 Oct 7;14(1):23279. doi: 10.1038/s41598-024-74480-8. Sci Rep. 2024. PMID: 39375405 Free PMC article.
-
Predicting diagnostic gene expression profiles associated with immune infiltration in patients with lupus nephritis.Front Immunol. 2022 Dec 2;13:839197. doi: 10.3389/fimmu.2022.839197. eCollection 2022. Front Immunol. 2022. PMID: 36532018 Free PMC article.
-
Bioinformatic analysis of related immune cell infiltration and key genes in the progression of osteonecrosis of the femoral head.Front Immunol. 2024 Jan 11;14:1340446. doi: 10.3389/fimmu.2023.1340446. eCollection 2023. Front Immunol. 2024. PMID: 38283345 Free PMC article.
-
Integration of Bioinformatics and Machine Learning Strategies Identifies Ferroptosis and Immune Infiltration Signatures in Peri-Implantitis.Int J Mol Sci. 2025 May 1;26(9):4306. doi: 10.3390/ijms26094306. Int J Mol Sci. 2025. PMID: 40362543 Free PMC article.
References
-
- Kishnani, P. S. et al. A retrospective, multinational, multicenter study on the natural history of infantile-onset pompe disease. J. Pediatr.148 (5), 671–676 (2006). - PubMed
-
- van den Hout, H. M. et al. The natural course of infantile pompe’s disease: 20 original cases compared with 133 cases from the literature. Pediatrics. 112 (2), 332–340 (2003). - PubMed
MeSH terms
Substances
Grants and funding
LinkOut - more resources
Full Text Sources
Medical
