. 2024 Nov 10;14(1):27463.
doi: 10.1038/s41598-024-76211-5.

Impact of high-fructose diet and metformin on histomorphological and molecular parameters of reproductive organs and vaginal microbiota of female rat

Affiliations

Impact of high-fructose diet and metformin on histomorphological and molecular parameters of reproductive organs and vaginal microbiota of female rat

Mürşide Ayşe Demirel et al. Sci Rep. .

Abstract

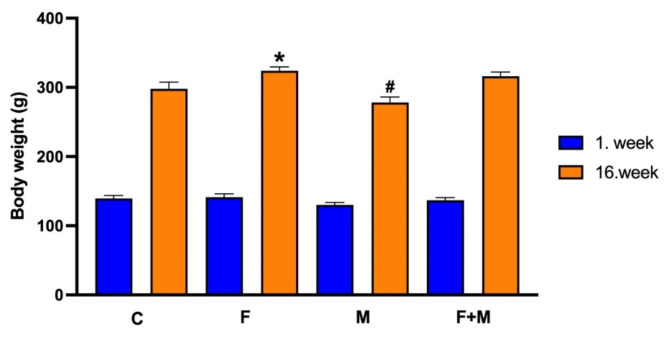
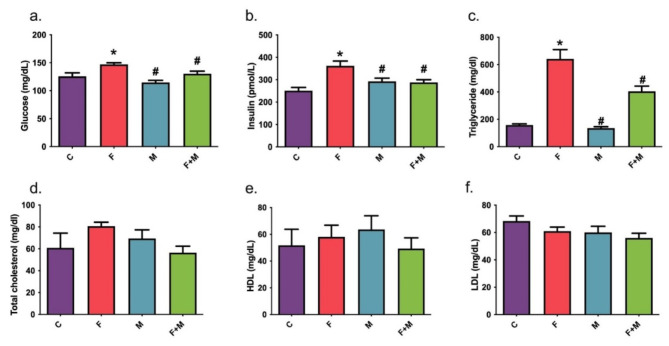
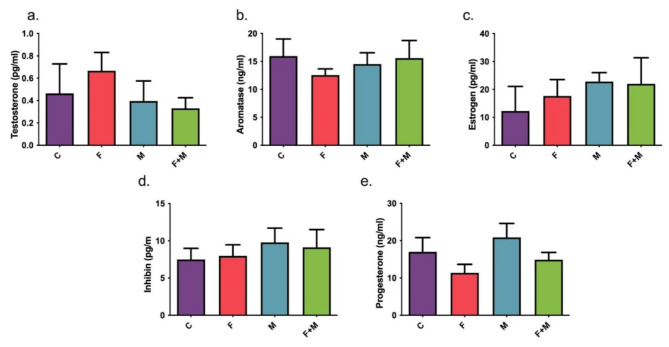
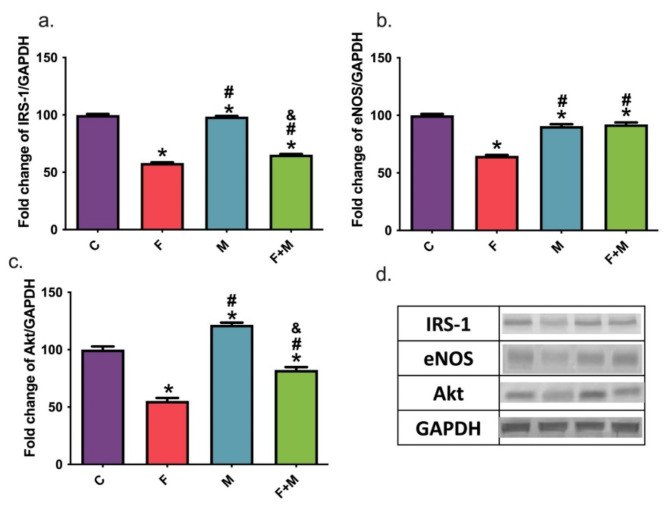
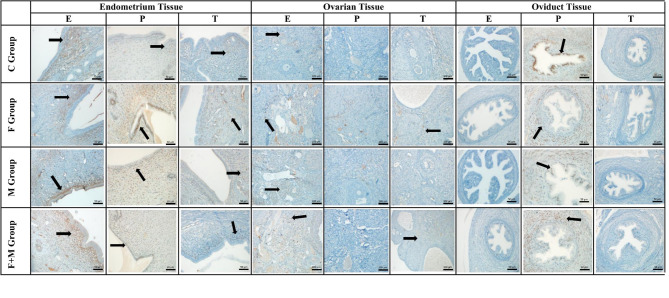
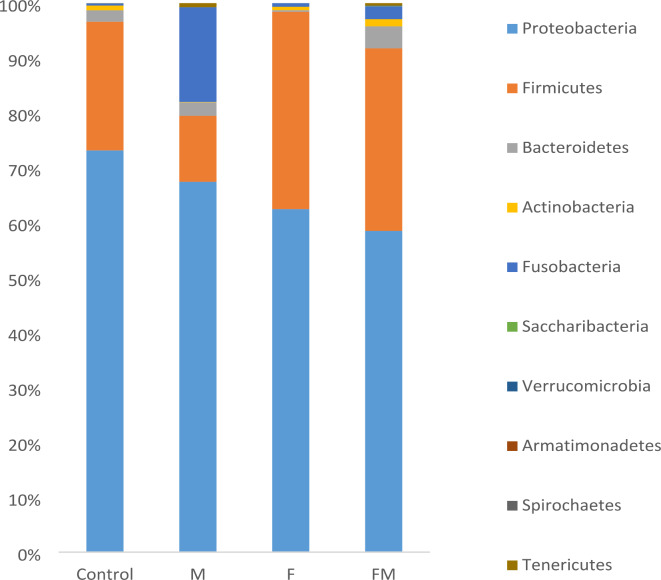
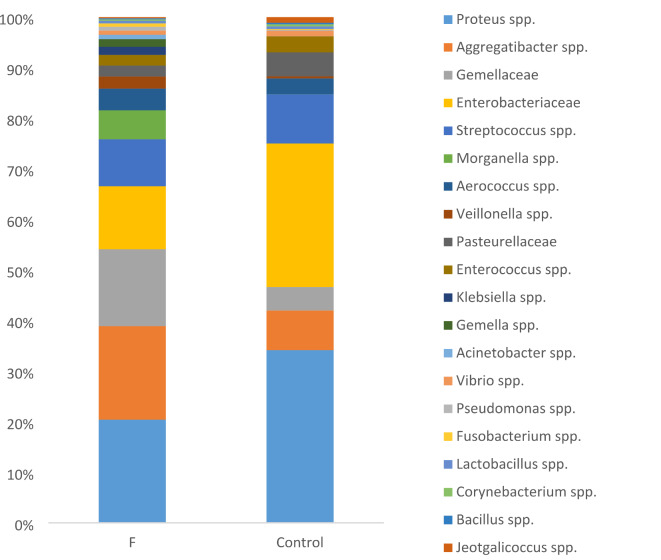
There are limited data on the effects of a high-fructose diet on the female reproductive system. Although metformin has some functional effects on female fertility, its reproductive outcome on high fructose diet-induced metabolic syndrome is unclear. The aim of the present study is to evaluate the impact of a high fructose diet on histomorphological and molecular parameters of the reproductive organs and vaginal microbiota as well as the treatment potential of metformin. Wistar albino rats were used in the study. The metabolic syndrome model was induced by a high-fructose diet in rats for 15 weeks. Metformin was orally administered once a day for the last 6 weeks. The high-fructose diet increased blood glucose, triglycerides, insulin, and ovarian testosterone levels; however, it reduced ovarian aromatase levels and follicle numbers and caused uterine inflammation. The high-fructose diet-induced molecular abnormalities on ovarian tissue were demonstrated by the downregulation of ovarian insulin signaling pathway proteins and dysregulation of ovarian mitogenic and apoptotic pathway proteins. A high-fructose diet caused vaginal dysbiosis, metformin increased probiotic bacteria in the vaginal microbiota. Our results revealed that metformin improves ovarian impairments by modulating hormonal balance, insulin level, mapk, and apoptotic signaling molecules, as well as regulating the vaginal microbiota.

Keywords: High-fructose diet; Metformin; Ovarian tissue; Signaling pathways; Vaginal microbiota.


Conflict of interest statement

Competing interests The authors declare no competing interests.

Figures

Fig. 1
Fig. 1
Flow chart of the experimental procedure (Created with BioRender.com).
Fig. 2
Fig. 2
Body weight changes of rats before and after the experimental procedure. C: Control; F: Fructose; M: Metformin; F + M: Fructose + Metformin. *p < 0.05, significantly different from C and M groups; # p < 0.05, significantly different from F + M group.
Fig. 3
Fig. 3
The serum levels of (a) glucose, (b) insulin, (c) triglyceride, (d) total cholesterol, (e) high-density lipoprotein, and (f) low-density lipoprotein. Each bar represents at least six rats. C: Control; F: Fructose; M: Metformin; F + M: Fructose + Metformin. *p < 0.05, significantly different from C group; # p < 0.05, significantly different from F group.
Fig. 4
Fig. 4
The serum levels of (a) testosterone, (b) aromatase, (c) estrogen, (d) inhibin, and (e) progesterone. Each bar represents at least six rats. C: Control; F: Fructose; M: Metformin; F + M: Fructose + Metformin.
Fig. 5
Fig. 5
The levels of (a) testosterone, (b) aromatase, (c) estrogen, (d) inhibin, and (e) progesterone in ovarian tissue. Each bar represents at least six rats. C: Control; F: Fructose; M: Metformin; F + M: Fructose + Metformin. *p < 0.05, significantly different from C group; # p < 0.05, significantly different from F group; &p < 0.05, significantly different from M group.
Fig. 6
Fig. 6
The protein expression levels of (a) insulin receptor substrate (IRS-1), (b) endothelial nitric oxide synthase (eNOS), (c) protein kinase B (Akt), (d) representative Western blot images of proteins. Each bar represents at least six rats. C: Control; F: Fructose; M: Metformin; F + M: Fructose + Metformin. *p < 0.05, significantly different from C group; # p < 0.05, significantly different from F group; &p < 0.05, significantly different from M group.
Fig. 7
Fig. 7
The mRNA expression levels of (a) irs-1, (b) enos, (c) akt. Each bar represents at least six rats. C: Control; F: Fructose; M: Metformin; F + M: Fructose + Metformin. *p < 0.05, significantly different from C group; # p < 0.05, significantly different from F group; &p < 0.05, significantly different from M group.
Fig. 8
Fig. 8
The mRNA expression levels of (a) mapk, (b) erk 1–2, (c) jnk, (d) bax, (e) bcl-2, (f) caspase-3. Each bar represents at least six rats. C: Control; F: Fructose; M: Metformin; F + M: Fructose + Metformin. *p < 0.05, significantly different from C group; # p < 0.05, significantly different from F group; &p < 0.05, significantly different from M group.
Fig. 9
Fig. 9
Histopathological images from ovarian, oviduct, and uterine tissues in all groups. C Group: Normal appearance of ovarian, oviduct, and uterine tissues; F Group: Multiple ovarian cysts (star), severe hydropic degeneration and edema in the oviduct (arrowhead), epithelial inflammatory cell infiltration in the uterine tissue (arrow); M Group: Normal appearance of ovarian, oviduct, and uterine tissues; F + M Group: Ovarian cysts (star), hydropic degeneration and edema in the oviduct (arrowhead), cell infiltration in the uterine tissue (arrow); C: Control; F: Fructose; M: Metformin; F + M: Fructose + Metformin. Ovarian tissue HE100 µm; Oviduct tissue HE50 µm, Uterine tissue HE100 µm.
Fig. 10
Fig. 10
Immunohistochemical analysis of estrogen, progesterone, and testosterone receptors (arrow) of endometrium, ovarian, and oviduct tissues in all groups. C: Control; F: Fructose; M: Metformin; F + M: Fructose + Metformin. Endometrium tissue immunohistochemistry 50 μm; Ovarian tissue immunohistochemistry 100 μm; Oviduct tissue immunohistochemistry 50 μm.
Fig. 11
Fig. 11
A scatterplot of the first 2 PCs was calculated for the microbiota composition of the samples.
Fig. 12
Fig. 12
Relative abundances of the ten most prevalent bacterial phyla in all treatment groups.
Fig. 13
Fig. 13
Relative abundances of the twenty most prevalent bacterial genera in the F group compared to the C group.
Fig. 14
Fig. 14
Relative abundances of the twenty most prevalent bacterial genera in the M group compared to the C group.
Fig. 15
Fig. 15
Relative abundances of the twenty most prevalent bacterial genera in the FM group compared to the C group.
Fig. 16
Fig. 16
Relative abundances of the twenty most prevalent bacterial genera in the F group compared to the F + M group.

References

    1. Fahed, G. et al. Metabolic syndrome: updates on pathophysiology and management in 2021. Int. J. Mol. Sci.23, 786 (2022). - PMC - PubMed
    1. Hayden, M. R. Overview and New insights into the metabolic syndrome: risk factors and emerging variables in the development of type 2 diabetes and Cerebrocardiovascular Disease. Med. (Lithuania)59, 561 (2023). - PMC - PubMed
    1. Akar, F., Sumlu, E., Alçığır, M. E., Bostancı, A. & Sadi, G. Potential mechanistic pathways underlying intestinal and hepatic effects of kefir in high-fructose-fed rats. Food Res. Int.143, 110287 (2021). - PubMed
    1. Sumlu, E., Bostancı, A., Sadi, G., Alçığır, M. E. & Akar, F. Lactobacillus plantarum improves lipogenesis and IRS-1/AKT/eNOS signalling pathway in the liver of high-fructose-fed rats. Arch. Physiol. Biochem.128, 786–794 (2022). - PubMed
    1. Lubawy, M. & Formanowicz, D. High-fructose Diet-Induced Hyperuricemia accompanying metabolic syndrome-mechanisms and dietary therapy proposals. Int. J. Environ. Res. Public Health20, 3596 (2023). - PMC - PubMed

LinkOut - more resources