. 2024 Nov 11;14(1):27483.
doi: 10.1038/s41598-024-78861-x.

A deep learning-based method for assessing tricuspid regurgitation using continuous wave Doppler spectra

Affiliations

A deep learning-based method for assessing tricuspid regurgitation using continuous wave Doppler spectra

Shenghua Xie et al. Sci Rep. .

Abstract

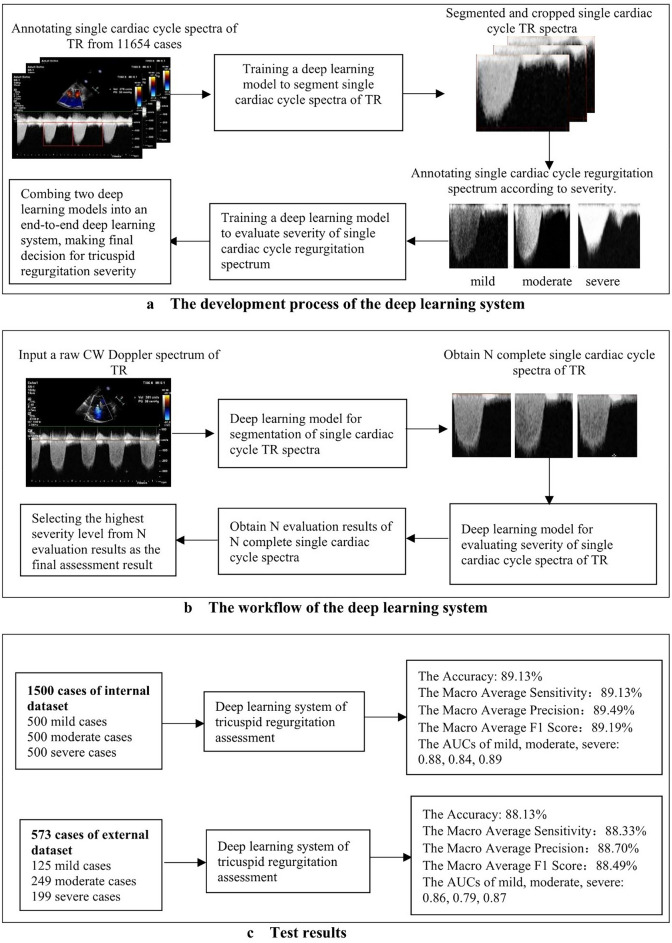
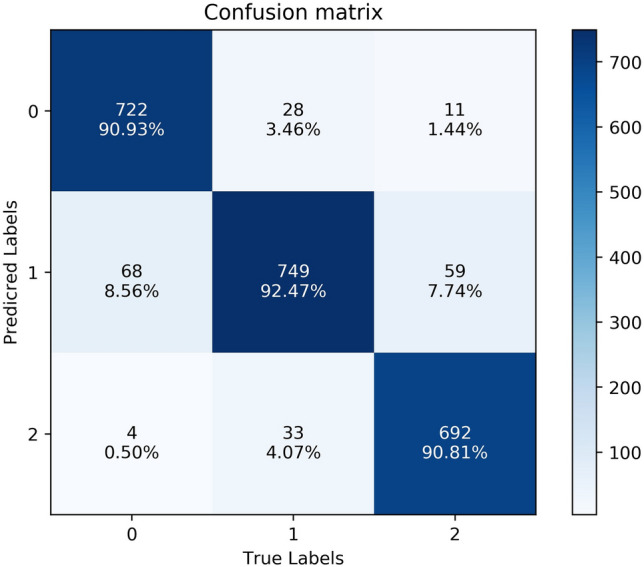
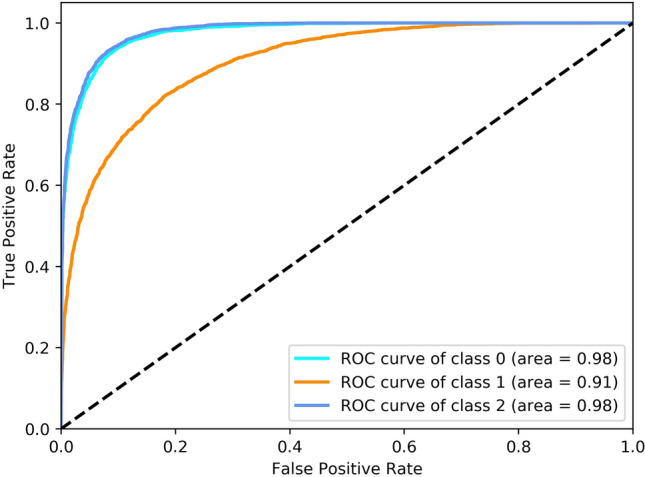
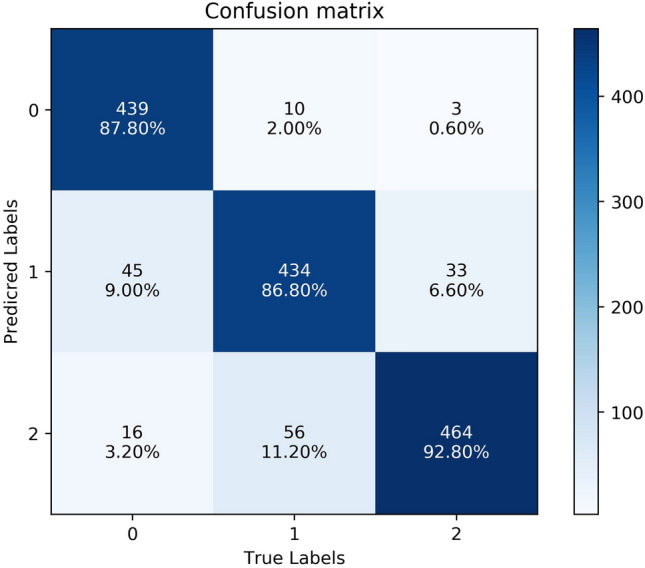
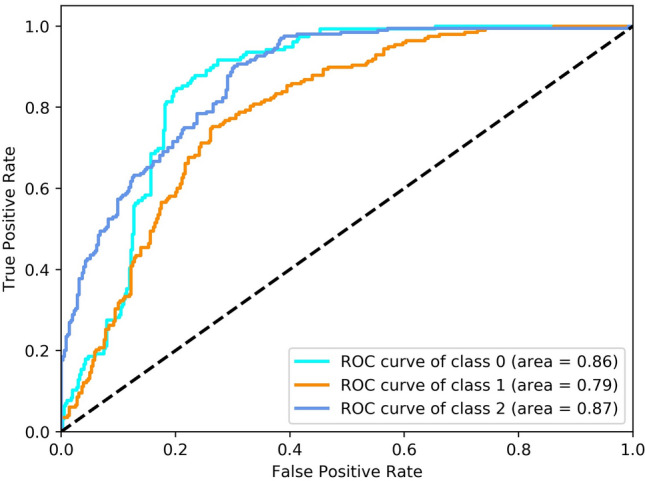
Transthoracic echocardiography (TTE) is widely recognized as one of the principal modalities for diagnosing tricuspid regurgitation (TR). The diagnostic procedures associated with conventional methods are intricate and labor-intensive, with human errors leading to measurement variability, with outcomes critically dependent on the operators' diagnostic expertise. In this study, we present an innovative assessment methodology for evaluating TR severity utilizing an end-to-end deep learning system. This deep learning system comprises a segmentation model of single cardiac cycle TR continuous wave (CW) Doppler spectra and a classification model of the spectra, trained on the TR CW Doppler spectra from a cohort of 11,654 patients. The efficacy of this intelligent assessment methodology was validated on 1500 internal cases and 573 external cases. The receiver operating characteristic (ROC) curves of the internal validation results indicate that the deep learning system achieved the areas under curve (AUCs) of 0.88, 0.84, and 0.89 for mild, moderate, and severe TR, respectively. The ROC curves of the external validation results demonstrate that the system attained the AUCs of 0.86, 0.79, and 0.87 for mild, moderate, and severe TR, respectively. Our study results confirm the feasibility and efficacy of this novel intelligent assessment method for TR severity.


Conflict of interest statement

Declarations Competing interests The authors declare no competing interests. Statement of ethics Our study is a retrospective study. Our research protocol was reviewed and approved by the Ethics Review Committee of our institution (no. 2023-407). Since the data collected in this study consist of images and diagnostic reports that are routinely stored during echocardiography examinations, the Ethics Committee also approved the waiver of informed consent for this study.

Figures

Fig. 1
Fig. 1
Overview of the development of the deep-learning system, its workflow, and the test results. Subfigure (a) depicts the development process of the deep-learning system, which involves two steps: training a deep learning network to segment the single cardiac cycle regurgitation spectrum, and training another deep learning network to evaluate the severity of the regurgitation spectrum. Subfigure (b) outlines the workflow of the deep-learning system, indicating it as an end-to-end system. Subfigure (c) presents the results of the validation study, incorporating both internal dataset from our hospital and external dataset from seven other hospitals.
Fig. 2
Fig. 2
Confusion matrix of the ConvNeXt model on the test set. The labels "0", "1", and "2" correspond to mild, moderate, and severe regurgitation, respectively. The confusion matrix indicates that the sensitivity for mild, moderate, and severe TR is 90.93%, 92.47%, and 90.81%, respectively. The primary prediction errors occur at adjacent severity levels; for instance, most severe labels incorrectly predicted were classified as moderate, while most mild labels incorrectly predicted were also classified as moderate.
Fig. 3
Fig. 3
ROC curves of the ConvNeXt model on the test set. The class 0 corresponds to mild regurgitation, The class 1 to moderate regurgitation, and the class 2 to severe regurgitation. The ROC curve reveals that the AUCs of the model in distinguishing mild, moderate, and severe single cardiac cycle regurgitation spectra are 0.98, 0.91, and 0.98, respectively. All AUCs exceed 0.9, demonstrating the model’s efficacy in accurately identifying single cardiac cycle regurgitation spectra.
Fig. 4
Fig. 4
Confusion matrix of the learning system on the internal dataset. The labels "0," "1," and "2" denote mild, moderate, and severe regurgitation, respectively. The confusion matrix illustrates the concordance between the TR severity predicted by the deep learning system and the clinical diagnostic results in the internal test dataset. The sensitivity for clinically diagnosed mild, moderate, and severe TR are 87.80%, 86.80%, and 92.80%, respectively. The main prediction errors primarily occur at adjacent severity levels.
Fig. 5
Fig. 5
ROC curves of the deep learning system on the internal dataset. The class 0 denotes mild regurgitation, the class 1 denotes moderate regurgitation, and the class 2 denotes severe regurgitation. The ROC curves indicates that the AUCs for the deep learning system in predicting mild, moderate, and severe regurgitation in the internal dataset are 0.88, 0.84, and 0.89, respectively. All AUCs exceed 0.8, underscoring the system’s efficacy in internal validation experiments.
Fig. 6
Fig. 6
Confusion matrix of the deep learning system on the external dataset. The labels "0", "1", and "2" correspond to mild, moderate, and severe regurgitation, respectively. The confusion matrix demonstrates the consistency between the predicted TR severity of the external dataset by the deep learning system and the clinical diagnostic severity. The sensitivity for mild, moderate, and severe TR diagnosed clinically is 88.00%, 85.54%, and 91.46%, respectively. The main prediction errors primarily occur at adjacent severity levels.
Fig. 7
Fig. 7
ROC curves of deep learning system on the external dataset. The class 0 denotes mild regurgitation, the class 1 denotes moderate regurgitation, and the class 2 denotes severe regurgitation. The ROC curves indicates that the AUCs for the deep learning system in predicting mild, moderate, and severe regurgitation within the external dataset are 0.86, 0.79, and 0.87, respectively. Except for the AUC of 0.79 for moderate regurgitation, which is close to 0.8, the AUCs for the other two categories exceed 0.8. This further corroborates the system’s efficacy in external validation experiments.

References

    1. Singh, J. P. et al. Prevalence and clinical determinants of mitral, tricuspid, and aortic regurgitation (the Framingham heart study). Am. J. Cardiol.83(6), 897–902 (1999). - PubMed
    1. Nkomo, V. T. et al. Burden of valvular heart diseases: A population-based study. Lancet.368(9540), 1005–1011 (2006). - PubMed
    1. Dong, N. et al. Advances in the treatment of heart valve disease. J. Clin. Cardiol.38(6), 429–432 (2022).
    1. Muraru, D. et al. Comprehensive tricuspid valve evaluation by echocardiography in the era of transcatheter therapies: A standardized approach according to the TRAIPTA study group. J. Am. Soc. Echocardiogr.33(4), 479–501. 10.1016/j.echo.2019.12.002 (2020).
    1. Baumgartner, H. et al. Echocardiographic assessment of valve stenosis: EAE/ASE recommendations for clinical practice. J. Am. Soc. Echocardiogr.22(1), 1–23 (2009). - PubMed

LinkOut - more resources