. 2024 Nov 11;14(1):27477.
doi: 10.1038/s41598-024-77389-4.

m5C related-regulator-mediated methylation modification patterns and prognostic significance in breast cancer

Affiliations

m5C related-regulator-mediated methylation modification patterns and prognostic significance in breast cancer

Zhe Wang et al. Sci Rep. .

Abstract

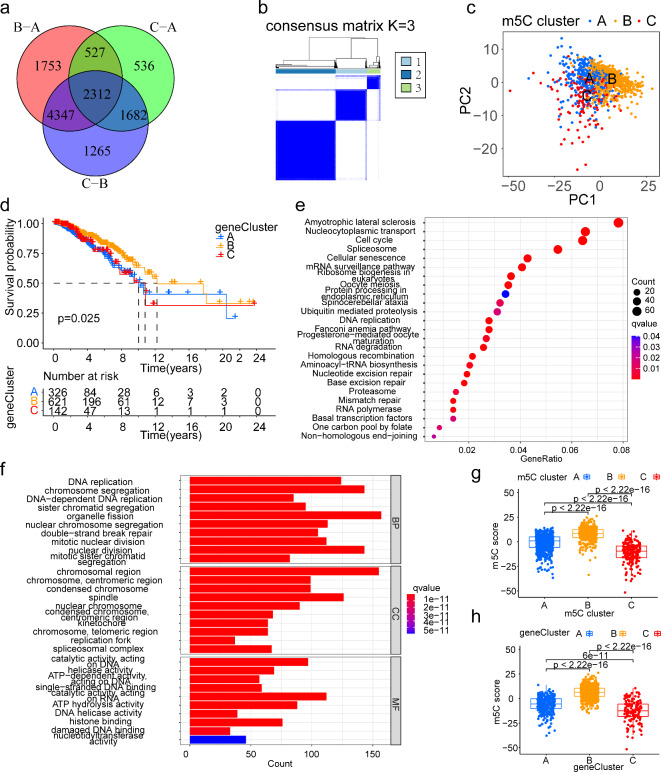
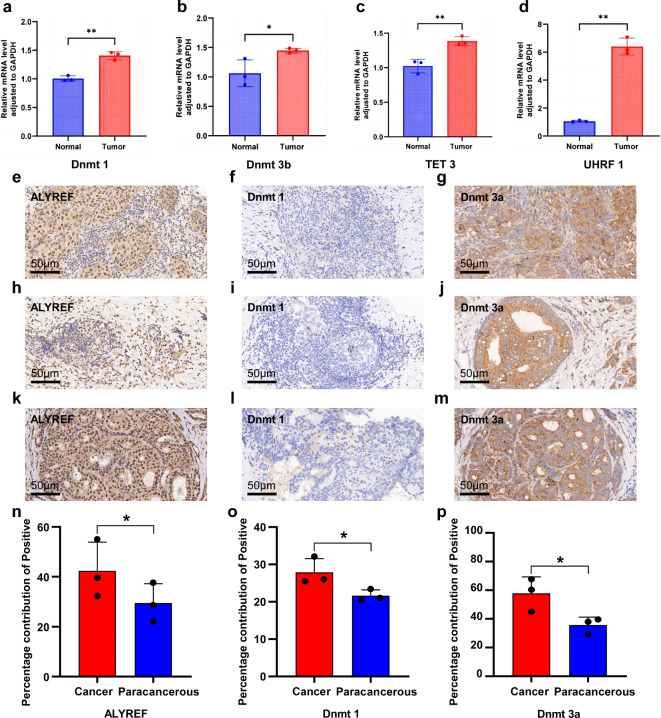
5-Methylcytosine (m5C) is closely associated with cancer. However, the role of m5C in breast cancer(BC)remains unclear. This study combined single-cell RNA sequencing (scRNA-Seq) and transcriptomics datasets to screen m5C regulators associated with BC progression and analyze their clinical values. Firstly, This study elucidates the mechanisms of the m5C landscape and the specific roles of m5C regulators in BC patients. we found that the dysregulation of m5C regulators with m5Cscore play the essential role of the carcinogenesis and progression in epithelial cells and myeloid cells of BC at single cell level. External validation was conducted using an independent scRNA-Seq datasets. Then, three distinct m5C modification patterns were identified by transcriptomics datasets. Based on the m5C differentially expressed regulators, the m5Cscore was constructed, and used to divide patients with BC into high and low m5Cscore groups. Patients with a high m5Cscore had more abundant immune cell infiltration, stronger antitumor immunity, and better prognoses. Finally, Quantitative real-time (PCR) and immunohistochemistry were used for the in vitro experimental validation, which had extensive prognostic value. In this study, we aimed to assess the expression of m5C regulators involved in BC and investigate their correlation with the tumor microenvironment, clinicopathological characteristics, and prognosis of BC. The m5C regulators could be used to effectively assess the cell specific regulation prognosis of patients with BC and develop more effective immunotherapy strategies.

Keywords: Breast cancer; Cell specific regulation; Epigenetics; Immunotherapy; m5C RNA modification.


Conflict of interest statement

Declarations Ethics approval and consent to participate The studies involving human participants were reviewed and approved by Ethics Committee of the First Hospital of Shanxi Medical University, the ethics number is K-K0109. The patients provided their written informed consent to participate in this study. Consent for publication The patients involved have obtained ethical approval and written informed consent for the publication of any potentially identifiable images or data included in this article. Competing interests The authors declare no competing interests. Statement All methods were performed in accordance with the relevant guidelines and regulations.

Figures

Fig. 1
Fig. 1
Single-cell transcriptomic landscape of m5C regulators regulating breast tissue key pathways in breast cancer (BC). (a) T-Distributed Stochastic Neighbor Embedding (TSNE) plot of normal cells and BC cells, colored by cell type. (b) Heatmap for differences in the expression of m5C regulators in different cell types between normal and BC samples. Red, up-regulation; blue, down-regulation. (c) Heatmap of each m5C regulators expression in each cell type. (d) Differential expression of genes (DEGs) in different cell types of BC patients compared with control samples. Red, up-regulation; blue, down-regulation. (e) Dot plot showing DEGs expression patterns of m5C regulators of each cell types. Each dot represents a regulator, of which the color saturation indicates the average expression level, and the size indicates the percentage of cells expressing the regulator. (f) Kaplan-Meier survival analysis based on m5C regulator expression. Red, high expression of m5C regulator; blue, low expression of m5C regulator. (g) Analysis of m5Cscore for 5 cell types. The two T-SNE plots of m5C regulators expression in BC samples. (h) ALYREF. (i) DNMT1.
Fig. 2
Fig. 2
Regulation of tumor-related pathways by the m5C regulators. (a) Correlation analysis was used to analyze the association between the m5C regulators and tumor related pathways. Red, positive correlation; blue, negative correlation. (bd) Differences in m5C signature between tumor and normal groups in different cell types, including endothelial cells (En), epithelial cells (Ep), and myeloid cells (mye). (e) Networks of WGCNA module which included ALYREF in myeloid cells. (f) Functional enrichment of module which included ALYREF in myeloid cells. (g) Networks of WGCNA module which included DNMT1 in myeloid cells. (h) Functional enrichment of module which included DNMT1 in myeloid cells. (i) UMAP plots showing the expression of different cell types in other BC tissues. (j) Proportion of m5C regulators expression in different cell types. (k) Analysis of m5C score for several cell types. (l) Networks of WGCNA module which included ALYREF in myeloid cells. (m) Functional enrichment of module which included ALYREF in myeloid cells. (n) Networks of WGCNA module which included DNMT1 in myeloid cells. (o) Functional enrichment of module which included DNMT1 in myeloid cells.
Fig. 3
Fig. 3
Evaluation of m5C methylation modification patterns. (a) Differential expression of m5C regulators between breast cancer and normal breast tissues. Blue, normal tissue; red, tumor tissue. The lines in the boxes represent the median value, the bottoms and tops of the boxes represent the interquartile range, and the dots represent outliers. ***P < 0.001, **P < 0.01, *P < 0.05. Differences among the three modification patterns were tested by one-way ANOVA. (b) The interaction between m5C regulators in breast cancer. The lines connecting the m5C regulators represent the interaction between them. Blue, negative correlation; red, positive correlation. (c) Three different m5C modification subtypes were identified by unsupervised clustering based on m5C regulators (m5C cluster A, B, and C). (d) PCA derived from the m5C clusters showed a difference between the three clusters. Blue, m5C gene cluster A; yellow, m5C gene cluster B; and red, m5C gene cluster C. (e) Survival analysis based on the three m5C clusters in 1089 patients with breast cancer in the TCGA-BRCA cohort (P = 0.015, log-rank test). Blue, 567 patients in m5C cluster A; yellow, 334 patients in m5C cluster B; and red, 188 patients in m5C cluster C. (f) Unsupervised clustering of 17 m5C regulators in the TCGA-BRCA cohort identified a significant difference in the expression of regulators among the three modification patterns. The m5C clusters, TCGA project, age, sex, TNM classification, clinical stage, and survival status were used as patient annotations. Red, high expression of regulators; blue, low expression of regulators. (gi) GSVA enrichment analysis showing the activation states of biological pathways in distinct m5C modification patterns. Red, activated pathways; blue, inhibited pathways. (g) m5C cluster A compared with m5C cluster B; (h) m5C cluster A compared with m5C cluster C; (i) m5C cluster B compared with m5C cluster C.
Fig. 4
Fig. 4
Construction of m5C gene signatures and functional annotation. (a) Overlapping m5C phenotype-related DEGs in the three m5C clusters. (b) Three different genomic subtypes identified by unsupervised clustering based on the overlapping m5C phenotype-related DEGs. (c) PCA derived from the three m5C gene clusters showed a difference between gene clusters. Blue, m5C gene cluster A; yellow, m5C gene cluster B; and red, m5C gene cluster C. (d) Survival analysis based on the three m5C gene clusters in 1089 patients from the TCGA-BRCA cohort (P = 0.025, log-rank test). Blue, 326 patients with m5C gene cluster A; yellow, 621 patients with m5C gene cluster B; and red, 142 patients with m5C gene cluster C. (e) GO functional enrichment analysis of 2312 overlapping m5C phenotype-related DEGs. (f) KEGG pathway enrichment analysis of 2312 overlapping m5C phenotype-related DEGs. (g) Differences in the m5Cscore among the three m5C clusters in the TCGA-BRCA cohort (P < 0.001, Kruskal–Wallis test). Blue, m5C cluster A; yellow, m5C cluster B; and red, m5C cluster C. (h) Differences in the m5Cscore among the three m5C gene clusters in the TCGA-BRCA cohort (P < 0.001, Kruskal–Wallis test). Blue, m5C gene cluster A; yellow, m5C gene cluster B; and red, m5C gene cluster C.
Fig. 5
Fig. 5
Association between the m5Cscore and response to pharmacotherapy. (a) The relative distribution of TIDE scores was compared between the low and high m5Cscore groups. The lines in the boxes represent the median value, the bottoms and tops of the boxes represent the interquartile range, and the dots represent outliers. Blue, low m5Cscore group; red, high m5Cscore group. (b) Survival analysis for 858 patients with a high TIDE score and 231 with a low TIDE score (P < 0.05, log-rank test). (c) Survival curves of TIDE scores combined with m5C scores (P < 0.05, log-rank test). (d) Comparisons of the proportions of non-responders and responders to ICB between the low and high m5Cscore groups; the ROC curves of the TIDE score model in patients with BC (AUC: 0.846, 95% CI: 0.801–0.888). Blue, non-responder groups; red, responder groups. (e) Relative distribution of immune dysfunction scores between the low and high m5Cscore groups (P < 0.001). Blue, low m5Cscore group; red, high m5Cscore group. (f) Survival analysis stratified by both m5Cscore and immune dysfunction scores (P = 0.001, log-rank test). (g) survival analysis for 977 patients with a high immune exclusion and 112 with a low immune exclusion (P < 0.05, log-rank test). (h) Survival analyses stratified by both the m5Cscore and immune exclusion (P < 0.001, log-rank test). (it) Predicted response of patients to six chemotherapeutic drugs based on the m5Cscore. (I, j) bortezomib; (k, l) erlotinib; (m, n) roscovitine; (o, p) salubrinal; (q, r) sorafenib; (s, t) vinorelbine. Blue, low m5Cscore group; red, high m5Cscore group.
Fig. 6
Fig. 6
Correlation between clinicopathological characteristics and the m5Cscore. (a) m5Cscore based on survival status (P < 0.001). The lines in the boxes represent the median value, the bottoms and tops of the boxes represent the interquartile range, and the dots represent outliers. Blue, living patients; red, deceased patients. (b) The proportions of living and dead patients with BC in the low and high m5Cscore groups. In the low m5Cscore group, 82% of patients were alive and 18% were dead, and in the high m5Cscore group, 90% of patients were alive and 10% were dead. Blue, living patients; red, deceased patients. (c) The m5Cscore based on N stage. The Kruskal–Wallis test was used to compare the statistical difference between five N stage groups. The lines in the boxes represent the median value, the bottoms and tops of the boxes represent the interquartile range, and the dots represent outliers. Blue, N0 stage group; red, N1 stage group; yellow, N2 stage group; purple, N3 stage group; green, Nx stage group. (d) HER2 expression status in the low and high m5Cscore groups. In the low m5Cscore group, 81% and 19% of patients had HER2 + and HER2- disease, respectively; in the high m5Cscore group, 87% and 13% of patients had HER2+ and HER2− disease, respectively. Blue, patients with HER2− disease; red, patients with HER2+ disease. (e) Sankey diagram showing the flow of m5C cluster, m5C gene cluster, m5Cscore, and survival status. (f) Sankey diagram showing the flow of m5C cluster, m5C gene cluster, m5Cscore, and age. (gl) Kaplan–Meier survival analysis based on the m5Cscore in subgroups with different clinical characteristics. Red, high m5Cscore group; blue, low m5Cscore group. (g) patients ≤ 65 years; (h) patients with T2 stage; (i) patients with stage III disease; (j) patients with N1 disease; (k) patients with M0 disease; (l) Women.
Fig. 7
Fig. 7
The expression of m5C-related genes was verified using RT-qPCR and IHC. (ad) Differential expression of m5C-related genes in normal and tumor groups. (em) IHC of the ALYREF, DNMT1 and DNMT3a in tumor tissue. (np) Percentage of positive staining for m5C-related genes between the paracancerous and tumor groups.

Similar articles

References

    1. Sung, H. et al. Global Cancer statistics 2020: GLOBOCAN estimates of incidence and Mortality Worldwide for 36 cancers in 185 countries. CA Cancer J. Clin.71, 209–249. 10.3322/caac.21660 (2021). - PubMed
    1. Giaquinto, A. N. et al. Breast Cancer Statistics, 2022. CA Cancer J. Clin.72, 524–541. 10.3322/caac.21754 (2022). - PubMed
    1. Kudelova, E. et al. Genetic Heterogeneity, Tumor Microenvironment and Immunotherapy in Triple-Negative Breast Cancer. Int. J. Mol. Sci.23 (23), 14937. 10.3390/ijms232314937 (2022). - PMC - PubMed
    1. Wen, Q. E. et al. Recent Advances in Immunotherapy for Breast Cancer: A Review. Breast Cancer (Dove Med. Press). 16, 497–516. 10.2147/BCTT.S482504 (2024). - PMC - PubMed
    1. Trixl, L. & Lusser, A. The dynamic RNA modification 5-methylcytosine and its emerging role as an epitranscriptomic mark. Wiley Interdiscip Rev. RNA. 10, e1510. 10.1002/wrna.1510 (2019). - PMC - PubMed

LinkOut - more resources