. 2024 Nov 10;15(1):9732.
doi: 10.1038/s41467-024-54112-5.

Multiomics dissection of Brassica napus L. lateral roots and endophytes interactions under phosphorus starvation

Affiliations

Multiomics dissection of Brassica napus L. lateral roots and endophytes interactions under phosphorus starvation

Can Liu et al. Nat Commun. .

Abstract

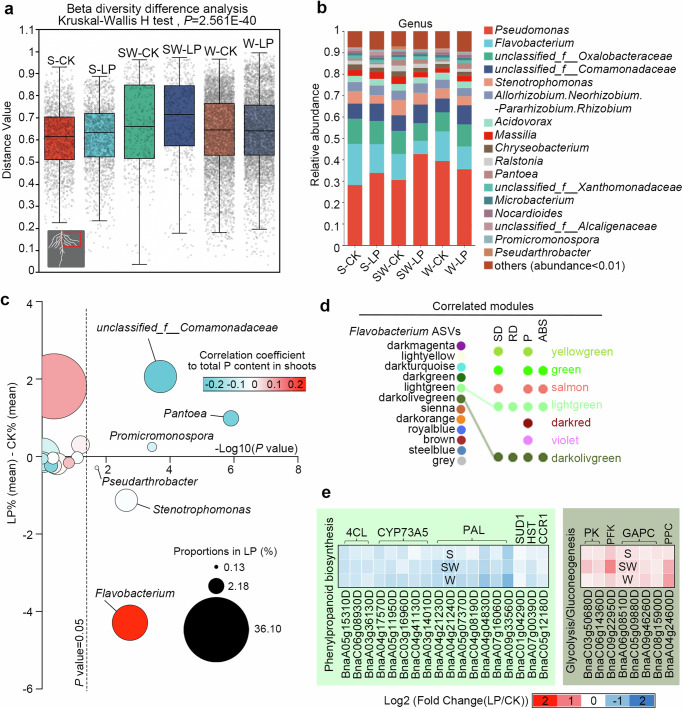
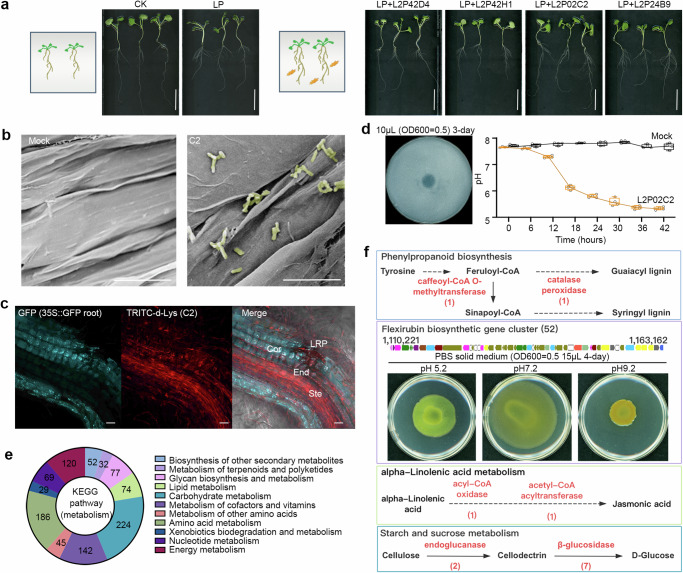
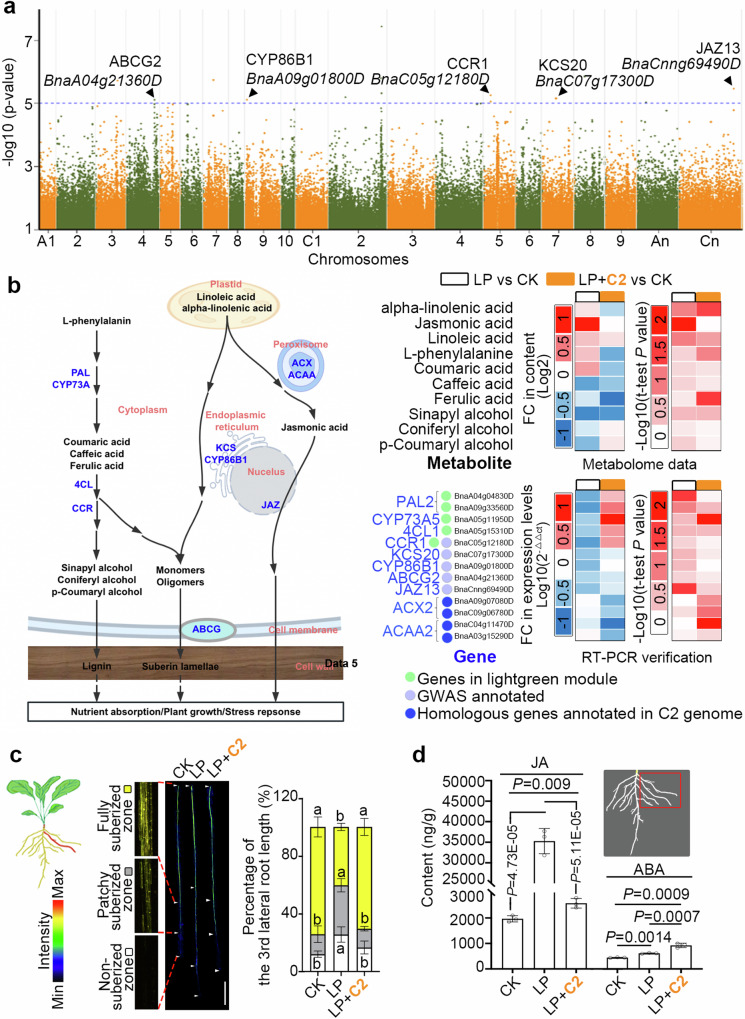
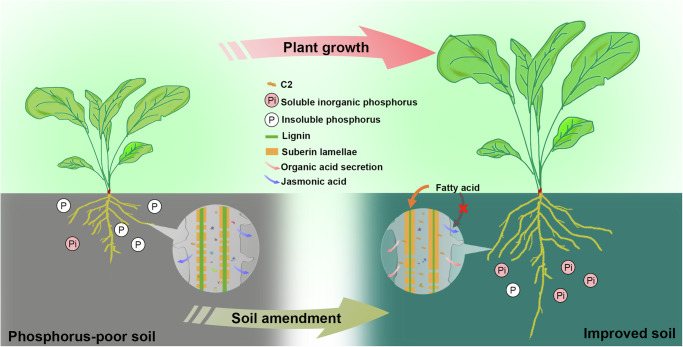
Many plants associate with endophytic microbes that improve root phosphorus (P) uptake. Understanding the interactions between roots and endophytes can enable efforts to improve P utilization. Here, we characterize the interactions between lateral roots of endophytes in a core collection of 50 rapeseed (Brassica napus L.) genotypes with differing sensitivities to low P conditions. With the correlation analysis result between bacterial abundance and plant physiological indices of rapeseeds, and inoculation experiments on plates and soil, we identify one Flavobacterium strain (C2) that significantly alleviates the P deficiency phenotype of rapeseeds. The underlying mechanisms are explored by performing the weighted gene coexpression network analysis (WGCNA), and conducting genome-wide association studies (GWAS) using Flavobacterium abundance as a quantitative trait. Under P-limited conditions, C2 regulates fatty acid and lipid metabolic pathways. For example, C2 improves metabolism of linoleic acid, which mediates root suberin biosynthesis, and enhances P uptake efficiency. In addition, C2 suppresses root jasmonic acid biosynthesis, which depends on α-linolenic acid metabolism, improving C2 colonization and activating P uptake. This study demonstrates that adjusting the endophyte composition can modulate P uptake in B. napus plants, providing a basis for developing agricultural microbial agents.


Conflict of interest statement

Competing interests The authors declare no competing interests.

Figures

Fig. 1
Fig. 1. Identification of the DEGs associated with phosphorus (P) deficiency.
a Multiple dataset integration analysis of the roots of Brassica napus L. This figure was created with https://www.processon.com. b Box diagram of shoot dry weight (SD), root dry weight (RD), total phosphorus content (P) and absorption rate of P from soil to shoot (ABS) of three ecotypes under normal and P deficiency conditions. Spring type (S); semiwinter type (SW); winter type (W). Normal control (CK) and P deficiency (LP) groups. A total of 50 cultivars were studied, with 3–4 biological replicates for each cultivar in the CK group (totaling 200 samples) or the LP group (totaling 199 samples). The boxplot displays the median at the center, with the bounds of the box representing the lower quartile (Q1) and upper quartile (Q3). The ends of the whiskers indicate the minimum and maximum values. P-values were derived with two-tailed Student’s t-test. Source data are provided in the Supplementary Data 1. c PCA plot of the first two components (PC1 and PC2) of the 399 samples based on the differentially expressed genes (DEGs, log2 (relative expression level) ≥ 1 and ≤ −1). The red box at the bottom right indicates the sampled lateral root sampled for RNA-Seq analysis. d Gene ontology (GO) term enrichment analysis of the DEGs in three ecotypes associated with P limitation (left), and heatmap representation of the expression of core DEGs related to the P starvation response and P transport (right). In GO enrichment analysis, Fisher’s two-tailed test is first conducted, followed by the use of the BH method for multiple testing correction. Source data are provided as a Source Data file. e Analysis of module–trait correlations. The involved phenotypes were SD, RD, P and ABS from the outside to the inside. Pearson’s correlation coefficient (r) was calculated to evaluate the relationship between the variables, and a two-tailed t-test was conducted to obtain the corresponding P-value. f, GO term enrichment analysis for genes in the violet, dark red, green, salmon, light green, dark olive green, or yellow green modules. Fisher’s two-tailed test is first conducted, followed by the use of the BH method for multiple testing correction. The color of the graph corresponds to the color of the module in e. Source data are provided as a Source Data file.
Fig. 2
Fig. 2. Effect of P deficiency on rhizospheric microorganism diversity.
a Beta diversity difference analysis results based on the normalized ASV abundance, with the Kruskal‒Wallis H test. Normal control (CK) and P deficiency (LP) groups. Spring type (S); semiwinter type (SW); winter type (W). The red box at the bottom left indicates the sampled lateral roots. A total of 50 cultivars were studied, with 3–4 biological replicates for each cultivar in the CK group (totaling 200 samples) or the LP group (totaling 199 samples). Boxplot center: median; box boundaries: lower quartile (Q1) and upper quartile (Q3); minimum: Q1-1.5 × (Q3-Q1); maximum: Q3 + 1.5 × (Q3-Q1). b Relative abundance of the 17 most abundant bacterial genera in the CK and LP samples (mean values). The genera with < 1% relative abundance (expressed as the sum of the ASVs across the 399 samples) were classified as “others” (comprising 1360 genera, accounting for 8.2% of all ASVs). Source data are provided as a Source Data file. c Correlation analysis of bacterial families as a function of P content in shoots. The plot shows bacterial families with ≥ 1% relative abundance (17 genera). A two-sided Wilcoxon rank sum test was used for statistical significance and corrected for multiple testing with a FDR, bootstrap = 0.95. The average proportions in LP samples are indicated by circle size. The color of circles denotes the correlation coefficient to the total P content in the shoots. The black dotted line represents the threshold for a P-value of 0.05. Source data are provided as a Source Data file. d Identification of modules associated with both Flavobacterium abundance and four phenotypes (shoot dry weight (SD), lateral root dry weight (RD), phosphorus content (P), and absorption rate (ABS)) based on correlation analysis. e Heatmaps representation of gene expression levels for core DEGs associated with phenylpropanoid biosynthesis and glycolysis processes based on the RNA-seq data. Source data are provided as a Source Data file.
Fig. 3
Fig. 3. Isolation of the core Flavobacterium associated with the phosphorus starvation response.
a Growth status of ZS11 (7 days after germination) on CK, LP, and LP media inoculated with one of four Flavobacterium strains. White bars, 3 cm. b Scanning electron microscopy images of the lateral root surface of ZS11 grown under mock conditions (left) or inoculated with C2 (right). White bars, 10 μm. The experiment was conducted independently four times, yielding similar results in each case. c Colonization patterns of C2 in the roots of ZS11. White bars, 50 μm. Cor, cortex; End, endodermis; Ste, stele; LRP, lateral root primordium. Cyan indicates ZS11 root cells with a GFP signal, and red indicates C2 labeled with TRITC-d-Lys. The experiment was conducted independently three times, yielding similar results in each case. d Phosphorus-solubilizing halo on Pikovskaya’s solid medium of Flavobacterium C2 and the pH trend when cultured in Pikovskaya’s liquid medium. Four biological replicates were employed. The boxplot displays the median at the center, with the bounds of the box representing the lower quartile (Q1) and upper quartile (Q3). The ends of the whiskers indicate the minimum and maximum values. Source data are provided as a Source Data file. e Pie diagram of Flavobacterium C2 based on the KEGG annotated gene numbers related to metabolism. Different colors represent different types of metabolites. f Schematic diagrams of the key compound biosynthesis clusters or metabolic pathway. The color of each square box corresponds to the KEGG pathway in Fig. 3e. Key enzymes annotated in the C2 genome are shown in red, with the number of enzymes in parentheses. The morphology of the strain on PBS solid media with different pH values are shown.
Fig. 4
Fig. 4. Functional identification of Flavobacterium C2.
a Statistical results of the fresh weight of shoots or roots of ZS11 and the other 6 core rapeseeds planted in soils inoculated with or without C2. CK, 625 μM P; LP, 12.5 μM P. P-values were derived with two-tailed Student’s t-test. Five seedlings per genotype and conditions were used. Source data are provided as a Source Data file. b Growth status of 21 day-old ZS11 and R5149 plants planted in soil inoculated with or without C2. White bars, 5 cm. The leaves are shown on the left, and the corresponding root systems are shown on the right. c Growth status of R5149 and ZS11 (7 days after germination) on sterile 1/2 MS medium inoculated (C2) or not (Mock) with C2. White bars, 3 cm (d) PCA plot of the root samples in Fig. 4b based on the differentially abundant metabolites (variable importance in the projection (VIP) > 1.0, FC > 1.2 or FC < 0.833, P-value < 0.05). KEGG enrichment analysis of the differentially abundant metabolites. Fisher’s two-tailed test is first conducted, followed by the use of the BH method for multiple testing correction. The red box at the bottom right indicates the sampled lateral root. Source data are provided as a Source Data file. e Expression verification of core genes (based on the RT‒qPCR results, the expression levels were normalized to that of ACT7) and the changes in the contents of key metabolites (based on the metabolome data) in the soil culture materials in the glycolytic pathway. Key genes are shown in blue. The black letters indicate key metabolites. All data were compared against the samples marked with red dots in the diagram. Three biological replicates were used in these experiments, with 5 plants per biological replicate. Source data are provided as a Source Data file. f Amyloplast staining with Lugol’s solution and number of amyloplasts in ZS11 lateral root tips. Black bars, 50 μm. Eight biological replicates were employed. The boxplot displays the median at the center, with the bounds of the box representing the lower quartile (Q1) and upper quartile (Q3). The ends of the whiskers indicate the minimum and maximum values. P-values were derived with two-tailed Student’s t-test. Source data are provided as a Source Data file.
Fig. 5
Fig. 5. Effect of Flavobacterium C2 on fatty acid metabolism in rapeseed.
a Manhattan plot of the association signal for ASV abundance variation of Flavobacterium in LP relative to CK, based on genome-wide SNPs. The horizontal dashed lines indicates the genome-wide significance thresholds (−log10 (P-value) = 5). P-values for SNPs were calculated using the EMMAX model based on the chi-squared distribution, followed by the application of the Benjamini-Hochberg method to correct for multiple testing. b Heatmap representation of the changes in key metabolite contents (based on the metabolome data) and core gene expression levels (based on RT‒qPCR, normalized to ACT7) in the soil culture materials related to α-linolenic acid metabolism-mediated root jasmonic acid synthesis. Key genes are shown in blue; key metabolites are shown in black; cell structures are shown in red. FC, fold change. P-values were derived from two-tailed Student’s t-test. Three biological replicates were used in these experiments, with 5 plants per biological replicate. Source data are provided as a Source Data file. This figure was created with https://www.processon.com. c The different depositions of suberized zones in the third lateral root of ZS11 in Fig. 3b. White bars=1 cm. The values represent the means ± SDs. Different letters represent significant differences among groups (one-way ANOVA, followed by Duncan’s test, P-value < 0.05). Five plants were used in the experiment. The white arrows mark the beginning and end of each root zone. Source data are provided as a Source Data file. d JA and ABA contents. P-values were derived from a two-tailed Student’s t-test. Three biological replicates were used in these experiments, with 5 plants per biological replicate. The values represent the means ± SDs. The red box at the bottom right indicates the sampled lateral root. Source data are provided as a Source Data file.
Fig. 6
Fig. 6. Proposed model for Flavobacterium C2-mediated plant growth and soil amendment.
Phosphorus-soluble Flavobacterium C2 can effectively alleviate vegetative growth constraints in low-phosphorus environments by affecting the redistribution of lipids in the roots of Brassica napus L.

References

    1. Herrera-Estrella, L. & López-Arredondo, D. Phosphorus: The underrated element for feeding the world. Trends Plant Sci. 21, 461–463 (2016). - PubMed
    1. Plaxton, C. W. & Shane, M. W. Annual Plant Reviews Volume 48: Phosphorus Metabolism in Plants, Vol. 48 (Wiley & Sons, 2015).
    1. Adu, M. O. et al. A scanner-based rhizobox system enabling the quantification of root system development and response of Brassica rapa seedlings to external P availability. Plant Root11, 16–32 (2017).
    1. Vance, C. P., Uhde-Stone, C. & Allan, D. L. Phosphorus acquisition and use: critical adaptations by plants for securing a nonrenewable resource. N. Phytol.157, 423–447 (2010). - PubMed
    1. López-Arredondo, D. L., Leyva-González, M. A., González-Morales, S. I., López-Bucio, J. & Herrera-Estrella, L. Phosphate nutrition: improving low-phosphate tolerance in crops. Annu. Rev. Plant Biol.65, 95–123 (2014). - PubMed

Publication types

LinkOut - more resources