. 2025 Jan;14(1):e2401888.
doi: 10.1002/adhm.202401888. Epub 2024 Nov 10.

Nano Plasma Membrane Vesicle-Lipid Nanoparticle Hybrids for Enhanced Gene Delivery and Expression

Affiliations

Nano Plasma Membrane Vesicle-Lipid Nanoparticle Hybrids for Enhanced Gene Delivery and Expression

Claudio Luca Alter et al. Adv Healthc Mater. 2025 Jan.

Abstract

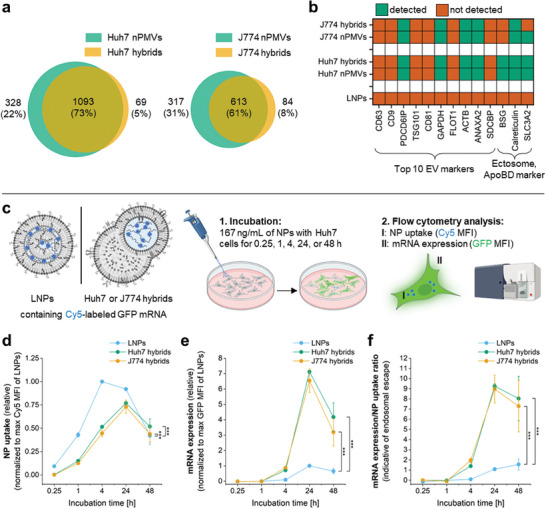
Lipid nanoparticles (LNPs) have emerged as the leading nonviral nucleic acid (NA) delivery system, gaining widespread attention for their use in COVID-19 vaccines. They are recognized for their efficient NA encapsulation, modifiability, and scalable production. However, LNPs face efficacy and potency limitations due to suboptimal intracellular processing, with endosomal escape efficiencies (ESE) below 2.5%. Additionally, up to 70% of NPs undergo recycling and exocytosis after cellular uptake. In contrast, cell-derived vesicles offer biocompatibility and high-delivery efficacy but are challenging to load with exogenous NAs and to manufacture at large-scale. To leverage the strengths of both systems, a hybrid system is designed by combining cell-derived vesicles, such as nano plasma membrane vesicles (nPMVs), with LNPs through microfluidic mixing and subsequent dialysis. These hybrids demonstrate up to tenfold increase in ESE and an 18-fold rise in reporter gene expression in vitro and in vivo in zebrafish larvae (ZFL) and mice, compared to traditional LNPs. These improvements are linked to their unique physico-chemical properties, composition, and morphology. By incorporating cell-derived vesicles, this strategy streamlines the development process, significantly enhancing the efficacy and potency of gene delivery systems without the need for extensive screening.

Keywords: extracellular vesicles; gene delivery; gene therapy; hybrid vesicles; lipid nanoparticles.


Conflict of interest statement

The authors declare no conflict of interest.

Figures

Figure 1
Figure 1
Design and characterization of nano plasma membrane vesicle‐lipid nanoparticle hybrids (nPMV‐LNP hybrids). a) Schematic representation of the nanoparticle (NP) production process: An aqueous solution (sodium acetate buffer, pH 4) containing cell‐derived vesicles, such as nano plasma membrane vesicles (nPMVs) derived from Huh7 (human hepatocellular carcinoma) or J774 (mouse reticulum cell sarcoma) cells, and mRNA was mixed with an ethanolic phase comprising a lipid mixture of cationic ionizable lipids (i.e., dilinoleylmethyl‐4‐dimethylaminobutyrate, D‐Lin‐MC3‐DMA; 50 mol%), cholesterol (39 mol%), helper lipids (i.e., 1,2‐dioleoyl‐sn‐glycero‐3‐phosphocholine, DOPC; 10 mol%), and polyethylene glycol‐lipid (i.e., 1,2‐dimyristoyl‐sn‐glycero‐3‐phosphoethanolamine‐N‐[methoxy(polyethylene glycol)‐2000], DMPE‐PEG2k; 1 mol%) using microfluidic mixing (N/P ratio of 6, nPMV protein/mRNA (w/w) ratio of 1.5). Huh7 or J774 hybrids were obtained following dialysis against a physiological buffer (pH 7.4). An nPMV protein/mRNA ratio of 1.5 was identified as the optimal ratio in a series of pilot experiments (Figure S1, Supporting Information). LNPs were produced similarly to hybrids, albeit without cell‐derived vesicles in the aqueous solution. Schematics representing the morphology of Huh7 and J774 hybrids and LNPs were designed based on cryogenic‐transmission electron microscopy observations in e and adapted from Cheng et al.[ 43 ] b) Hydrodynamic diameter (D H), polydispersity index, and surface charge (ζ‐potential) of LNPs and Huh7 and J774 hybrids, as measured by dynamic light scattering. Values are means ± SD, n ≥ 3 experiments. c) D H and D H distribution measurement of LNPs (blue) and Huh7 (green) and J774 (orange) hybrids was analyzed by nanoparticle tracking analysis. Values are means ± SD, n = 3 measurements. Bold line: mean curve. Shaded area: SD. d) Percentage of LNPs (blue), Huh7 hybrids (green), or J774 hybrids (orange) with spherical (solid) and blebbed (hatched) shapes, as observed in cryo‐TEM images in e. e) Cryo‐TEM overview (top row) and zoomed‐in (black square, bottom row) images of LNPs and Huh7 and J774 hybrids, with the measured particle sizes. Orange arrows: mRNA‐loaded blebs (mottled appearance). Blue arrows: aqueous blebs, devoid of mRNA (uniform internal filling). White arrows: spherical, multilamellar LNP‐like structures. The morphology of hybrids is similar to previously observed structures of blebbed mRNA‐LNPs.[ 42 , 43 ] Values are means ± SD, n = 3 preparations with each n ≥ 88 NPs. Scale bar: 100 nm.
Figure 2
Figure 2
Proteomic analysis and in in vitro cellular uptake and mRNA expression of LNPs and Huh7 and J774 hybrids. a) Venn‐diagrams depicting the proteome overlap between Huh7 or J774 nPMVs (green) and the corresponding hybrids (orange). b) Heatmap indicating the presence (green) or absence (red) of a selected group of proteins, including the top 10 EV markers[ 45 ] along with markers previously identified in ectosomes (e.g., BSG, SLC3A2)[ 46 ] and apoptotic bodies (e.g., CALR).[ 35 ] c) LNPs and Huh7 and J774 hybrids containing Cy5‐labeled green fluorescent protein (GFP) mRNA were incubated with Huh7 cells for the indicated time points. Thereafter, flow cytometry was used to simultaneously analyze NP uptake (Cy5 mean fluorescence intensity (MFI), d) and mRNA expression (GFP MFI, e) of these cells. d,e) NP uptake (d) and mRNA expression (e) of LNPs (blue), Huh7 hybrids (green), and J774 hybrids (orange) after the indicated incubation time, as analyzed by flow cytometry. Values have been normalized to the max Cy5 or GFP MFI of LNPs and are presented as means ± SD, n = 3 measurements. f) The ratio of mRNA expression (e) over the NP uptake (d) can be indicative of endosomal escape (ES). Blue: LNPs. Green: Huh7 hybrids. Orange: J774 hybrids. Values are means ± SD, n = 3 measurements. Levels of significance: *: p ≤ 0.05, **: p ≤ 0.01, and ***: p ≤ 0.001.
Figure 3
Figure 3
Uptake, endosomal escape efficiency (ESE), and mRNA expression of LNPs and hybrids in vitro. a) In this experimental approach, LNPs, Huh7 hybrids, or J774 hybrids encapsulating Cy5‐labeled mCherry mRNA were incubated at a concentration of 167 ng mL−1 with Huh7 cells that stably express Galectin‐3‐GFP (Gal3‐GFP) fusion proteins. Gal3‐GFP can selectively bind to β‐galactoside sugars present on glycoproteins and glycolipids within the endosomal membranes.[ 22 , 51 , 52 ] This binding occurs specifically after the endosomal membranes have been damaged during endosomal escape (ES) events of NPs, leading to the appearance of bright green Gal3‐GFP puncta. This experimental design enables the concurrent analysis of NP uptake (indicated by Cy5 puncta), ES events (signalized by Gal3‐GFP puncta), and the expression of mRNA (via mCherry MFI). This is achieved by employing live cell imaging using confocal laser scanning microscopy (CLSM) at 15‐min intervals over a span of 6 h. b,c) Z‐projection of the CLSM images of Huh7 Gal3‐GFP cells after incubation with LNPs (left), Huh7 hybrids (middle), or J774 hybrids (right) for 1 (b) or 6 (c) h. Cyan signal: nucleus (Hoechst 33 342). Green signal: Gal3‐GFP. Red signal: mCherry expression. Blue signal: Cy5‐labeled mCherry mRNA. Scale bar: 25 µm. CLSM images after each hour of incubation are shown in Figure S11 (Supporting Information). Control experiments with hydroxychloroquine (positive control) or buffer (negative control) are also displayed in Figure S11 (Supporting Information). d–f) NP uptake (d), ESE (e), and mRNA expression (f) for all NP types were evaluated through semiquantitative image analysis, utilizing all acquired CLSM images from each time point and across replicates (n = 3, each comprising ≥15 cells). Values of NP uptake and mRNA expression have been normalized to the max Cy5 or mCherry MFI of LNPs and are presented as means ± SD. ESE is calculated as an absolute ratio, comparing the number of NP uptake (Cy5 puncta) to the number of ES events (Gal3‐GFP puncta), and is also shown as means ± SD. Levels of significance: *: p ≤ 0.05, **: p ≤ 0.01, and ***: p ≤ 0.001.
Figure 4
Figure 4
Biodistribution and mRNA expression of NPs in zebrafish larvae (ZFL). a) 5 nL of LNPs, Huh7 hybrids, or J774 hybrids, each containing the fluorescent lipid probe 1,1′‐Dioctadecyl‐3,3,3′,3′‐Tetramethylindodicarbocyanine (DiD) and mCherry mRNA, were injected into the duct of Cuvier of ZFL aged 2 days post‐fertilization (dpf). These larvae belong to the transgenic (Tg) line Tg(kdrl:EGFP), characterized by the expression of enhanced green fluorescent protein (EGFP) in their vasculature. The tail region, outlined by a black rectangle, was subsequently imaged at 6 and 24 h post‐injection (hpi) using CLSM. b,c) Z‐projection of the acquired images of the NP biodistribution (b) and mRNA expression (c) after 24 hpi. Images from the 6 hpi time point are presented in Figure S12a–c (Supporting Information). Blood vessels: DLAV: dorsal longitudinal anastomotic vessel; ISV: intersegmental vessel; CA: caudal aorta; CHT: caudal hematopoietic tissue; CV: caudal vein. d) Merge of the vasculature (Tg(kdrl:EGFP)), biodistribution (b), and mRNA expression (c) of these NPs. Green signal: Tg(kdrl:EGFP, vasculature). Red signal: mCherry expression. Blue signal: DiD labeled NPs. Scale bar: 100 µm. Corresponding 3D cranial view of these merged images are represented in Figure S13c (Supporting Information). e,f) Percentage of mCherry mRNA expression relative to the total imaged area in the tail region (e) and the MFI of the mCherry signal in Tg(kdrl:EGFP) at 24 hpi were determined using semiquantitative image analysis. Box plot: line: median, square: mean, box: lower and upper quartile, whisker: 1.5 interquartile range, filled circles: data points, filled rhombus: outlier, n ≥ 6. Levels of significance: *: p ≤ 0.05, **: p ≤ 0.01, and ***: p ≤ 0.001.
Figure 5
Figure 5
In vivo mRNA expression (luciferase activity) experiments of LNPs and J774 hLNPs in mice. a) 200 µL of LNPs or J774 hLNPs, each with a concentration of 25 µg mL−1 (equivalent to 5 µg of mRNA per mouse) and containing luciferase mRNA, were intravenously injected into the tail veins of 11–12 week‐old C57BL/6J mice. Subsequently, at 6, 24, 48, and 72 hpi, d‐luciferin was administered intraperitoneally (i.p.) at a dose of 10 µL g−1 body weight. Ten minutes following d‐luciferin injection, the luciferase activity (bioluminescence) was measured using an in vivo imaging system (IVIS). b) Images represent IVIS photography and luciferase activity (radiance) of mice injected with either LNPs (top row) or J774 hybrids (bottom row) at the specified time points. c) Quantified abdominal radiance of the mice in (b), providing comparative analysis of the luciferase activity of LNPs (blue) and J774 hybrids (orange) over time. Box plot: line: median, square: mean, box: lower and upper quartile, whisker: 1.5 interquartile range, filled circles: data points. n  =  3 mice. Levels of significance: *: p ≤ 0.05, **: p ≤ 0.01, and ***: p ≤ 0.001.

References

    1. Comirnaty (BioNTech/Pfizer COVID‐19 vaccine) – EMA. https://www.ema.europa.eu/en/documents/assessment-report/comirnaty-epar-..., (accessed: May 2023).
    1. EMA. Spikevax, (previously COVID‐19 Vaccine Moderna). European Medicines Agency https://www.ema.europa.eu/en/medicines/human/EPAR/spikevax 2021. (accessed: April 2023).
    1. Warne N., Ruesch M., Siwik P., Mensah P., Ludwig J., Hripcsak M., Godavarti R., Prigodich A., Dolsten M., Nat. Biotechnol. 2023, 41, 183. - PubMed
    1. Akinc A., Maier M. A., Manoharan M., Fitzgerald K., Jayaraman M., Barros S., Ansell S., Du X., Hope M. J., Madden T. D., Mui B. L., Semple S. C., Tam Y. K., Ciufolini M., Witzigmann D., Kulkarni J. A., van der Meel R., Cullis P. R., Nat. Nanotechnol. 2019, 14, 1084. - PubMed
    1. Arabi F., Mansouri V., Ahmadbeigi N., Biomed. Pharmacother. 2022, 153, 113324. - PubMed

LinkOut - more resources