. 2024;7(3):2255-2275.
doi: 10.1007/s42001-024-00305-3. Epub 2024 Aug 28.

Small-area population forecasting in a segregated city using density-functional fluctuation theory

Affiliations

Small-area population forecasting in a segregated city using density-functional fluctuation theory

Yuchao Chen et al. J Comput Soc Sci. 2024.

Abstract

Policy decisions concerning housing, transportation, and resource allocation would all benefit from accurate small-area population forecasts. However, despite the success of regional-scale migration models, developing neighborhood-scale forecasts remains a challenge due to the complex nature of residential choice. Here, we introduce an innovative approach to this challenge by extending density-functional fluctuation theory (DFFT), a proven approach for modeling group spatial behavior in biological systems, to predict small-area population shifts over time. The DFFT method uses observed fluctuations in small-area populations to disentangle and extract effective social and spatial drivers of segregation, and then uses this information to forecast intra-regional migration. To demonstrate the efficacy of our approach in a controlled setting, we consider a simulated city constructed from a Schelling-type model. Our findings indicate that even without direct access to the underlying agent preferences, DFFT accurately predicts how broader demographic changes at the city scale percolate to small-area populations. In particular, our results demonstrate the ability of DFFT to incorporate the impacts of segregation into small-area population forecasting using interactions inferred solely from steady-state population count data.

Keywords: Density-functional fluctuation theory; Migration; Residential choice; Schelling model; Segregation; Small-area forecasts.


Conflict of interest statement

Conflict of interestOn behalf of all authors, the corresponding author states that there is no conflict of interest.

Figures
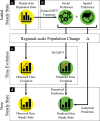
Fig. 1
Fig. 1
General Workflow of Applying DFFT to Data of Segregated Populations. a Collect small-area steady-state population data in the form of probability distributions of local densities. Steady state is reached when the population distribution no longer changes drastically over time. In our example, we simulate the steady-state data from a Schelling model (yellow bubble). b Extract DFFT functions from steady-state data. The DFFT functions characterize social and spatial preferences separately. c After a population change, we predict the time evolution of small-area population data with time-dependent DFFT (TD-DFFT) using the extracted DFFT functions. We compare our prediction with the observed time evolution from the Schelling model simulations (yellow bubble). d We predict the new small-area steady state after the regional-scale change either numerically using TD-DFFT or analytically using DFFT functions. We compare our prediction with the observed new steady state of the Schelling model simulations (yellow bubble)
Fig. 2
Fig. 2
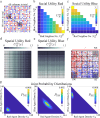
Schelling-type simulation and steady-state data. a Top-left corner of the Schelling lattice grid with 1000 red and 1000 blue agents. At each step in time, an agent and an empty cell are randomly chosen, and the agent will make probabilistic move to the empty cell. In this example, a red agent is chosen to move to a randomly chosen empty cell. The 8-connected neighborhood of the red agent and empty cell are shown as dashed boxes. b Social Utility for red agents is defined by URso(NRne,NBne)=0.4·NRne, where NRne and NBne are the number of 8-connected red and blue neighbors respectively. For the red agent in a, the change in social utility due to the proposed move is given by URso(5,1)-URso(1,6)=+1.6, making this move favorable by social preferences. c Social Utility for blue agents is defined by UBso(NRne,NBne)=0.4·NBne. d Spatial Utility for red agents URsp(x) is a function of location x, that decreases linearly in the horizontal direction. The change in spatial utility for the red agent in a for the proposed move is ΔURsp+0.17, making this move favorable by spatial preferences. So, according to Eq. (1), the red agent has a 85% chance of moving. e Spatial Utility for blue agents UBsp(x) is a function of location x, that decreases linearly in the vertical direction. f A sample steady-state configuration of our simulation after reaching steady state (>10000 steps). We divide the Schelling lattice grid into 25 blocks with 144 sites each, three of which are shaded and labeled as ‘NE’, ‘SW’, and ‘SE’ for reference. To obtain a collection of steady-state configurations (red stack and red ellipses), we run an ensemble of Schelling simulations. g From the collection of steady-state configurations, one can observe the steady-state joint probability distribution of observing a given agent densities for each block. Distributions for blocks ‘NE’, ‘SW’, ‘SE’ are shown
Fig. 3
Fig. 3
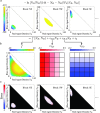
Extracting effective social and spatial preferences a The LHS of Eq. (4) is determined by our observed probability Pb (Fig. 2g), and is plotted for blocks ‘NE’, ‘SW’, ‘SE’. We only keep data for cases where more than 10 observations are recorded for a particular agent combination. b Using Maximum Likelihood Estimation, we fit each of the 25 LHS surfaces by a block-independent surface called “frustration” together with a block-dependent planar shift vR,bNR+vB,bNB+cb, where vR,b and vB,b are block-dependent constants called “vexations”, and cb is a block-dependent normalization constant. Frustration describes social preference, while vexations describe spatial preference. c The errors of the fit in b are determined by the difference between the right hand and left hand sides of Eq. (4), for the NE, SW, and SE blocks and demonstrate very good agreement (generally in the range of only ±1, which is two orders of magnitude smaller than the variation in the RHS of Eq. (4)). We measure mean absolute error (MAE) to be 0.12, 0.15, and 0.13 (out of a dynamic range of 100) for blocks ‘NE’, ‘SW’, and ‘SE’, respectively. We measure Pearson correlations to be 0.9999, 0.9975, and 0.9999 for blocks ‘NE’, ‘SW’, and ‘SE’, respectively
Fig. 4
Fig. 4
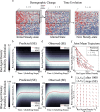
Predicting time evolution a Starting from a steady-state configuration, at t=0, we introduce our demographic change by abruptly switching 350 randomly chosen red agents on the north side of the Schelling lattice into blue agents to obtain an altered state. The system is then evolved according to the Schelling model. The above procedure is repeated over an ensemble of Schelling simulations (shown as stacks and ellipses). b-c Predicted time evolution of the probability distribution for observing red or blue agents for the ‘SE’ block using the TD-DFFT model. Note that the distribution for red agents is skewed away from the mean towards more segregated values. The MVE predictions agree well with the Mean of the TD-DFFT Model for both types of agent. d-e Observed time evolution of the probability distribution for observing red or blue agents for the ‘SE’ block from the Schelling simulation. For 0<t<20000, we measure mean absolute error (MAE) to be 0.10 (out of a dynamic range of 3) and 0.19 (out of a dynamic range of 10) for mean values of red and blue agents, respectively; we measure Pearson correlations to be 0.9981 and 0.9983 for mean values of red and blue agents, respectively. f Observed versus predicted Joint-mean density trajectories for all blocks (counted left-to-right then top-to-bottom, in normal English reading order). Blocks 13-15 show interesting trajectories, which the TD-DFFT model predicts well. g Observed versus predicted average changes in number of agents in block ‘SE’ after 1000 Schelling steps for various initial numbers of agents. We note that a calibration factor is necessary to match the time scales between the density based model predictions and the Schelling simulations
Fig. 5
Fig. 5
Analytic prediction of new steady state. a Predicted versus observed new steady-state joint probability distribution for block ‘SE’. b Predicted versus observed mean densities of red agents for all blocks, each with total capacity 144. We measure a Pearson correlations of 0.9997 and mean absolute error (MAE) of 0.42 (out of a dynamic range of 100). c Predicted versus observed mean densities of blue agents for all blocks, each with total capacity 144. We measure a Pearson correlation of 0.9999 and MAE value of 0.50 (out of a dynamic range of 100)

Similar articles

Cited by

References

    1. Anderson, L. M., Charles, J. S., Fullilove, M. T., et al. (2003). Providing affordable family housing and reducing residential segregation by income: A systematic review. American Journal of Preventive Medicine,24(3), 47–67. - PubMed
    1. Barron, B., Kinkhabwala, Y.A., Hess, C., et al (2022) Extending the use of information theory in segregation analyses to construct comprehensive models of segregation. arXiv preprint arXiv:2212.06980
    1. Benenson, I., Hatna, E., & Or, E. (2009). From schelling to spatially explicit modeling of urban ethnic and economic residential dynamics. Sociological Methods & Research,37(4), 463–497.
    1. Boke-Olén, N., Abdi, A. M., Hall, O., et al. (2017). High-resolution African population projections from radiative forcing and socio-economic models, 2000 to 2100. Scientific Data,4(1), 1–9. - PMC - PubMed
    1. Bruch, E. E., & Mare, R. D. (2006). Neighborhood choice and neighborhood change. American Journal of Sociology,112(3), 667–709.

LinkOut - more resources