. 2024 Oct 9;27(11):111108.
doi: 10.1016/j.isci.2024.111108. eCollection 2024 Nov 15.

Preclinical validation of human recombinant glutamate-oxaloacetate transaminase for the treatment of acute ischemic stroke

Affiliations

Preclinical validation of human recombinant glutamate-oxaloacetate transaminase for the treatment of acute ischemic stroke

María Pérez-Mato et al. iScience. .

Abstract

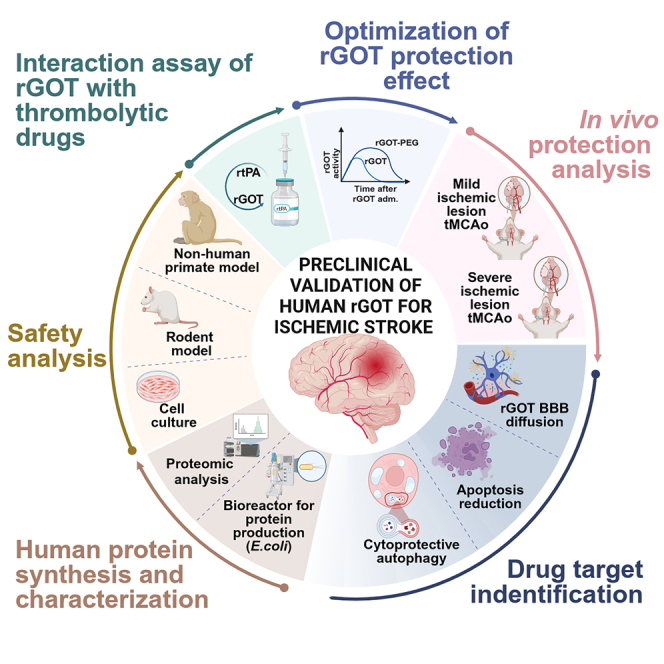
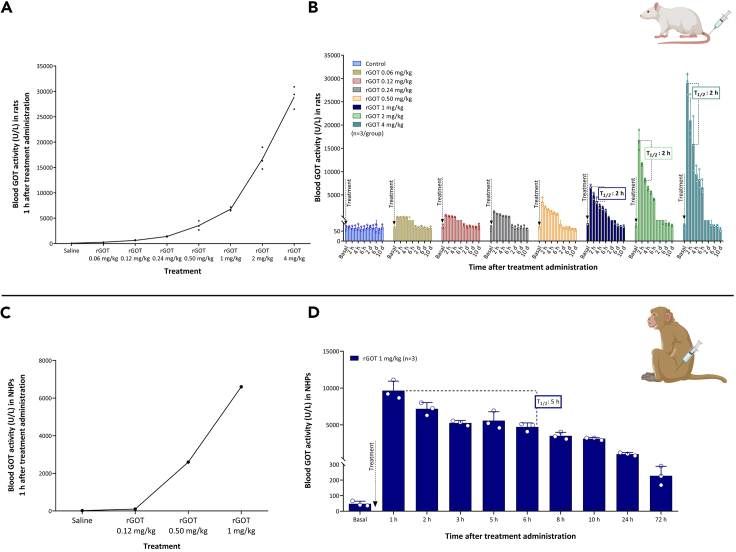
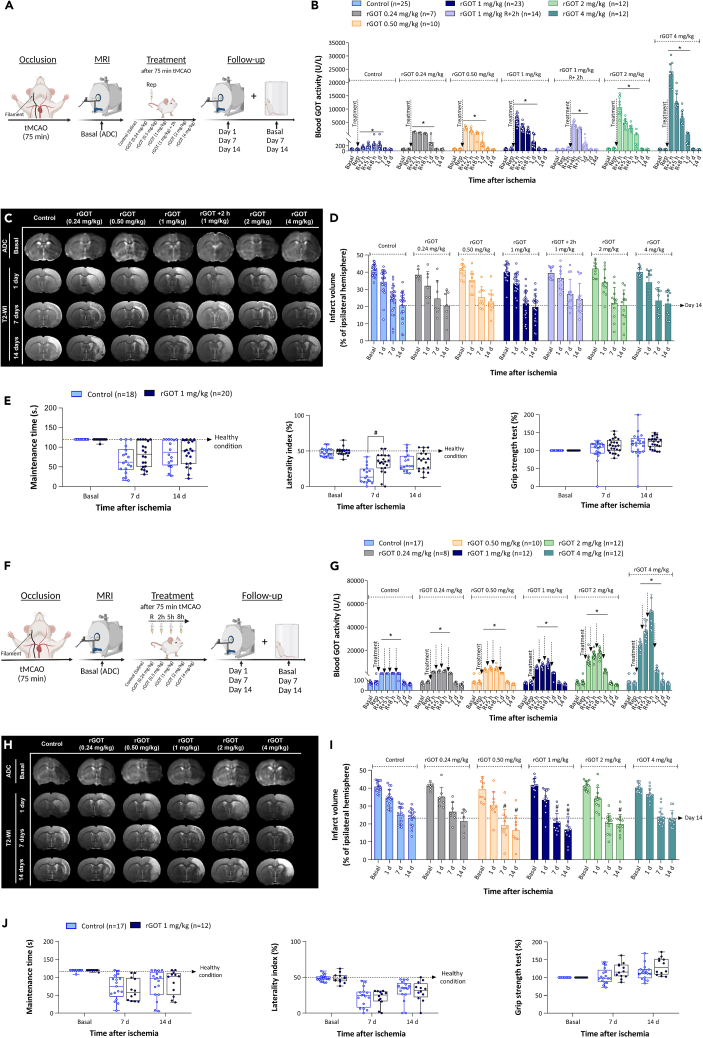
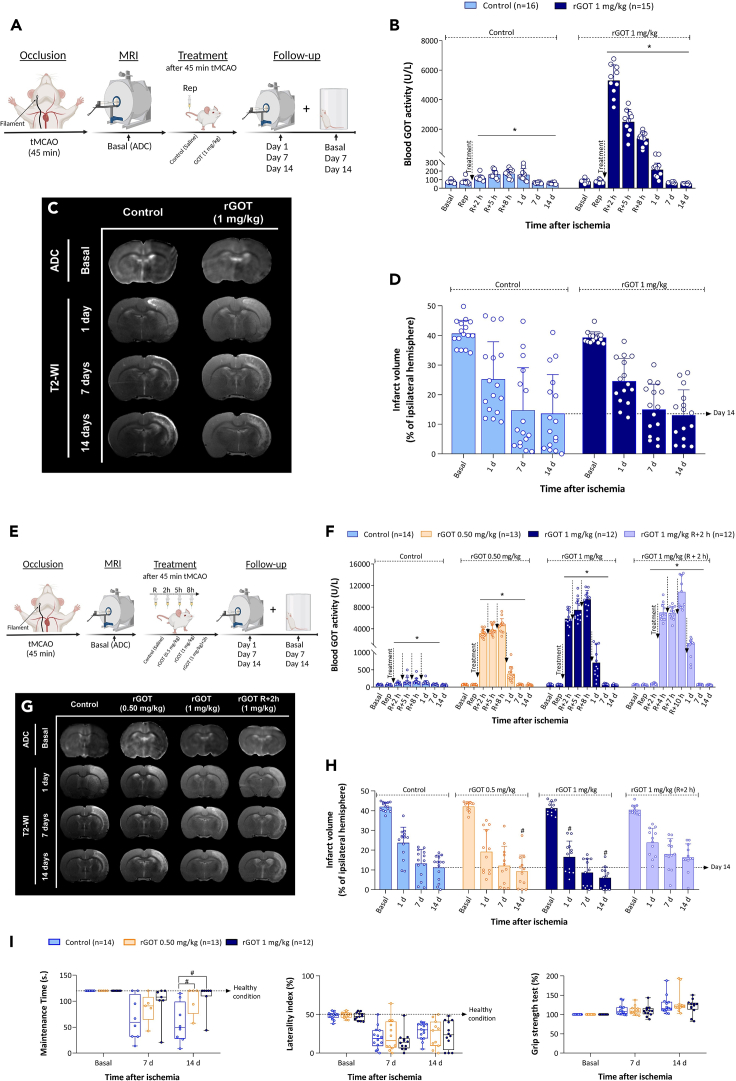
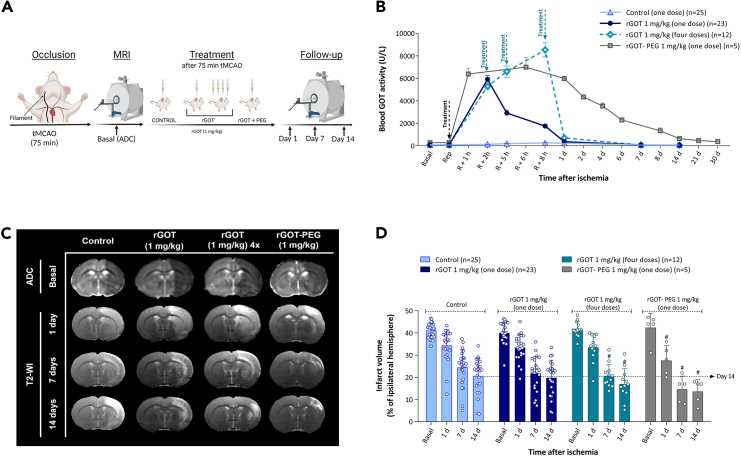
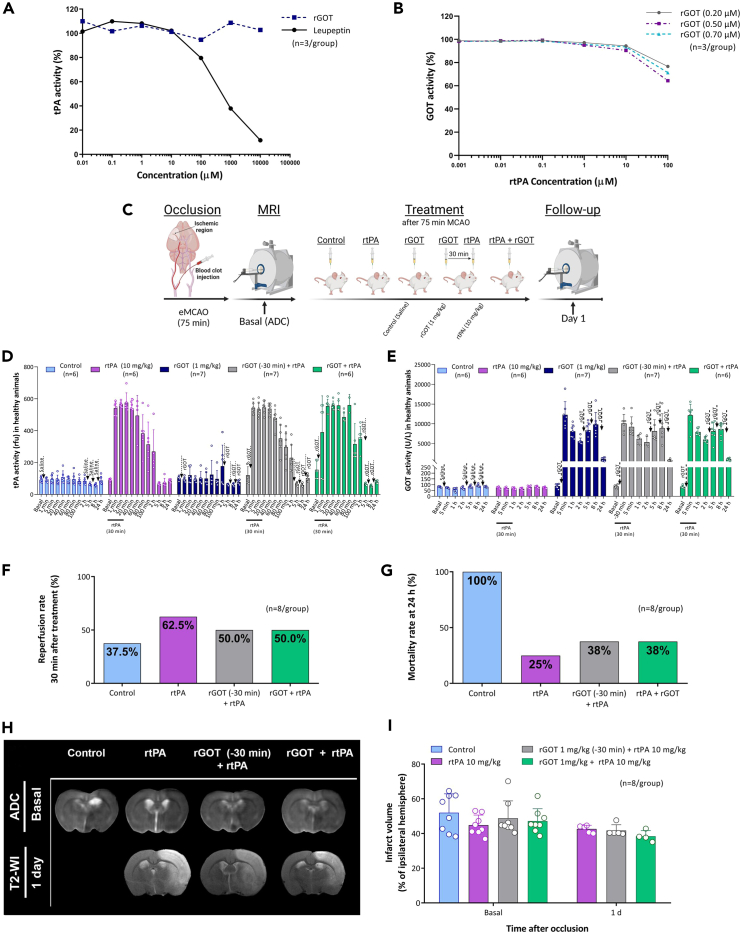
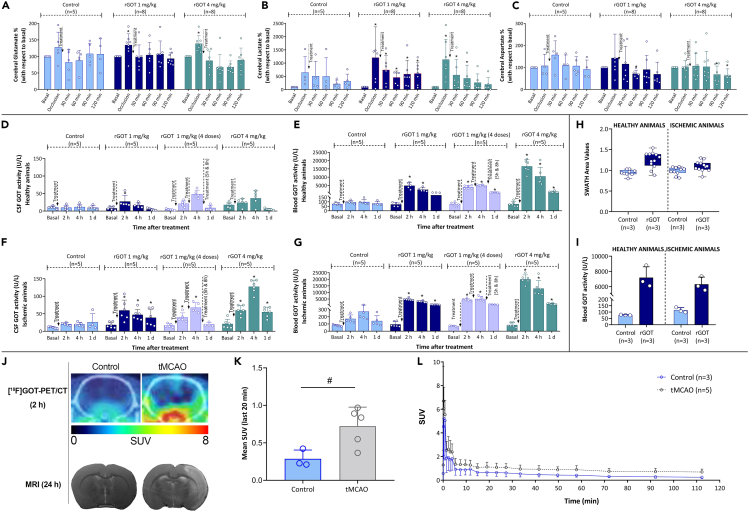
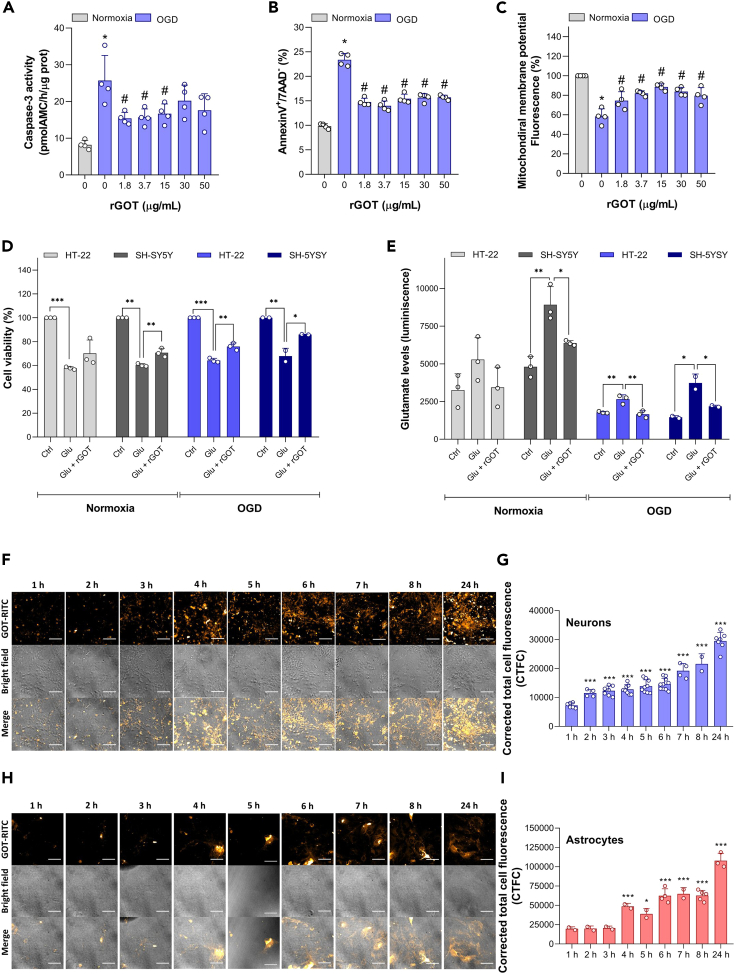
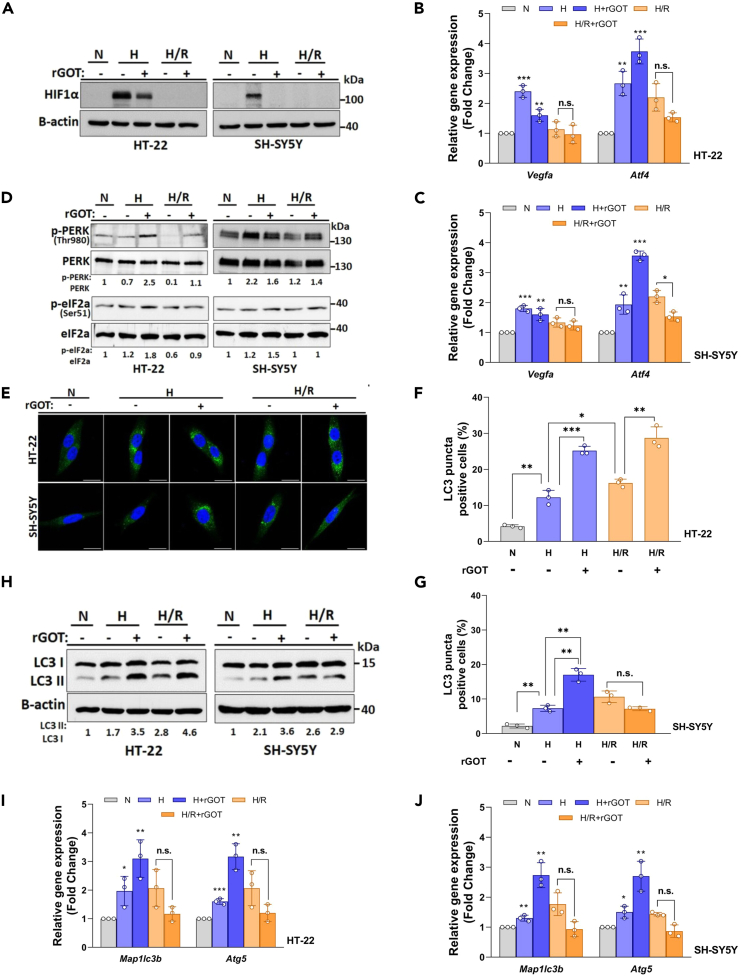
The blood enzyme glutamate-oxaloacetate transaminase (GOT) has been postulated as an effective therapeutic to protect the brain during stroke. To demonstrate its potential clinical utility, a new human recombinant form of GOT (rGOT) was produced for medical use. We tested the pharmacokinetics and evaluated the protective efficacy of rGOT in rodent and non-human primate models that reflected clinical stroke conditions. We found that continuous intravenous administration of rGOT within the first 8 h after ischemic onset significantly reduced the infarct size in both severe (30%) and mild lesions (48%). Cerebrospinal fluid and proteomics analysis, in combination with positron emission tomography imaging, indicated that rGOT can reach the brain and induce cytoprotective autophagy and induce local protection by alleviating neuronal apoptosis. Our results suggest that rGOT can be safely used immediately in patients suspected of having a stroke. This study requires further validation in clinical stroke populations.

Keywords: biological sciences; natural sciences; neuroscience; pharmacology; physiology.


Conflict of interest statement

The funding sponsors did not participate in the study design; collection, analysis, or interpretation of data; writing the report; or in the decision to submit the paper for publication. Preparation of the new version of identical human rGOT at Biotechpharma (Lithuania) was supported by a grant from Sun Pharma (Mumbai, India) to Prof. David Mirelman.

Figures

None
Graphical abstract
Figure 1
Figure 1
Pharmacokinetic analysis of rGOT in rats and primates (A) Dose-response curve of blood GOT activity measured 1 h after rGOT i.v. administration in healthy rats (n = 3). (B) Time course of blood GOT activity in healthy rats treated with rGOT. Rats were i.v. treated with saline (control group) and rGOT (0.06, 0.12, 0.24, 0.5, 1, 2, and 4 mg/kg). Blood GOT activity was measured under basal conditions (before treatment administration) and 1, 2, 3, 4, 5, and 6 h and 1, 2, 4, 6, 8, and 10 days after administration. The dashed line represents the half-life (T1/2 = 2 h) of rGOT. (C) Dose-response analysis in healthy primates (n = 1/dose) treated with 0.12, 0.5, and 1 mg/kg rGOT. Blood GOT activity before treatment was considered the basal value. GOT blood activity was determined 1 h after treatment administration. (D) Pharmacokinetic analysis of a 1 mg/kg dose in healthy primates (n = 3). Blood GOT activity was measured under basal conditions (before treatment administration) and 1, 2, 3, 5, 6, 8, and 10 h, and 1 and 3 days after administration. The T1/2 of rGOT was estimated to be around 5 h. Data are shown as mean ± standard deviation of the mean. The data were analyzed using SPSS statistical software (v19.0) and GraphPad Prism software (v.8.3.0) for representation of graphs. i.v., intravenous; NHPs, non-human primates; rGOT, recombinant glutamate-oxaloacetate transaminase. BioRender (https://biorender.com/) was used for creating the figures.
Figure 2
Figure 2
Therapeutic study of rGOT in rats with severe cerebral ischemia (A) Schematic representation of the experimental design. Treatments (saline and rGOT at 0.24, 0.5, 1, 2, and 4 mg/kg) were administered as a single i.v. bolus immediately after artery reperfusion (75 min after cerebral occlusion) in independent groups of ischemic animals. Dose of 1 mg/kg administered 2 h after reperfusion was tested in an additional experimental group. Ischemic lesion was measured by MRI at day 0 by ADC maps (during cerebral artery occlusion), and at days 1, 7, and 14 after ischemia induction by T2-maps. Basal lesion assessment at day 0 was used to confirm similar lesion volumes (35%–45%) in all included animals before treatment administration. Motor and somatosensory tests were evaluated by means of rotarod test, grip strength, and cylinder test at 1 day before surgery (basal) and 7 and 14 days after ischemia. (B) Time course of blood GOT activity in ischemic rats. (C) MRI analysis of the ischemic evolution. (D) Infarct size assessment in ischemic rats. Ischemic lesion is represented as percentage adjusted to the ipsilateral hemisphere. The dashed line represents the infarct volume at 14 days of the control group used as reference to see the effect of treatments. (E) Boxplots showing the assessment of sensorimotor function using rotarod test (evaluated as maintenance time in seconds), cylinder test (evaluated as percentage of laterality), and grip strength (evaluated as percentage with respect to the basal condition). The dashed line in the rotarod and cylinder tests represents the healthy condition of the animals before the ischemic induction. In the grip strength, natural increase of muscular strength is reduced by ischemic lesion. (F) Schematic representation of the experimental design. Treatments (saline and rGOT, 0.24, 0.5, 1, 2, and 4 mg/kg) were administered (i.v.) in independent groups of ischemic animals four times over a period of 8 h. The first dose was initiated after artery reperfusion (75 min after cerebral occlusion), followed by three consecutive doses at 2, 5, and 8 h after artery reperfusion. The ischemic lesion was measured by MRI at day 0 by ADC maps (during cerebral artery occlusion), and at days 1, 7, and 14 after ischemia induction by T2-maps. Basal lesion assessment at day 0 was used to confirm similar lesion volumes (35%–45%) in all included animals before treatment administration. Motor and somatosensory tests were evaluated by means of the rotarod test, grip strength test, and cylinder test at 1 day before surgery (basal), and 7 and 14 days after ischemia. (G) Time course of blood GOT activity in ischemic rats. (H) MRI analysis of the ischemic evolution. (I) Infarct size assessment in ischemic rats. (J) Boxplots showing the assessment of sensorimotor function using the rotarod test (evaluated as maintenance time in seconds), cylinder test (evaluated as percentage of laterality), and grip strength (evaluated as percentage with respect to the basal condition). The dashed line in the rotarod and cylinder tests represents the healthy condition of the animals before the ischemic induction. In the grip strength, natural increase of muscular strength is reduced by ischemic lesion. All data are expressed as mean ± standard deviation of the mean. p ∗ < 0.05 compared with the basal. p # < 0.05 compared with the control group at same time point. The data were analyzed using SPSS statistical software (v19.0) and GraphPad Prism software (v.8.3.0) for representation of graphs. The criterion for statistical significance was set at p < 0.05. The Shapiro–Wilk test was used to determine whether the data were normally distributed. Based on the results of normality tests and the sample size, statistical analysis was performed using non-parametric tests, Wilcoxon test for paired data, and Mann-Whitney test for unpaired data. ADC, apparent diffusion coefficient; i.v., intravenous; MRI, magnetic resonance imaging; R or Rep, reperfusion; tMCAO, transient middle cerebral artery occlusion; rGOT, recombinant glutamate-oxaloacetate transaminase; T2-WI, T2-weighted imaging. BioRender (https://biorender.com/) was used for creating the figures.
Figure 3
Figure 3
Therapeutic study of rGOT in rats with mild cerebral ischemia (A) Schematic representation of the experimental design. Treatments (control and 1 mg/kg rGOT) were administered as a single i.v. bolus immediately after artery reperfusion (45 min after cerebral occlusion) in independent groups of ischemic animals. The ischemic lesion was measured using MRI at day 0 by ADC maps (during cerebral artery occlusion), and at days 1, 7, and 14 after ischemia induction by T2-maps. Basal lesion assessment at day 0 was used to confirm similar lesion volumes (35%–45%) in all included animals before treatment administration. (B) Time course of blood GOT activity in ischemic rats. (C) MRI analysis of the ischemic evolution. (D) Infarct size assessment in ischemic rats. The ischemic lesion is represented as the percentage adjusted to the ipsilateral hemisphere. The dashed line represents the infarct volume at 14 days after ischemia in the control group (used as reference) to see the effects of treatments. (E) Schematic representation of the experimental design. Treatments (control and rGOT 0.5 and 1 mg/kg) were administered (i.v.) in independent groups of ischemic animals four times over a period of 8 h. The first dose was initiated after artery reperfusion (45 min after cerebral occlusion), followed by three consecutive doses at 2, 5, and 8 h after artery reperfusion. A dose of 1 mg/kg administered 2 h after reperfusion was tested in an additional experimental group. The ischemic lesion was measured by MRI at day 0 by ADC maps (during cerebral artery occlusion), and at days 1, 7, and 14 after ischemia induction by T2-maps. Basal lesion assessment at day 0 was used to confirm similar lesion volumes (35%–45%) in all included animals before treatment administration. Motor and somatosensory tests were evaluated by means of the rotarod test, cylinder test, and grip strength test 1 day before surgery (basal) and 7 and 14 days after ischemia. (F) Time course of blood GOT activity in ischemic rats. (G) MRI analysis of the ischemic evolution. (H) Infarct size assessment in ischemic rats. (I) Boxplots showing the assessment of sensorimotor function using the rotarod test (evaluated as maintenance time in seconds), cylinder test (evaluated as percentage of laterality), and grip strength (evaluated as percentage with respect to the basal condition). The dashed lines in the rotarod and cylinder tests represent the healthy condition of the animals before ischemic induction. In the grip strength test, a natural increase in muscular strength is reduced by an ischemic lesion. All data are expressed as mean ± standard deviation of the mean. p ∗ <0.05 compared with the basal. p # < 0.05 compared with the control group at same time point. The data were analyzed using SPSS statistical software (v19.0) and GraphPad Prism software (v.8.3.0) for representation of graphs. The criterion for statistical significance was set at p < 0.05. The Shapiro–Wilk test was used to determine whether the data were normally distributed. Based on the results of normality tests and the sample size, statistical analysis was performed using non-parametric tests, Wilcoxon test for paired data, and Mann-Whitney test for unpaired data. ADC, apparent diffusion coefficient; i.v., intravenous; MRI, magnetic resonance imaging; R or Rep, reperfusion; tMCAO, transient middle cerebral artery occlusion; rGOT, recombinant glutamate-oxaloacetate transaminase; T2-WI, T2-weighted imaging. BioRender (https://biorender.com/) was used for creating the figures.
Figure 4
Figure 4
Therapeutic study of sustained rGOT-PEG activity in ischemic rats (A) Schematic representation of the experimental design. Independent groups of ischemic animals were treated (i.v.) with saline (control), one dose of rGOT, four doses (defined as 4×) of rGOT, and one dose of rGOT-PEG (all doses 1 mg/kg of rGOT protein). All treatments were initiated immediately after artery reperfusion (75 min after cerebral occlusion). Four doses of rGOT were administered in a period of 8 h, with intervals of 2, 3, and 3 h after artery reperfusion. The ischemic lesion was measured by MRI at day 0 by ADC maps (during cerebral artery occlusion), and at days 1, 7, and 14 after ischemia induction by T2-maps. Basal lesion assessment at day 0 was used to confirm similar lesion volumes (35%–45%) in all included animals before treatment administration. (B) Time course of blood GOT activity in ischemic rats. (C) MRI analysis of the ischemic evolution. (D) Infarct size assessment in ischemic rats. The ischemic lesion is represented as the percentage adjusted to the ipsilateral hemisphere. The dashed line represents the infarct volume of the control group at 14 days after ischemia (used as a reference) to see the effect of treatments. All data are expressed as mean ± standard deviation of the mean. p ∗ <0.05 compared with the basal. p # < 0.05 compared with the control group at same time point. The data were analyzed using SPSS statistical software (v19.0) and GraphPad Prism software (v.8.3.0) for representation of graphs. The criterion for statistical significance was set at p < 0.05. The Shapiro–Wilk test was used to determine whether the data were normally distributed. Based on the results of normality tests and the sample size, statistical analysis was performed using non-parametric tests, Wilcoxon test for paired data, and Mann-Whitney test for unpaired data. ADC, apparent diffusion coefficient; i.v., intravenous; MRI, magnetic resonance imaging; R or Rep, reperfusion; tMCAO, transient middle cerebral artery occlusion; rGOT, recombinant glutamate-oxaloacetate transaminase; PEG, polyethylene glycol; T2-WI, T2-weighted imaging. BioRender (https://biorender.com/) was used for creating the figures.
Figure 5
Figure 5
In vitro and in vivo interaction between rtPA and rGOT (A) In vitro analysis of rtPA activity analyzed in combination with the increasing concentration of rGOT. Leupeptin was used as an inhibitor control of rtPA activity. (B) In vitro analysis of rGOT activity determined in the presence of increasing concentrations of rtPA. (C) Schematic representation of the experimental design of the interaction study between rtPA and rGOT in healthy and ischemic model induced by the thromboembolic occlusion of the MCAO (eMCAO). Independent groups of animals were treated with saline (control), rtPA 10 mg/kg (1 mL; 10% administered in an initial loading bolus, the other 90% of the dose was continuously infused), rGOT 1 mg/kg, rGOT 1 mg/kg treated simultaneously with rtPA 10 mg/kg, and a final group treated with rGOT 1 mg/kg 30 min before rtPA 10 mg/kg. The ischemic lesion was measured by MRI at day 0 by ADC maps (during cerebral artery occlusion, 75 min) and at day 1 by T2-maps. Basal lesion assessment at day 0 confirmed similar lesion volumes in all included animals before treatment administration. (D) In vivo interaction of rtPA with rGOT (four doses of 1 mg/kg) activity and (E) interaction of rGOT (four doses of 1 mg/kg) with rtPA activity, in healthy animals. Blood levels of rtPA and GOT activity were determined in the blood before treatment administration (basal values), and 24 h after treatment. (F) Reperfusion rate determined at 30 min after treatment administration. Successful reperfusion was considered to be when at least 40% of the basal cerebral blood flow was recovered within the first 40 min after treatment administration. (G) Mortality rate (%) at 24 h after ischemic induction. (H) MRI analysis of the ischemic evolution. (I) Infarct size assessment in ischemic rats. Ischemic lesions are represented as the percentage adjusted to the ipsilateral hemisphere. All data are expressed as mean ± standard deviation of the mean. The data were analyzed using SPSS statistical software (v19.0) and GraphPad Prism software (v.8.3.0) for representation of graphs. BioRender (https://biorender.com/) was used for creating the figures. The criterion for statistical significance was set at p < 0.05. The Shapiro–Wilk test was used to determine whether the data were normally distributed. Based on the results of normality tests and the sample size, statistical analysis was performed using non-parametric tests, Wilcoxon test for paired data, and Mann-Whitney test for unpaired data. ADC, apparent diffusion coefficient; eMCAO, embolic middle cerebral artery occlusion rat model; i.v., intravenous; MRI, magnetic resonance imaging; rtPA, recombinant tissue plasminogen activator; R/Rep, reperfusion; rGOT, recombinant glutamate-oxaloacetate transaminase; T2-WI, T2-weighted imaging.
Figure 6
Figure 6
Analysis of rGOT treatment in the brain of healthy and ischemic animals MRS analysis of (A) glutamate, (B) lactate, and (C) aspartate in independent groups of ischemic animals who underwent transient occlusion (75 min) of the middle cerebral artery. Treatments (saline, one dose of 1 and 4 mg/kg of rGOT) were initiated immediately after arterial perfusion. Metabolite levels were determined in basal conditions (before ischemic induction), during artery occlusion, and 30, 60, 90, and 120 min after reperfusion. (D) Analysis of GOT activity in CSF and (E) blood samples from healthy animals treated (i.v.) with saline (control group), one dose of rGOT 1 mg/kg, four doses of rGOT 1 mg/kg, and one dose of rGOT 4 mg/kg. Levels of GOT were analyzed before treatment administration (basal levels) and 2, 4, and 24 h after treatment administration. (F) Analysis of GOT activity in CSF and (G) blood samples from ischemic animals treated with saline (control group), one dose of rGOT 1 mg/kg, four doses of rGOT 1 mg/kg, and one dose of rGOT 4 mg/kg. Ischemic lesion was induced by the transient occlusion (75 min) of the middle cerebral artery. Treatments were initiated immediately after arterial perfusion. Levels of GOT were analyzed before ischemia, during artery occlusion (before reperfusion), and 2, 4, and 24 h after treatment administration. (H) LC-MS/MS by sequential window acquisition of all theoretical mass spectra (SWATH-MS) analysis of GOT levels in brain tissue from healthy and ischemic animals (45 min of tMCAO) treated with saline (control) and one dose of rGOT 1 mg/kg. GOT was analyzed in the brain and blood (I) 1 h after treatment administration in the perfused brain tissues and blood, respectively. (J) Evaluation of cerebral [18F]GOT-PET signal uptake in healthy and ischemic rat brains at 2 h after i.v. treatment administration. The healthy brain in control and ischemic lesion in tMCAO animals was evaluated at 24 h using MRI. PET brain images of axial planes at the level of the ischemic lesion are co-registered with the CT of the same animal. The time-activity curve of the VOI placed on the whole brain of control and ischemic animals after i.v. administration of [18F]GOT. (K) Representation of mean SUV values of the last 20 min of PET acquisition in control and tMCAO rat brains. (L) Values are presented as scatter dot blot. All data are expressed as mean ± standard deviation of the mean. p ∗ <0.05 compared with the basal. p # < 0.05 compared with the control group at same time point. The data were analyzed using SPSS statistical software (v19.0) and GraphPad Prism software (v.8.3.0) for representation of graphs. The criterion for statistical significance was set at p < 0.05. The Shapiro–Wilk test was used to determine whether the data were normally distributed. Based on the results of normality tests and the sample size, statistical analysis was performed using non-parametric tests, Wilcoxon test for paired data, and Mann-Whitney test for unpaired data. CSF, cerebrospinal fluid; CT, computed tomography; i.v., intravenous; LC-MS/MS, liquid chromatography with tandem mass spectrometry; MRI, magnetic resonance imaging; MRS, magnetic resonance spectroscopy; PET, positron emission tomography; rGOT, recombinant glutamate-oxaloacetate transaminase; tMCAO, transient middle cerebral artery occlusion; SUV, standardized uptake values; VOI, volume of interest. BioRender (https://biorender.com/) was used for creating the figures.
Figure 7
Figure 7
In vitro protection analysis of rGOT in neuronal cultures (A) rGOT protection in primary neuronal culture. Neurons were subjected to normoxia or oxygen and glucose deprivation (OGD) conditions, for 90 min, and were further incubated in culture medium for 24 h, in the absence of presence of increasing concentrations of rGOT (1.8–50 μg/mL). Caspase-3 activity and (B) neuronal apoptosis (AnnexinV+/7AAD neurons) were analyzed by fluorimetry and flow cytometry, respectively. (C) Mitochondrial depolarization was determined by flow cytometry. Data are represented as mean ± standard deviation from 4 different neuronal cultures (∗p < 0.05 versus normoxia; #p < 0.05 versus OGD). (D) Neuroprotective effect of rGOT upon glutamate excitotoxicity or OGD. Cell viability was measured by the AlamarBlue assay after exposure to 20 mM glutamate or glutamate and rGOT (10 μg/mL) for 5 or 6 h in HT-22 cells and SH-5YSY cell, respectively. OGD was induced during 5 h with or without rGOT (10 μg/mL) during reperfusion in the same cell lines. (E) Glutamate levels were measured in parallel in HT-22 and SH-5YSY cells. As positive control, cells were treated with chlorpromazine hydrochloride (CHL, 50 μM), leading to 2%–10% viability (data not shown). Data are expressed as the average value of three independent experiment replicates ± standard deviation. One-way ANOVA followed by Bonferroni’s multiple comparison test. ∗p < 0.5, ∗∗p < 0.01, ∗∗∗p < 0.001; h, hours. (F) Confocal images of cortical neuron primary cultures and (G) astrocyte primary cultures treated with GOT labeled with rhodamine B isothiocyanate (GOT-RITC). The incubation with the GOT-RITC was conducted during 1, 2, 3, 4, 5, 6, 7, 8, and 24 h to study the internalization throughout the hours. The quantification of the internalization in neurons (I) and astrocytes (H) was performed through corrected total cell fluorescence (CTCF). Scale bar: 50 μm. Purity of neuronal and astrocytes cultures is indicated in Figures S12 and S13 respectively. Data are represented as mean ± standard deviation (∗p < 0.05; ∗∗∗p < 0.001 versus 1 h). The data were analyzed using SPSS statistical software (v19.0) and GraphPad Prism software (v.8.3.0) for representation of graphs. CTCF, Ctrl, control; corrected total cell fluorescence; Glu, glutamate; OGD, oxygen and glucose deprivation; rGOT, recombinant glutamate-oxaloacetate transaminase.
Figure 8
Figure 8
In vitro analysis of rGOT on autophagy in neuronal cultures (A) HIF1α immunoblots of HT-22 and SH-SY5Y cells following hypoxia (H) and hypoxia/reoxygenation (H/R) with or without rGOT (10 μg/mL) treatment conditions. An anti-B-actin antibody was used as a loading control. Full western blots (WB) images are shown in Figure S14A. (B and C) qRT-PCR analyses of VEGFA and ATF4 mRNA expression levels following hypoxia (H) and hypoxia/reoxygenation (H/R) with or without rGOT (10 μg/mL) treatment conditions in both cell lines. GAPDH mRNA level was used as a control. (D) Immunoblots of p-PERK and PERK, p-EIF2α and EIF2α following hypoxia (H) and hypoxia/reoxygenation (H/R) with or without rGOT (10 μg/mL) treatment conditions in both cell lines. ImageJ quantifications of p-PERK:PERK and p-eIF2a:eIF2a ratios were shown under the blots. Full WB images are shown in Figure S14B. (E) LC3 (autophagy marker, green/Alexa 488) and DAPI (blue) were used to depict the nucleus staining following hypoxia (H) and hypoxia/reoxygenation (H/R) with or without rGOT (10 μg/mL) treatment conditions in both cell lines. (F and G) Quantification and graphical representation of LC3 positivity. At least LC3 puncta of 150 cells were counted under each condition. (H) Immunoblot analyses of LC3-shift assays following hypoxia (H) and hypoxia/reoxygenation (H/R) with or without rGOT (10 μg/mL) treatment conditions in both cell lines. β-actin was used as a loading control. ImageJ quantifications of LC3 II:LC3 I ratios were shown under the blots. Full WB images are shown in Figure S14C. (I and J) qRT-PCR analyses of MAP1LC3B and ATG5 mRNA expression levels following hypoxia (H) and hypoxia/reoxygenation (H/R) with or without rGOT (10 μg/mL) treatment conditions in both cell lines. GAPDH mRNA level was used as a control. Statistical analyses were performed using Student’s two-tailed t test or ordinary one-way ANOVA. Data were presented as means ± standard deviation of ≥3 independent experiments. Values of p < 0.05 were considered as significant. ∗∗∗: p < 0.001, ∗∗: p < 0.01, : p < 0.05. The data were analyzed using SPSS statistical software (v19.0) and GraphPad Prism software (v.8.3.0) for representation of graphs. H, hypoxia; N, normoxia; R, reperfusion; rGOT, recombinant glutamate-oxaloacetate transaminase.

References

    1. Rej R. Measurement of aspartate aminotransferase activity: effects of oxamate. Clin. Chem. 1979;25:555–559. - PubMed
    1. Rej R. Aspartate aminotransferase activity and isoenzyme proportions in human liver tissues. Clin. Chem. 1978;24:1971–1979. - PubMed
    1. Abrego J., Gunda V., Vernucci E., Shukla S.K., King R.J., Dasgupta A., Goode G., Murthy D., Yu F., Singh P.K. GOT1-mediated anaplerotic glutamine metabolism regulates chronic acidosis stress in pancreatic cancer cells. Cancer Lett. 2017;400:37–46. doi: 10.1016/j.canlet.2017.04.029. - DOI - PMC - PubMed
    1. Vijay Kumar K.D.G. Springer; 2018. To Determine Alanine and Aspartate Transaminase Activity in Serum. - DOI
    1. Zhang D., Xiao M., Wang L., Jia W. Blood-Based Glutamate Scavengers Reverse Traumatic Brain Injury-Induced Synaptic Plasticity Disruption by Decreasing Glutamate Level in Hippocampus Interstitial Fluid, but Not Cerebral Spinal Fluid. Neurotox. Res. 2019;35:360–372. doi: 10.1007/s12640-018-9961-8. - DOI - PubMed

LinkOut - more resources