. 2024 Oct 12;27(11):111159.
doi: 10.1016/j.isci.2024.111159. eCollection 2024 Nov 15.

Impacts of low birthweight on kidney development and intergenerational growth of the offspring

Affiliations

Impacts of low birthweight on kidney development and intergenerational growth of the offspring

Akiyo Sekimoto et al. iScience. .

Abstract

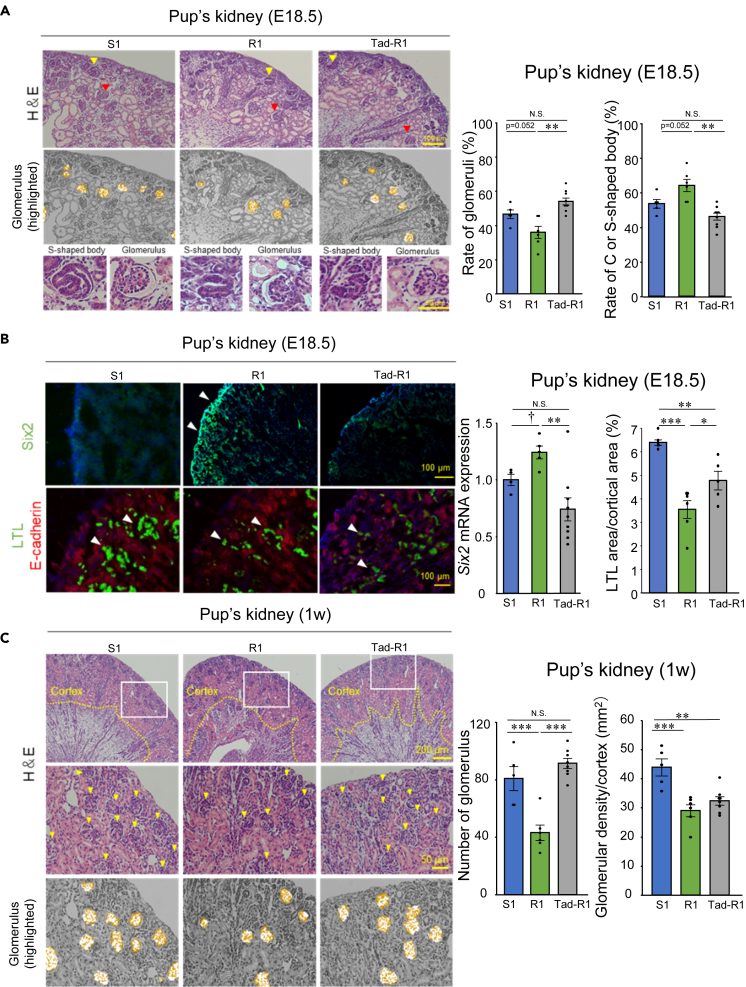
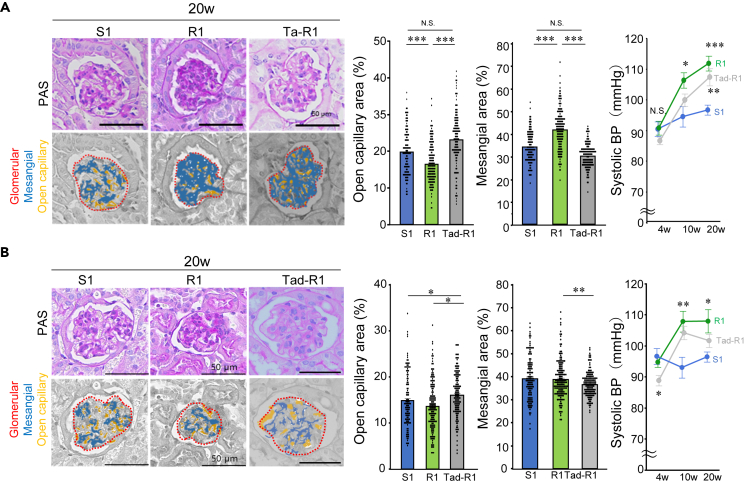
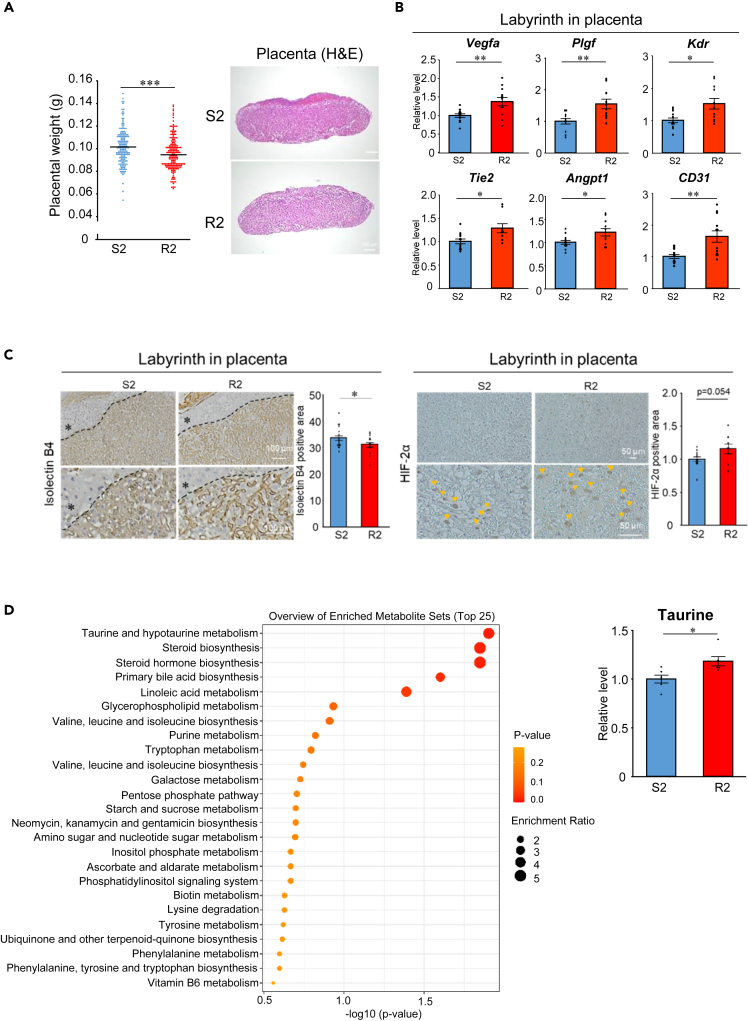
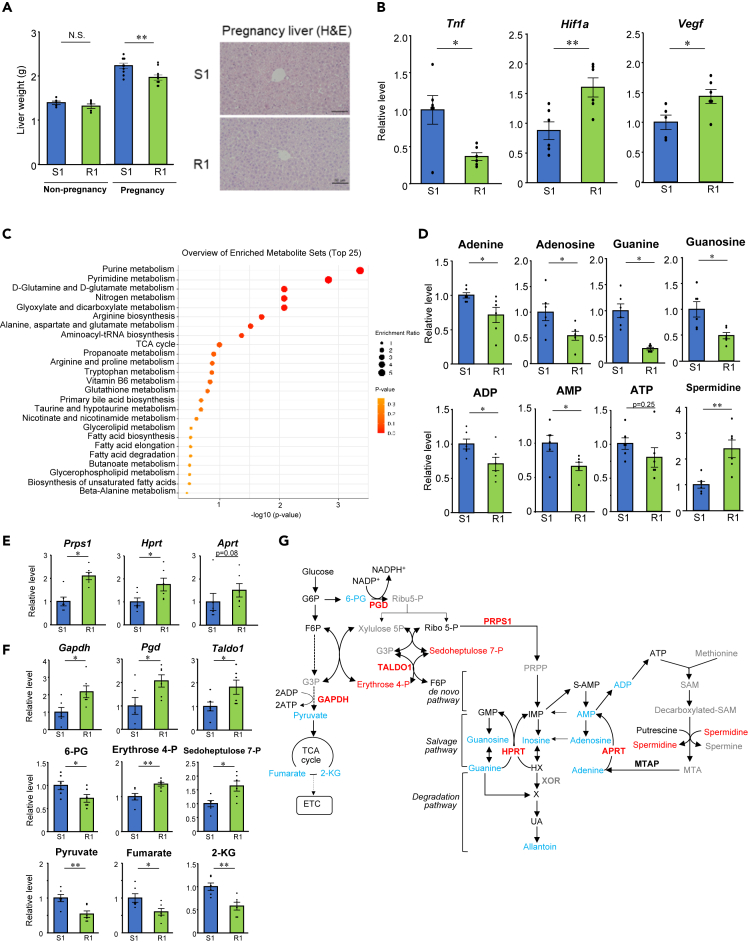
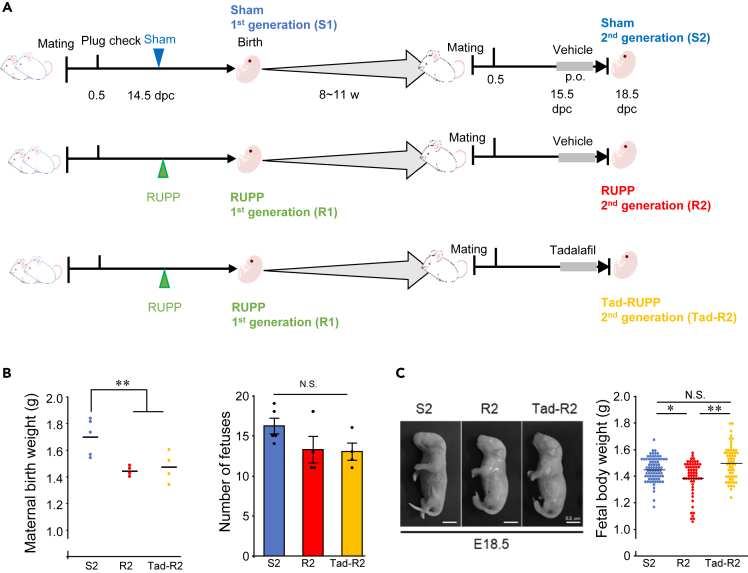
Low birthweight (LBW) increases the risk of adult-onset diseases, including kidney diseases, with intergenerational consequences; however, the underlying mechanisms and effective interventions are unclear. To examine the cross-generational effects of LBW, we established an LBW mouse model through reduced uterine perfusion pressure (RUPP) and investigated the therapeutic potential of tadalafil, a phosphodiesterase 5 inhibitor, on LBW-associated consequences. RUPP-pups (R1) had lower fetal and birth weights, delayed renal development, and fewer glomeruli than Sham-pups. In adulthood, R1 mice exhibited persistently fewer glomeruli and elevated blood pressure, while Tadalafil-R1 mice showed reduced hypertension in both sexes and improved renal pathological changes in males. Additionally, pregnant R1 mice displayed inadequate gestational liver hypertrophy, impaired hepatic purine metabolism, and diminished placental angiogenesis, resulting in fetal growth restriction in the subsequent generation. These findings underscore the lasting impact of LBW on adult health and future generations and suggest tadalafil's potential to mitigate LBW-associated risks.

Keywords: Biological sciences; Metabolomics; Physiology.


Conflict of interest statement

The authors declare that they have no conflicts of interest.

Figures

None
Graphical abstract
Figure 1
Figure 1
Reduced uterine perfusion pressure (RUPP) operation causes lower R1 fetal and birth weights, but maternal tadalafil administration counteracts this (A) Experimental schedule. Fetuses and pups after sham or RUPP operations were designated as sham 1st generation (S1) and RUPP 1st generation (R1), respectively. Tadalafil (10 mg/kg/day) or vehicle (0.5% methyl cellulose 400) was orally administered daily starting the day after the operation. (B) Representative fetal images and comparisons of fetal embryonic day 18.5 (E18.5) and birth weight (day 0). Numbers indicate the number/maternal number of the fetuses or pups. The central line indicates the mean value. Tukey-Kramer’s test; ∗p < 0.05, ∗∗p < 0.01, ∗∗∗p < 0.001. (C) Successive changes in pup body weight from day 0–10 weeks of age. The sample numbers of S1, R1, and Tad-R1 between days 0 and 6 were n = 31, n = 30, and n = 24 males, and n = 27, n = 21, and n = 28 females, respectively. The sample numbers of S1, R1, and Tad-R1 between 1 and 10 weeks were n = 26, n = 25, and n = 22 males, and n = 22, n = 16, and n = 25 females, respectively. Representative images of pups at 1 week (sex unspecified) and 2 weeks (male) of age. Data are shown as the mean ± standard error of the mean. Two-way analysis of variance followed by Bonferroni analysis; ∗p < 0.05, ∗∗p < 0.01, ∗∗∗p < 0.001 (S1 vs. R1), †p < 0.05, ††p < 0.01, †††p < 0.001 (R1 vs. Tad+R1), #p < 0.05 (S1 vs. Tad+R1).
Figure 2
Figure 2
Maternal tadalafil treatment improves fetal renal development (A) Representative images of hematoxylin and eosin (H&E)-stained kidneys on embryonic day (E18.5). ▽(yellow) indicates C- or S-shaped body. ▽(red) indicates glomerulus. Scale bar, 100 μm. The sample numbers of S1, R1, and Tad-R1 were n = 5, n = 6, and n = 8, respectively. (B) Images of Six2-immunoshistochemistry, and lotus tetragonolobus lectin (LTL) (green)/E-cadherin (red) staining in the kidneys of E18.5 fetuses. The sample numbers of S1, R1, and Tad-R1 were n = 4, n = 6, and n = 9, respectively. (C) Images of H&E-stained kidneys from 1-week-old mice. Extended images of the square area in white are shown below. ▽(yellow) indicates glomerulus. The sample numbers of S1, R1, and Tad-R1 were n = 5, n = 6, and n = 8, respectively. Data are shown as the mean ± standard error of mean, Tukey-Kramer’s test; ∗p < 0.05, ∗∗p < 0.01, ∗∗∗p < 0.001. Student’s t test †p < 0.05.
Figure 3
Figure 3
Comparison of glomerular open capillary area, mesangial area, and systolic blood pressure in 20-week-old adult male and female mice (A) Representative periodic acid-Schiff (PAS)-stained kidney sections from 20-week-old adult male mice. Open capillary and mesangial areas at 20-week. Comparison of the mean systolic blood pressure (SBP) at 4, 10, and 20 weeks of age in male mice. Scale bar = 50 μm. The numbers of mice with SBP measured in S1, R1, and Tad-R1 were n = 11, n = 13, and n = 10, respectively. Two-way analysis of variance followed by Bonferroni analysis. ∗p < 0.05, ∗∗p < 0.01. Data are shown as the mean ± standard error of the mean. (B) Representative PAS-stained kidney sections from 20-week-old adult female mice. Open capillary and mesangial areas at 20-week. Scale bar = 50 μm. The numbers of mice with SBP measured in S1, R1, and Tad-R1 were n = 11, n = 12, and n = 10, respectively. Tukey-Kramer’s test or Steel-Dwass test; ∗p < 0.05, ∗∗p < 0.01, ∗∗∗p < 0.001 Student’s t test; †p < 0.05. Data are shown as the mean ± standard error of the mean. N = 120 (S1), 160 (R1), and 140 (Tad-R1) glomeruli were evaluated for the analysis in (A) and (B).
Figure 4
Figure 4
Fetuses from low birthweight female mice have a lower fetal weight (A) Experimental schedule. The fetuses of S1 and R1 were designated as sham 2nd generation (S2) and RUPP 2nd generation (R2), respectively. (B) Maternal (S1 and R1) birth weight. The sample numbers of S1 and R1 were n = 16 and n = 16, respectively. (C) Comparison of the number of fetuses at 13.5 and 18.5 days postcoitum. Data are shown as the mean ± standard error of the mean. (D and E) Representative images of the fetus and comparison of the fetal weight and fetal weight/placental weight ratio at embryonic day (E)13.5 and E18.5. The sample numbers of S2 and R2 on E13.5 were n = 223, and n = 223, respectively. The sample numbers of S2 and R2 on E18.5 were n = 222, and n = 210, respectively. Student’s t test; ∗p < 0.05, ∗∗p < 0.01. The central line indicates the mean value.
Figure 5
Figure 5
Angiogenesis defects in the placenta of low birth weight female mice (A) Placental weight and images of hematoxylin and eosin (H&E)-stained placentas of the S2 and R2 mice (18.5 days postcoitum). The sample numbers of S2 and R2 were n = 184, and n = 170, respectively. The central line indicates the mean value. (B) Expression of genes related to angiogenic factors in the placental labyrinth on embryonic day 13.5 (E13.5). The sample numbers of S2 and R2 were n = 12, and n = 12, respectively. (C) Isolectin B4 and HIF-2α immunostaining of placental sections at E18.5. The lower panels show magnified images of the upper panels. ∗ Indicates junctional zones. The isolectin B4 staining sample numbers of S2 and R2 were n = 18, and n = 16, respectively. The HIF-2α sample numbers of S2 and R2 were n = 11, and n = 12, respectively. (D) Enrichment analysis of the metabolomics dataset of the placental labyrinth at E13.5. Comparison of taurine levels in the labyrinth at E13.5. The sample numbers of S2 and R2 were n = 6, and n = 6, respectively. Data are shown as the mean ± standard error of the mean. Student’s t test; ∗p < 0.05, ∗∗p < 0.01, ∗∗∗p < 0.001.
Figure 6
Figure 6
Changes in purine metabolism in the liver of low birthweight female mice during pregnancy (A) Liver weights of S1 and R1 mice at 10 weeks of age (not pregnant) and 18.5 days post coitm (dpc; pregnant). Images of hematoxylin and eosin (H&E)-stained livers from pregnant mice. The sample numbers of non-pregnant S1 and R1 were n = 5 and n = 5, respectively. The sample numbers of pregnant S1 and R1 were n = 16, and n = 16 respectively. (B) Gene expression levels of Tnf (13.5 dpc), Hif1a (18.5 dpc), and Vegf (18.5 dpc) in the livers of the pregnant S1 and R1 mice. Expression levels were normalized using Rps18. The sample numbers of S1 and R1 were n = 6, and n = 6 respectively. (C) Enrichment analysis of metabolite sets in the livers of the pregnant mice at 18.5 dpc. The sample numbers of S1 and R1 were n = 6 and n = 6, respectively. (D) Levels of purine metabolites and polyamines in the livers of S1 and R1 at 18.5 dpc. The sample numbers of S1 and R1 were n = 6 and n = 6, respectively. (E) Gene expression levels of Prps1, Hprt, and Aprt, which are involved in purine synthesis, in the livers of the pregnant mice (18.5 dpc). The sample numbers of S1 and R1 were n = 6 and n = 6, respectively. (F) Gene expression levels of Gapdh, Pgd, and Taldo1, which are involved in glycolysis and the pentose phosphate pathway. Metabolic pathways and the levels of the measured metabolites involved in glycolysis, the pentose phosphate pathway, the TCA cycle, and purine metabolism in the livers of the pregnant mice (18.5dpc). The sample numbers of S1 and R1 were n = 6 and n = 6, respectively. Data are shown as the mean ± standard error of the mean. Student’s t test; ∗p < 0.05, ∗∗p < 0.01. (G) Metabolic pathway changes assumed in the liver during R1 pregnancy. Metabolites in blue letters indicate a decrease, and metabolites or gene expression in red letters indicate an increase.
Figure 7
Figure 7
Tadalafil ameliorated smaller fetal weight in low birthweight female mice (A) Experimental schedule. Female S1 and R1 mice were born spontaneously after the sham or RUPP surgery. The fetuses of S1 or R1 are designated as sham 2nd generation (S2) and RUPP 2nd generation (R2), respectively. Half of the S1 and R1 mice were orally administered tadalafil (10 mg/kg/day) daily starting from 15.5 dpc. The remaining S1 and R1 pregnant mice were orally administered 0.5% methyl cellulose 400 daily starting from 15.5 dpc. Mice were dissected at 18.5 dpc and fetal weights at embryonic day 18.5 (E18.5) and placental weights were recorded. (B) Maternal birth weight (S1, R1, and Tad-R1). The maternal sample numbers of S2, R2, and Tad-R2 were n = 5, n = 4, and n = 4, respectively. Data are shown as the mean ± standard error of the mean. Student’s t test; ∗∗p < 0.01. (C) Representative (E18.5) fetal images. Comparison of the fetal weights. The sample numbers of S2, R2, and Tad-R2 were n = 79, n = 57, and n = 58, respectively. The central line indicates the mean value. Steel-Dwass test; ∗p < 0.05, ∗∗p < 0.01.
Figure 8
Figure 8
Long-term impact of low birthweight mice and the subsequent effects on offspring Maternal mice subjected to RUPP operation give rise to low birthweight (LBW) pups with fetal growth restriction. The pups exhibit immature kidney development, with reduced glomerular count, glomerular damage, and elevated systolic blood pressure in adulthood. However, administration of tadalafil to the mother prevents these LBW-associated adverse effects. Furthermore, when LBW pups mature and become pregnant, they present with insufficient liver hypertrophy and placental developmental defects, leading to compromised fetal growth in the next generation.

References

    1. World Health Organization . 2022. International classification of diseases, eleventh revision ICD-11. Relatório técnico.
    1. Okwaraji Y.B., Krasevec J., Bradley E., Conkle J., Stevens G.A., Gatica-Domínguez G., Ohuma E.O., Coffey C., Estevez Fernandez D.G., Blencowe H., et al. National, regional, and global estimates of low birthweight in 2020, with trends from 2000: a systematic analysis. Lancet. 2024;403:1071–1080. doi: 10.1016/S0140-6736(23)01198-4. - DOI - PubMed
    1. Imura H. Life course health care and preemptive approach to non-communicable diseases. Proc. Jpn. Acad. Ser. B Phys. Biol. Sci. 2013;89:462–473. doi: 10.2183/pjab.89.462. - DOI - PMC - PubMed
    1. Vikse B.E., Irgens L.M., Leivestad T., Hallan S., Iversen B.M. Low birth weight increases risk for end-stage renal disease. J. Am. Soc. Nephrol. 2008;19:151–157. doi: 10.1681/ASN.2007020252. - DOI - PMC - PubMed
    1. White S.L., Perkovic V., Cass A., Chang C.L., Poulter N.R., Spector T., Haysom L., Craig J.C., Salmi I.A., Chadban S.J., Huxley R.R. Is low birth weight an antecedent of CKD in later life? A systematic review of observational studies. Am. J. Kidney Dis. 2009;54:248–261. doi: 10.1053/j.ajkd.2008.12.042. - DOI - PubMed

LinkOut - more resources