

Genetic dissection of growth trajectories in forest trees: From FunMap to FunGraph
- PMID: 39524511
- PMCID: PMC11524299
- DOI: 10.48130/FR-2021-0019
Genetic dissection of growth trajectories in forest trees: From FunMap to FunGraph
Abstract
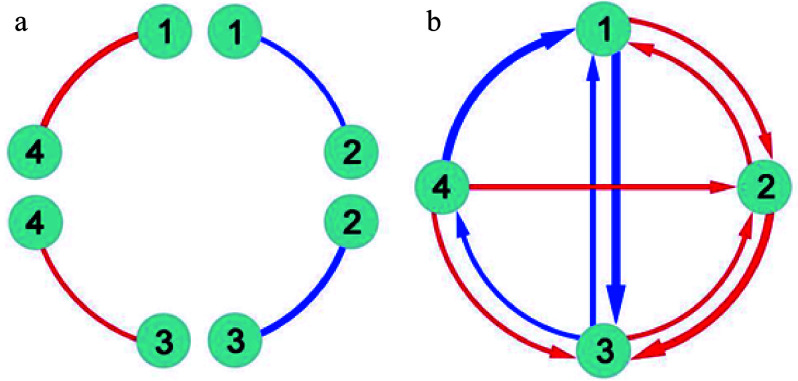
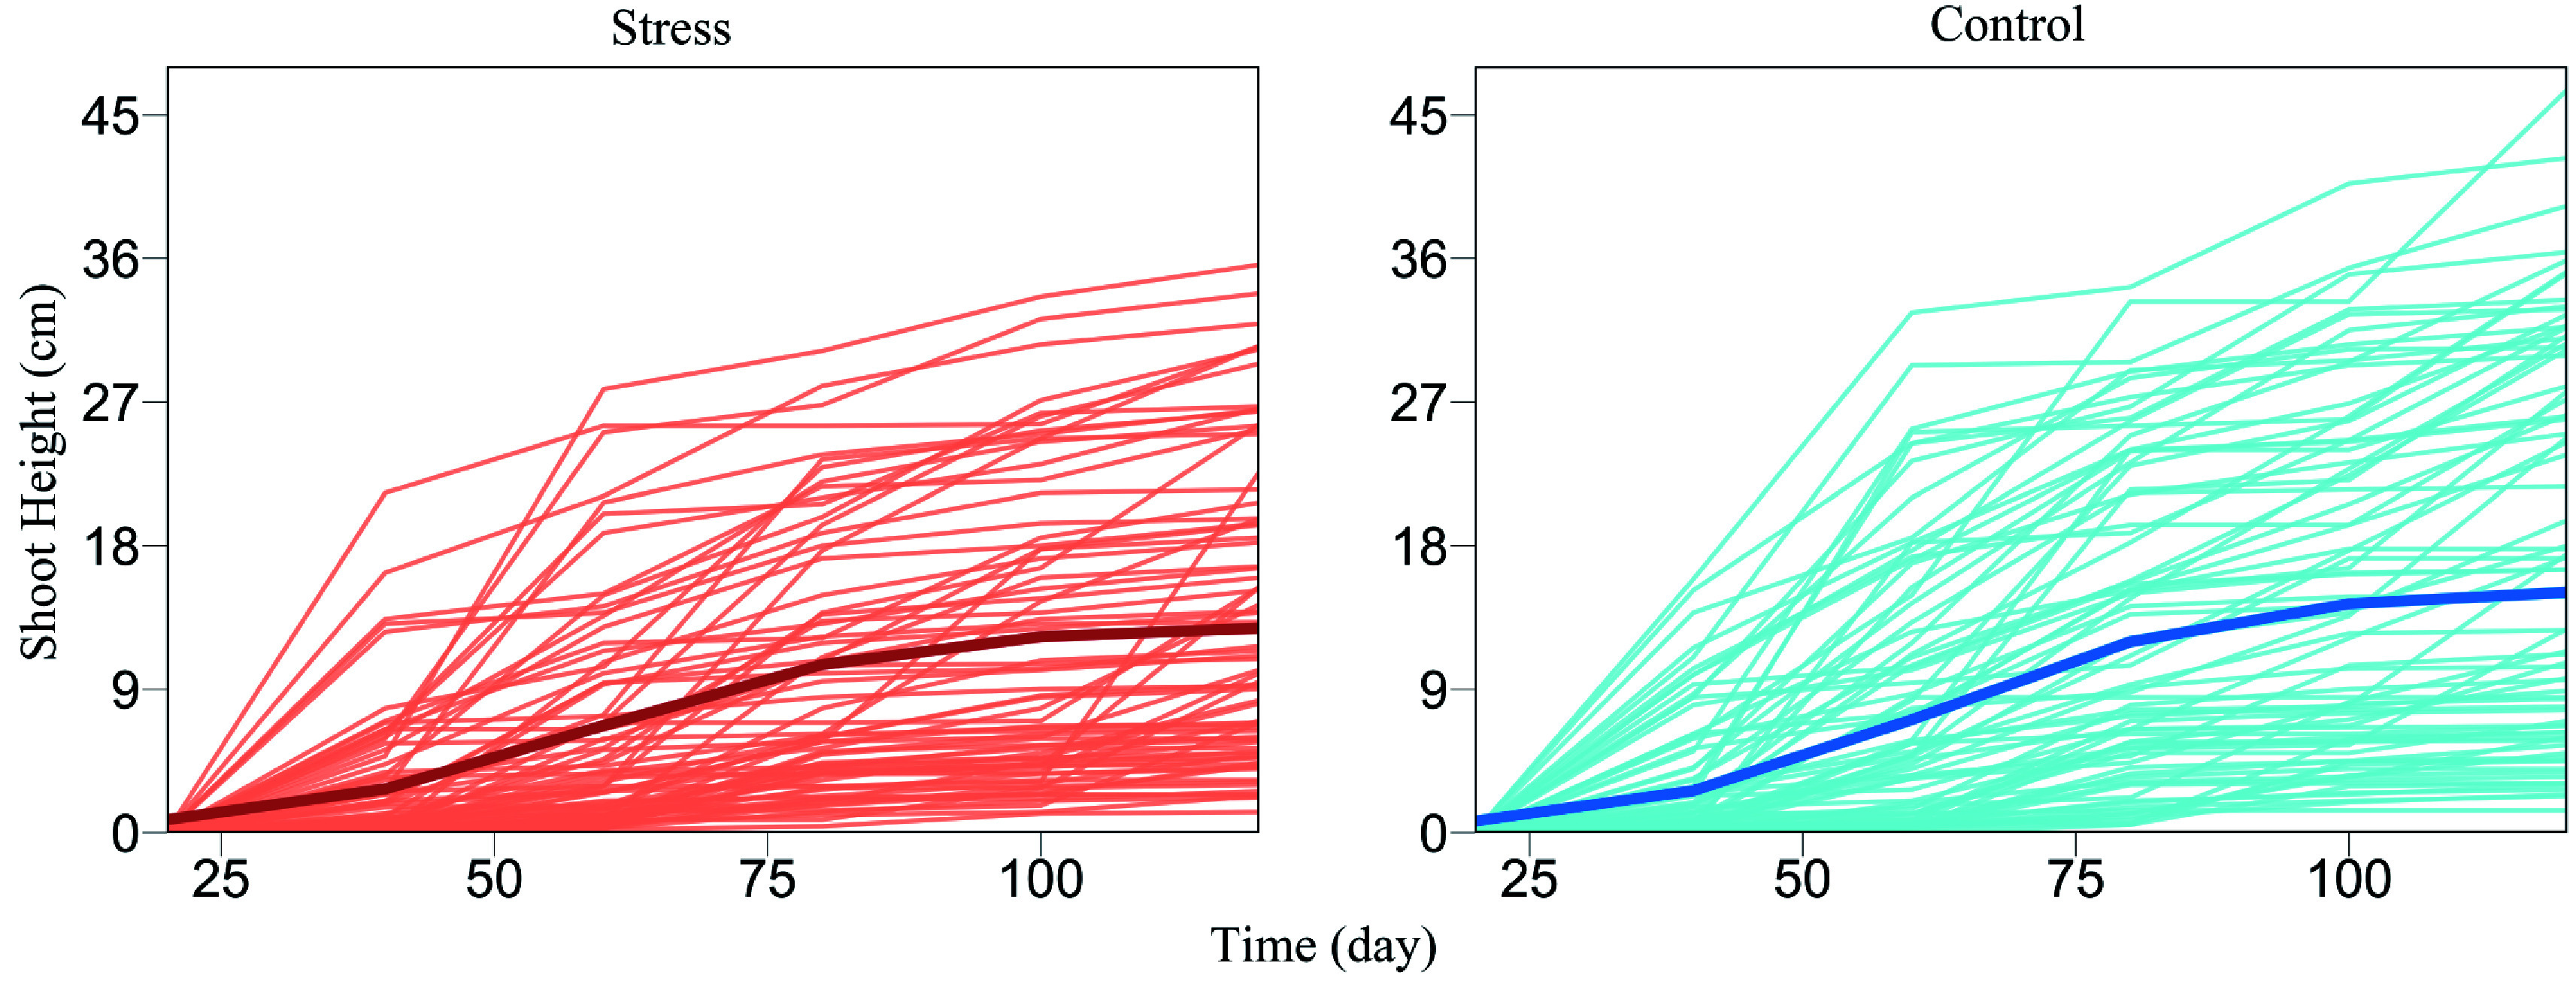
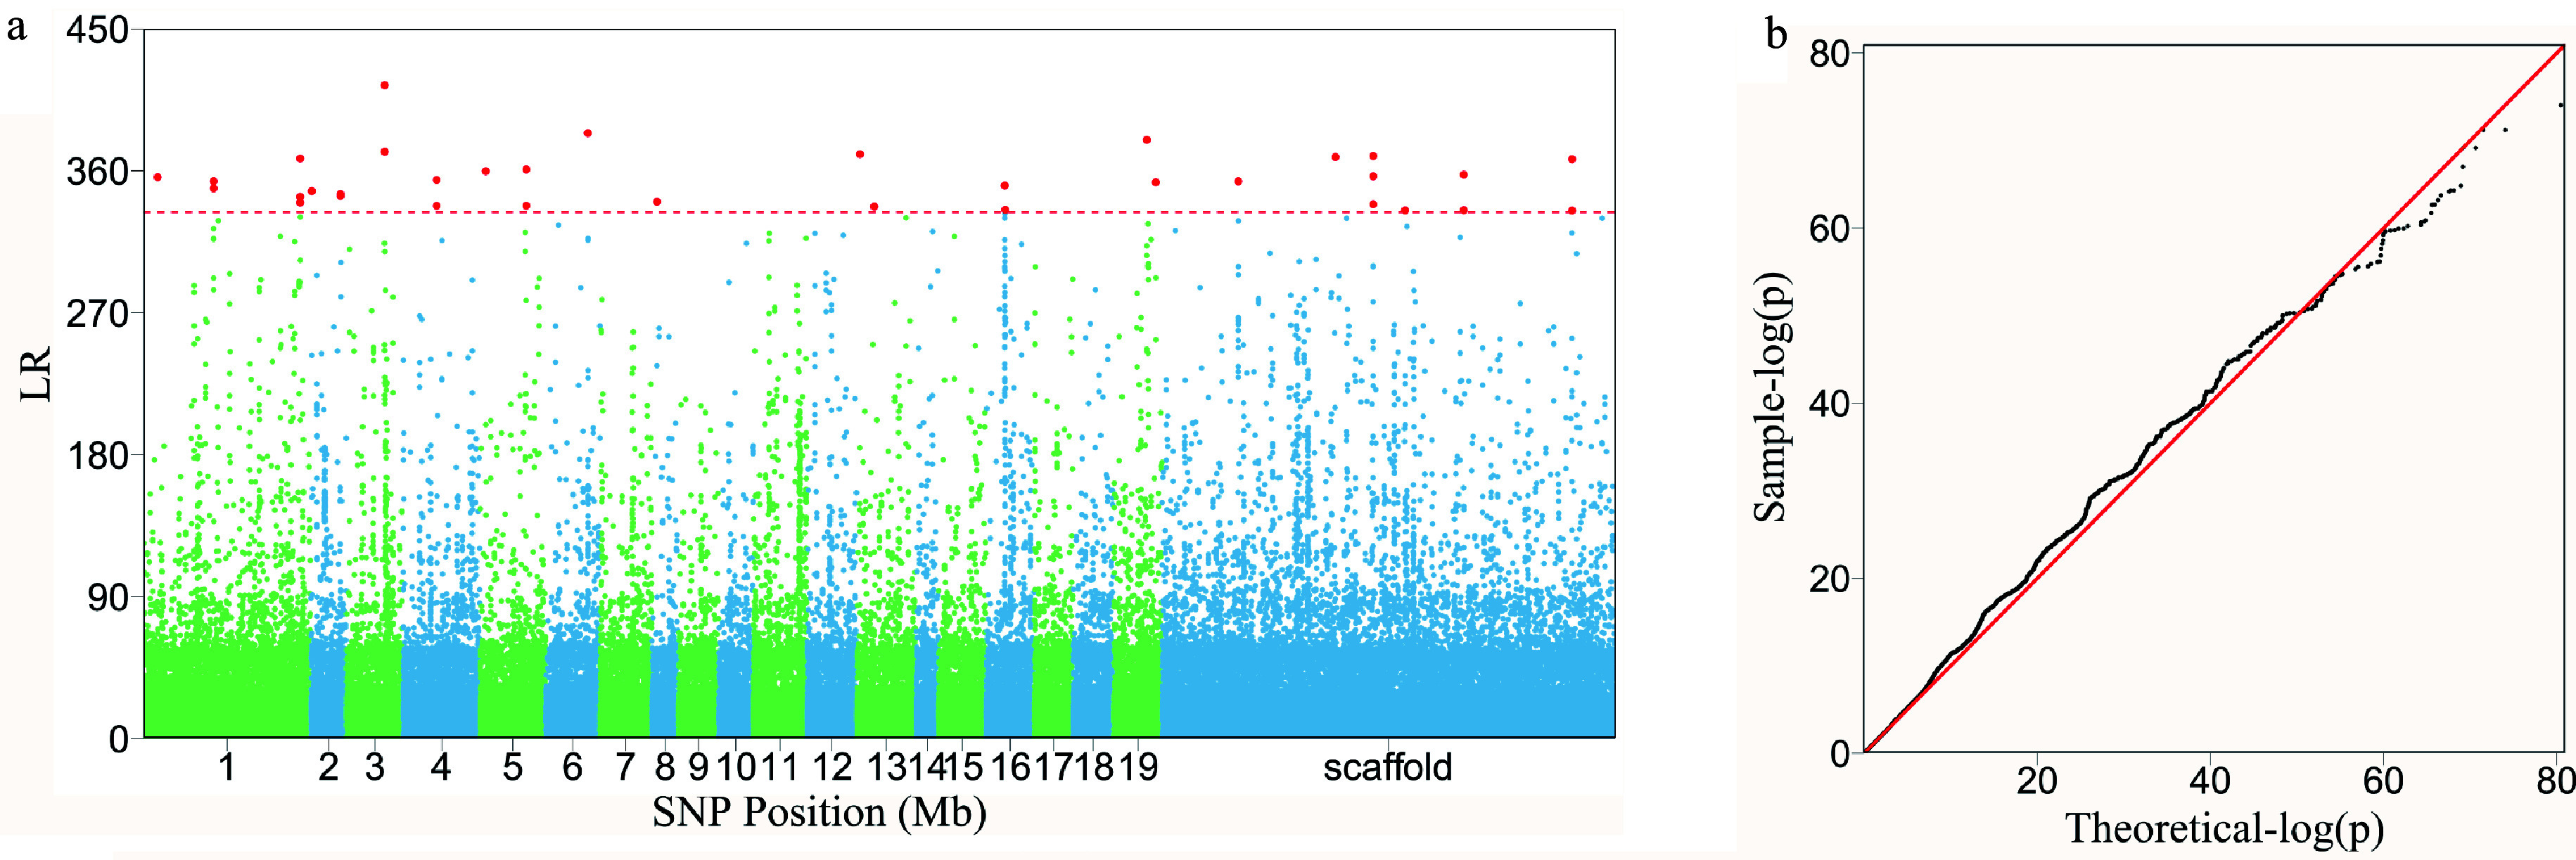
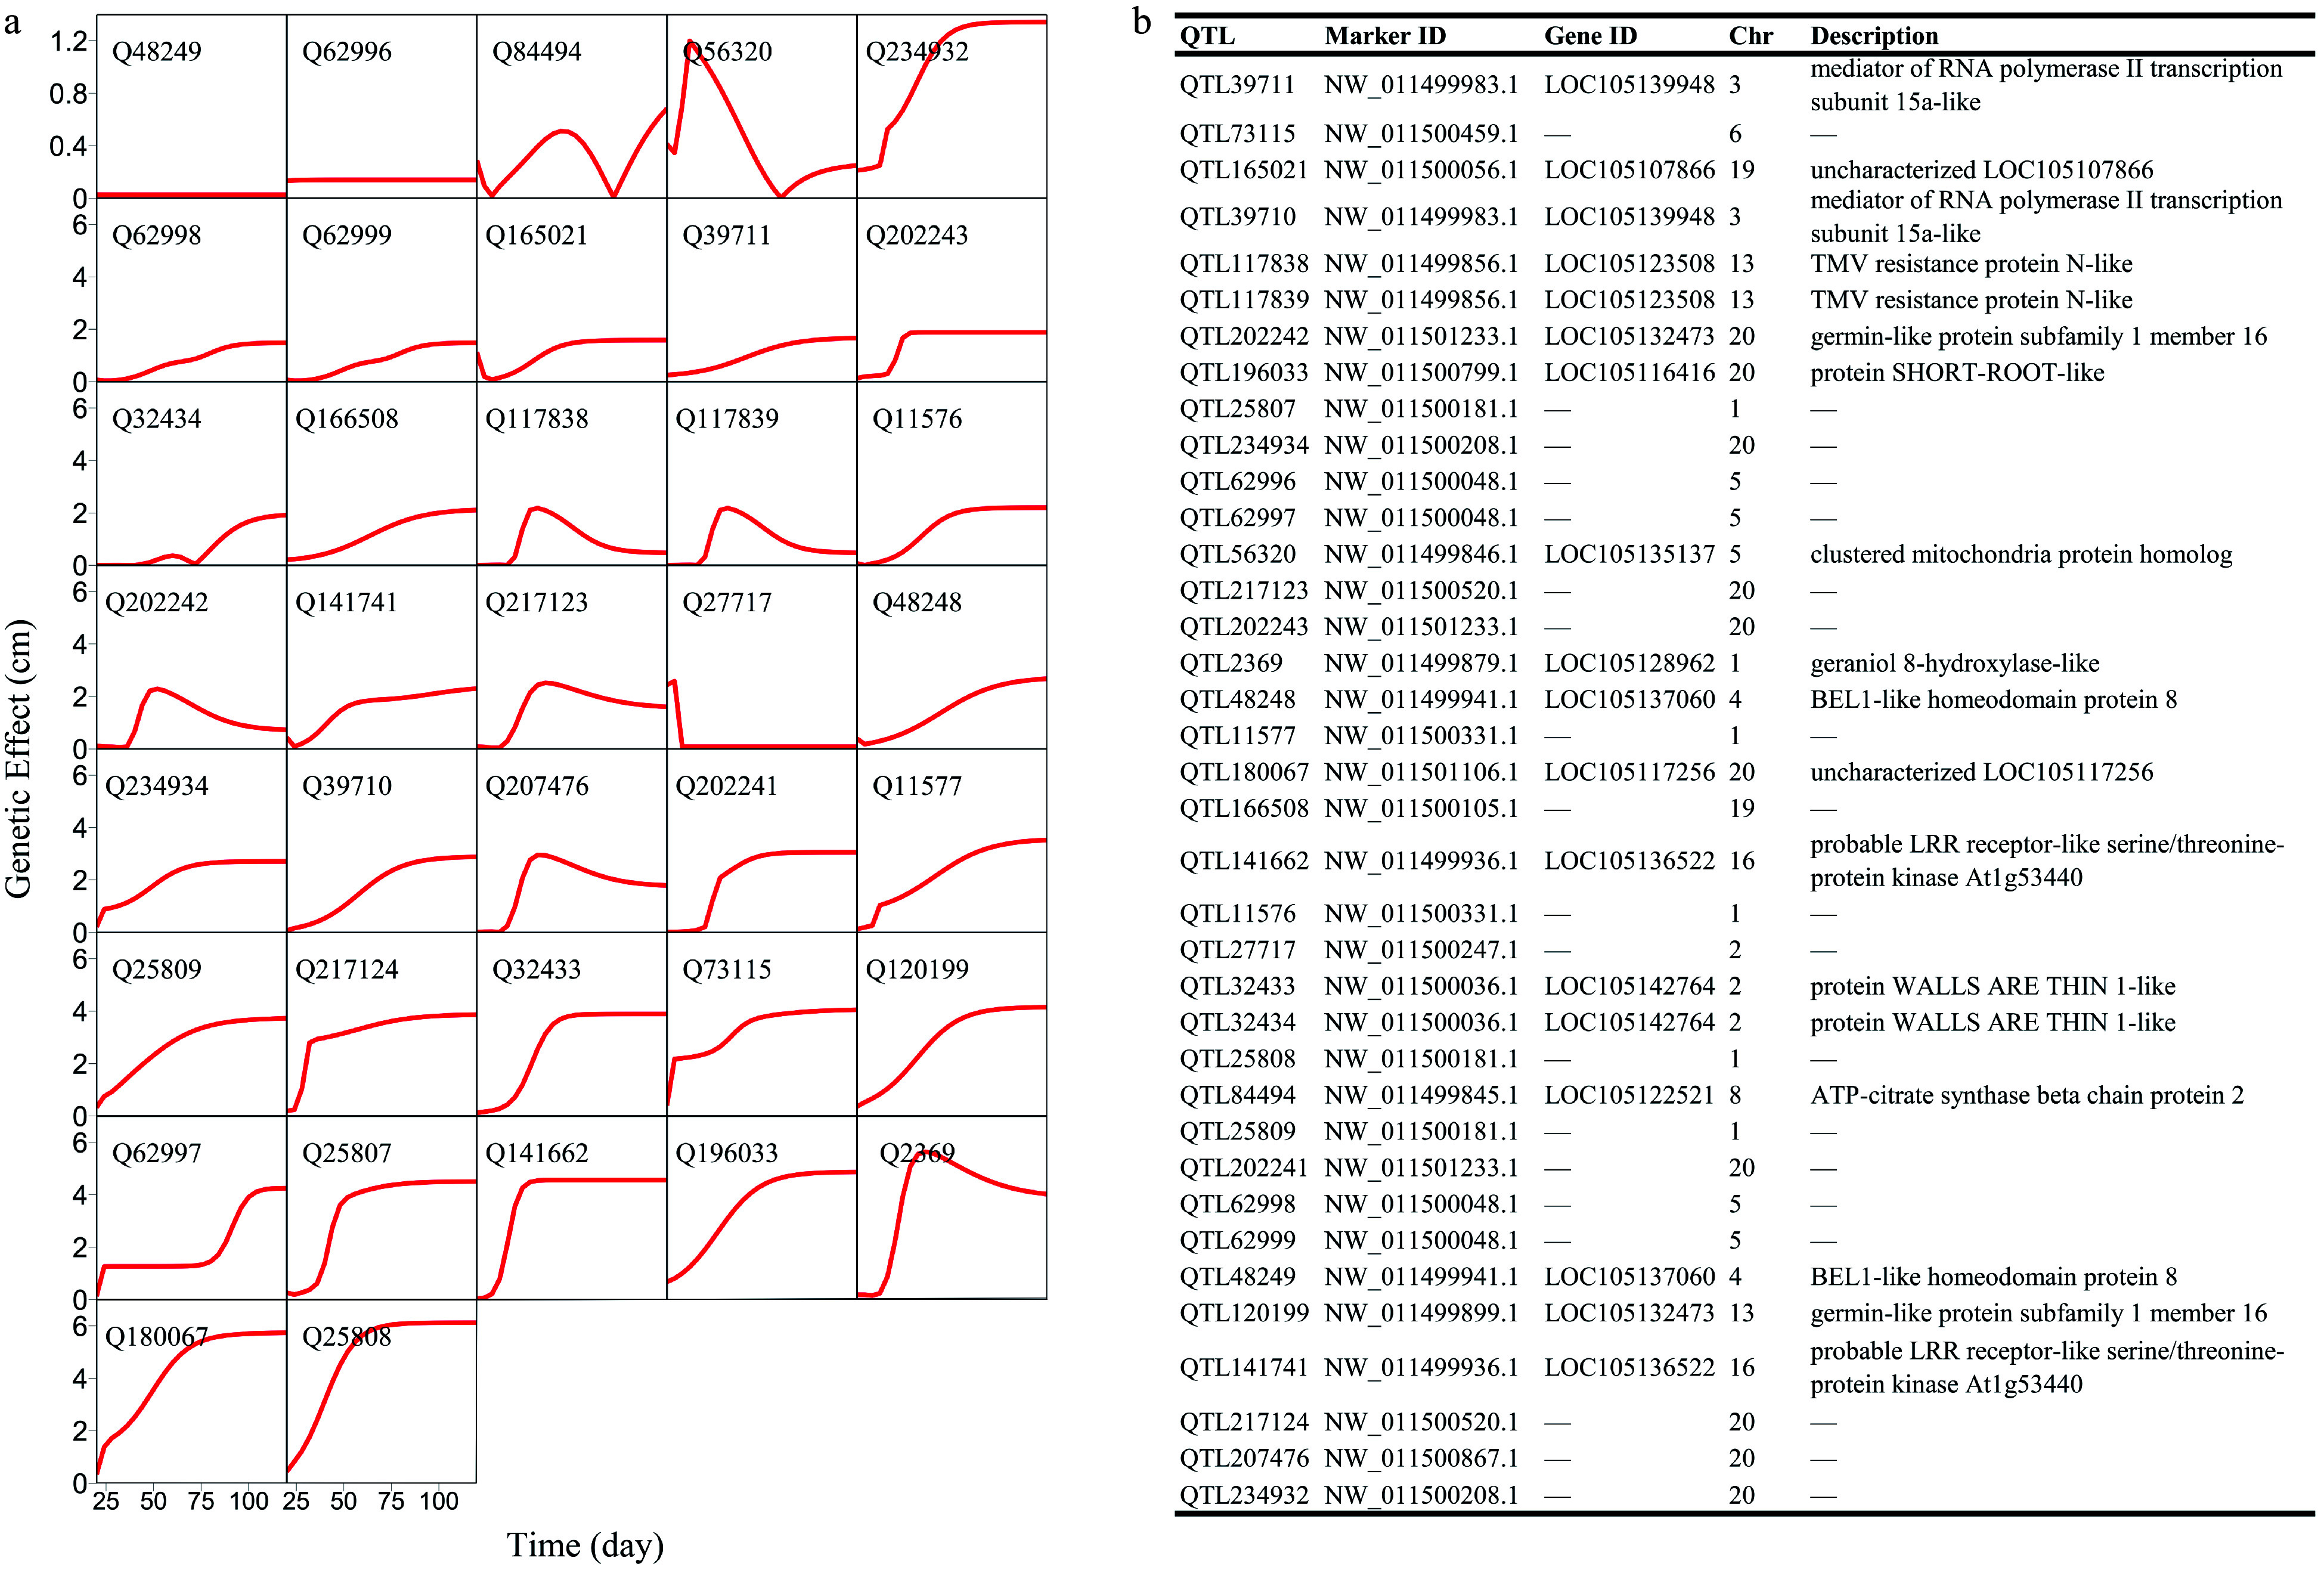
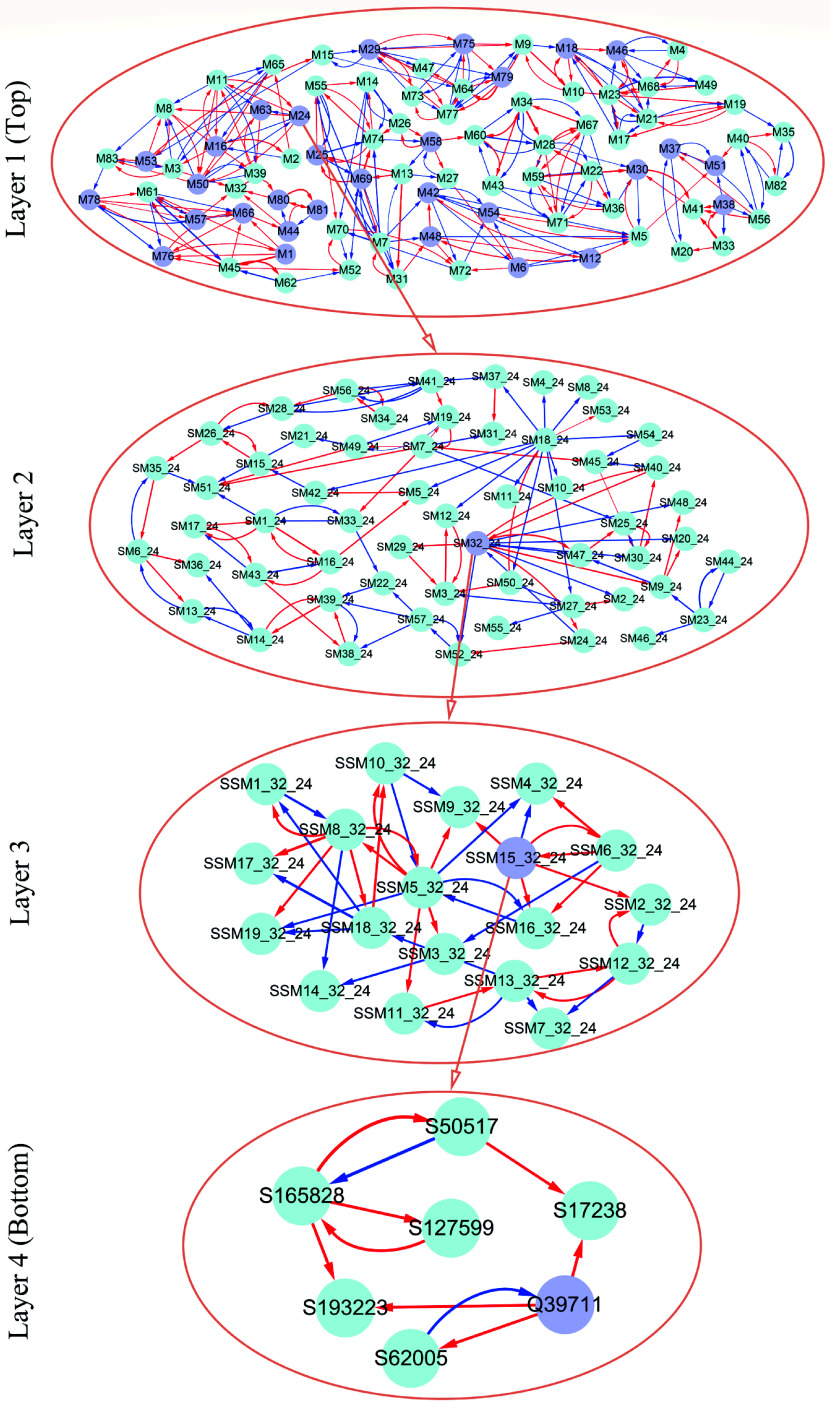
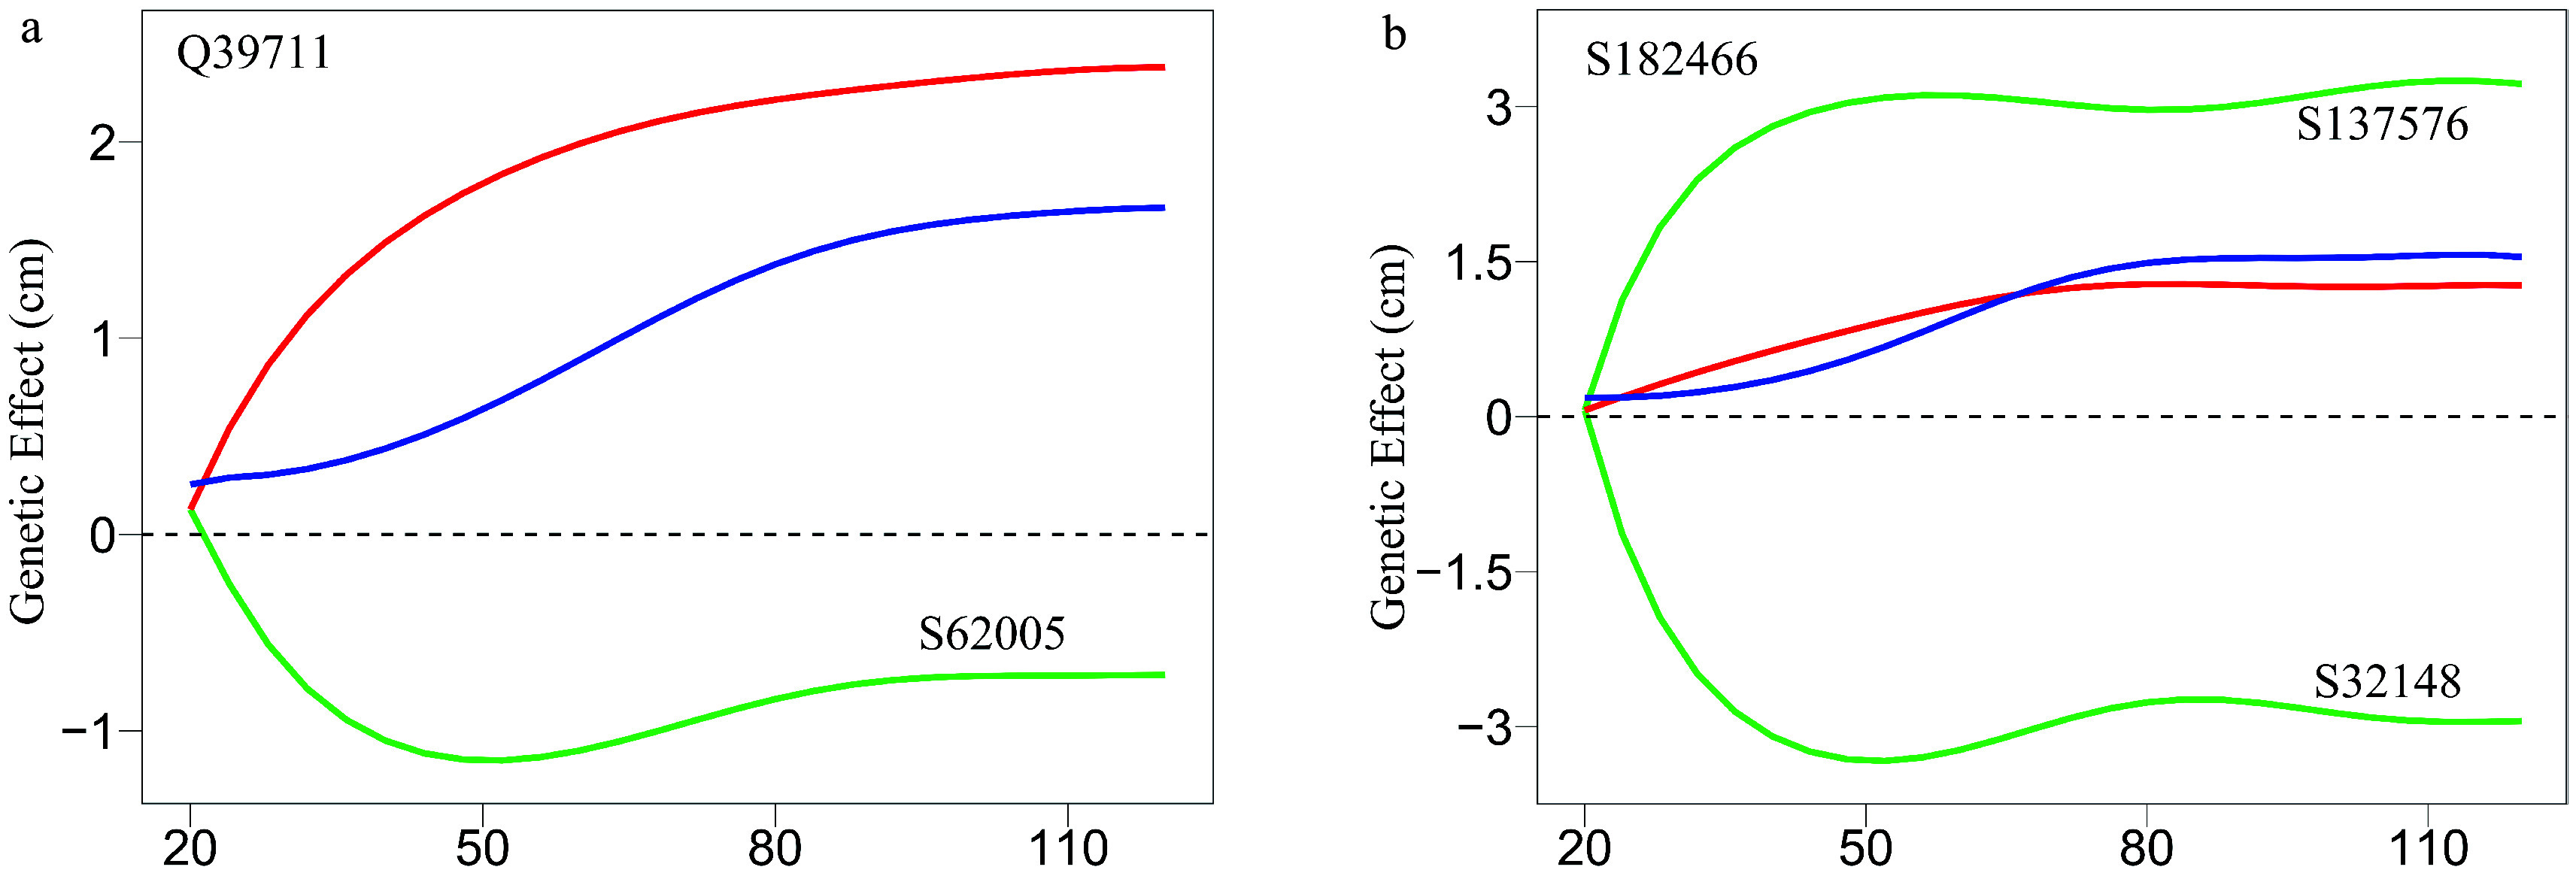
Growth is the developmental process involving important genetic components. Functional mapping (FunMap) has been used as an approach to map quantitative trait loci (QTLs) governing growth trajectories by incorporating growth equations. FunMap is based on reductionism thinking, with a power to identify a small set of significant QTLs from the whole pool of genome-wide markers. Yet, increasing evidence shows that a complex trait is controlled by all genes the organism may possibly carry. Here, we describe and demonstrate a different mapping approach that encapsulates all markers into genetic interaction networks. This approach, symbolized as FunGraph, combines functional mapping, evolutionary game theory, and prey-predator theory into mathematical graphs, allowing the observed genetic effect of a locus to be decomposed into its independent component (resulting from this locus' intrinsic capacity) and dependent component (due to extrinsic regulation by other loci). Using FunGraph, we can visualize and trace the roadmap of how each locus interact with every other locus to impact growth. In a population-based association study of Euphrates poplar, we use FunGraph to identify the previously neglected genetic interaction effects that contribute to the genetic architecture of juvenile stem growth. FunGraph could open up a novel gateway to comprehend the global genetic control mechanisms of complex traits.
Keywords: Forest tree; Functional graphing; Functional mapping; Genetic architecture; Growth; Growth equation.
Conflict of interest statement
The authors declare that they have no conflict of interest.
Figures
Similar articles
-
A dissection model for mapping complex traits.Plant J. 2019 Mar;97(6):1168-1182. doi: 10.1111/tpj.14185. Epub 2019 Feb 12. Plant J. 2019. PMID: 30536697
-
FunGraph: A statistical protocol to reconstruct omnigenic multilayer interactome networks for complex traits.STAR Protoc. 2021 Dec 4;2(4):100985. doi: 10.1016/j.xpro.2021.100985. eCollection 2021 Dec 17. STAR Protoc. 2021. PMID: 34927094 Free PMC article.
-
Genetic architecture of growth traits in Populus revealed by integrated quantitative trait locus (QTL) analysis and association studies.New Phytol. 2016 Feb;209(3):1067-82. doi: 10.1111/nph.13695. Epub 2015 Oct 26. New Phytol. 2016. PMID: 26499329
-
A personalized pharmaco-epistatic network model of precision medicine.Drug Discov Today. 2023 Jul;28(7):103608. doi: 10.1016/j.drudis.2023.103608. Epub 2023 May 4. Drug Discov Today. 2023. PMID: 37149282 Review.
-
Functional mapping - how to map and study the genetic architecture of dynamic complex traits.Nat Rev Genet. 2006 Mar;7(3):229-37. doi: 10.1038/nrg1804. Nat Rev Genet. 2006. PMID: 16485021 Review.
References
-
-
Thompson DW, Bainbridge D. 1917. On growth and form. Cambridge, UK: Cambridge University Press
-
-
- Medawar PB The 'laws' of biological growth. Nature. 1941;148:772–74. doi: 10.1038/148772a0. - DOI
-
- Zeide B Analysis of growth equations. Forest Science. 1993;39:594–616. doi: 10.1093/forestscience/39.3.594. - DOI
Publication types
LinkOut - more resources
Full Text Sources