

Diagnostic accuracy of the lactate stress test for detecting mitochondrial disorders: Systematic review and meta-analysis
- PMID: 39524711
- PMCID: PMC11550639
- DOI: 10.1016/j.heliyon.2024.e39648
Diagnostic accuracy of the lactate stress test for detecting mitochondrial disorders: Systematic review and meta-analysis
Abstract
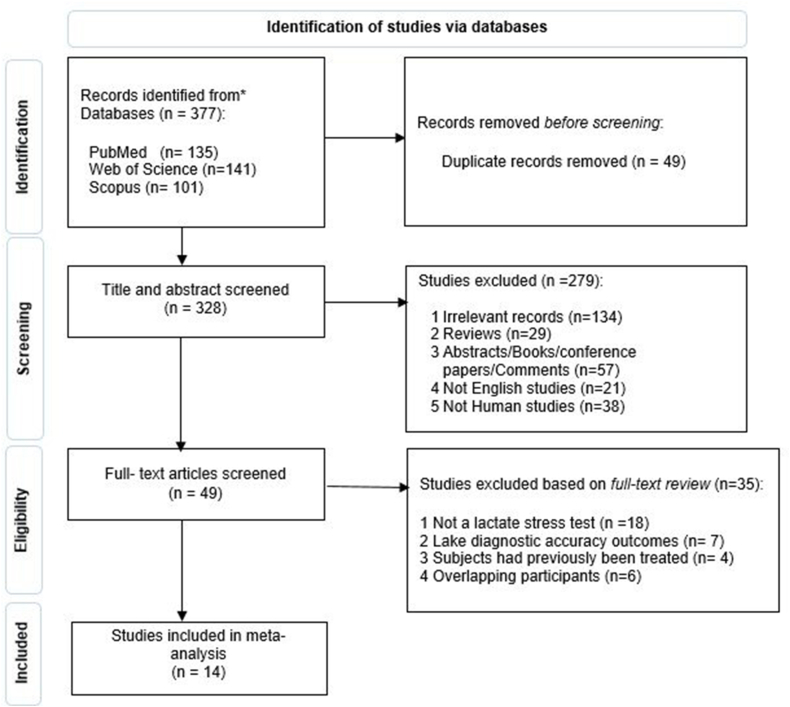
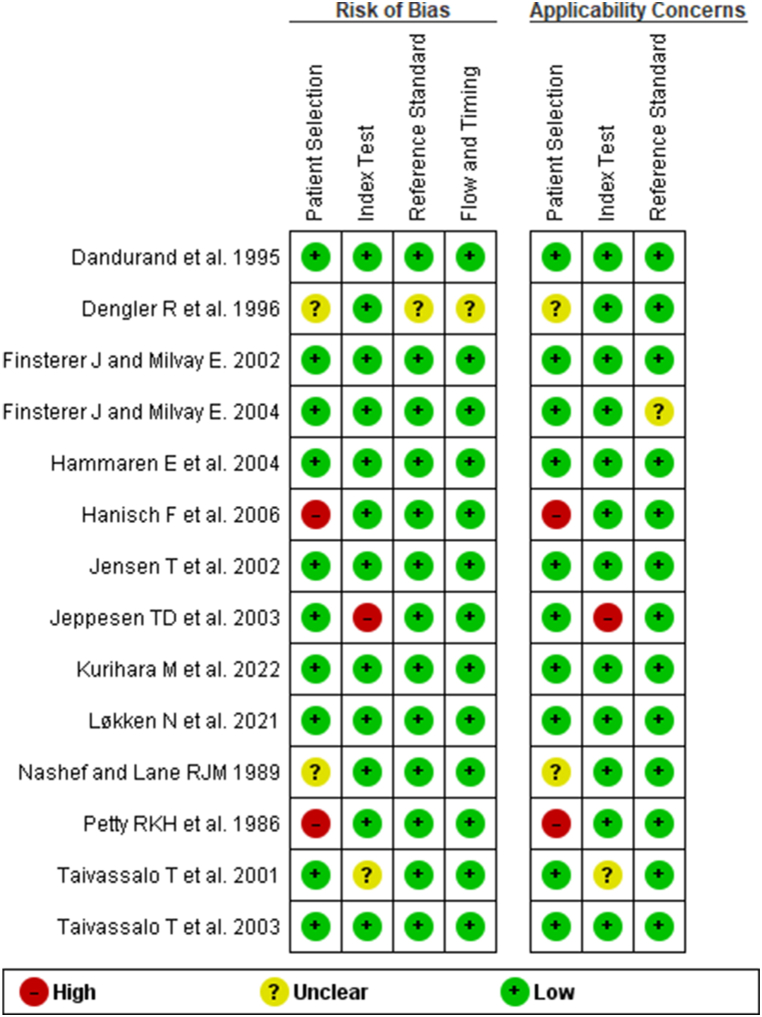
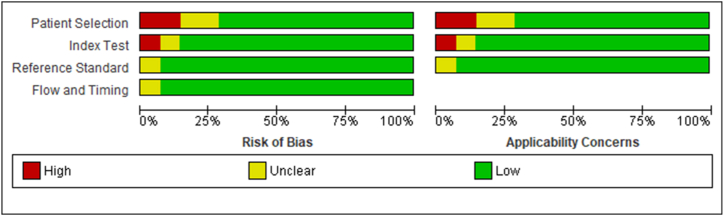
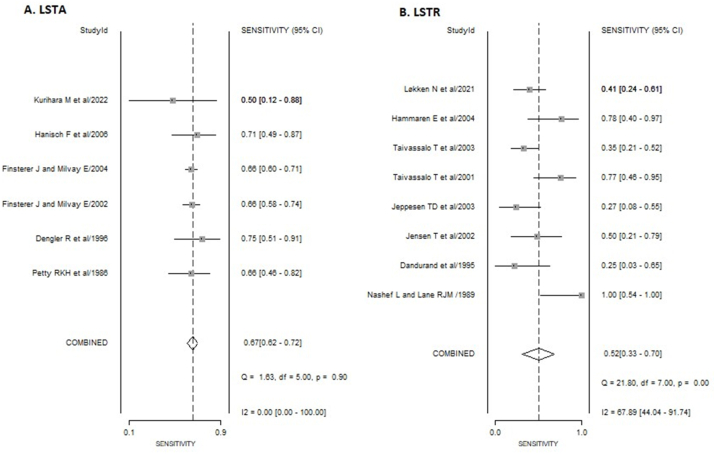
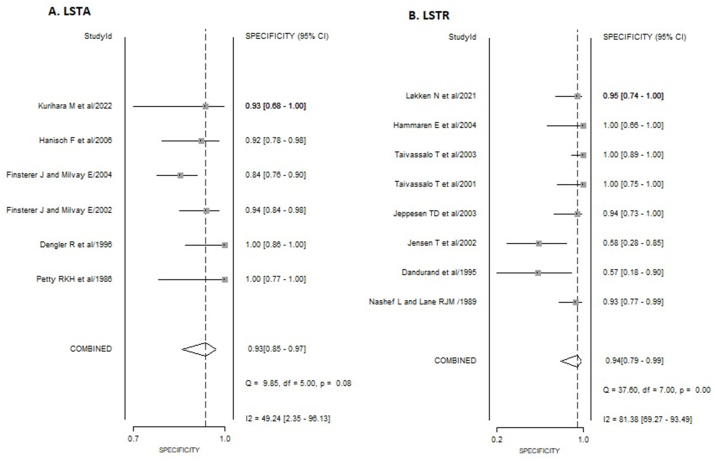
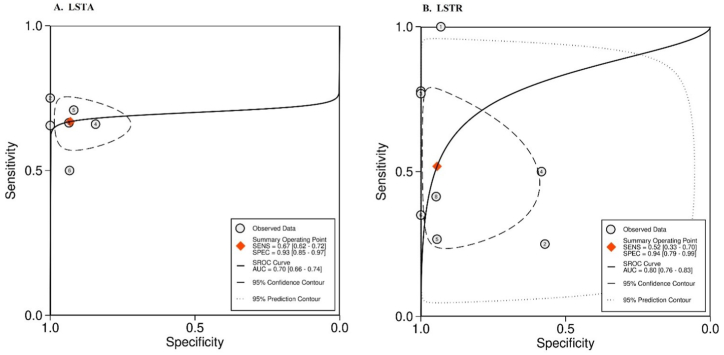
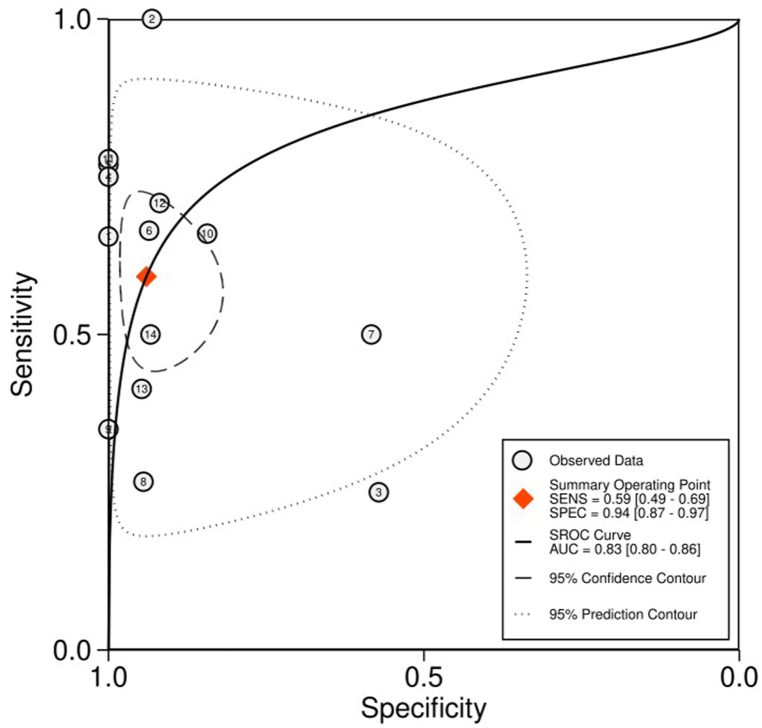
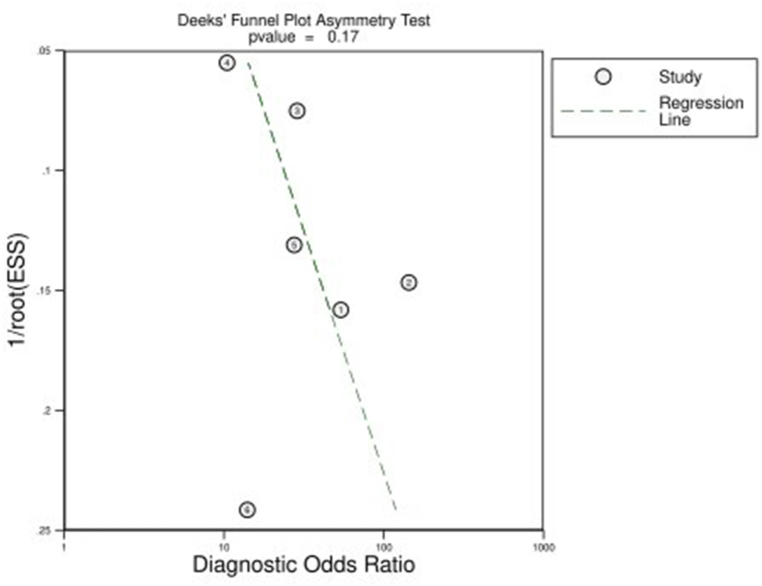
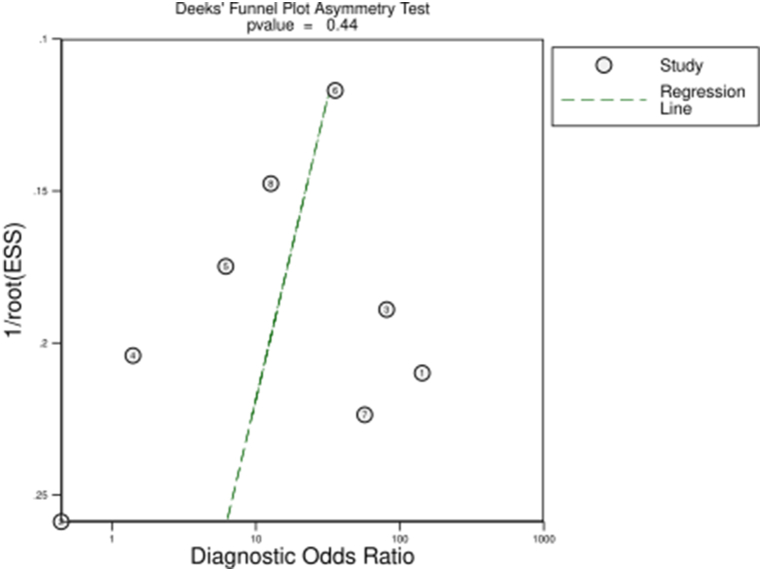
Due to their variable phenotypes, mitochondrial disorders (MDs) can be difficult to diagnose. The absolute load lactate stress test (LSTA) and the relative load lactate stress test (LSTR) have been shown to be useful screening tools for the detection of MDs. In this study, we aimed to perform a meta-analysis to evaluate the diagnostic accuracy of these tests in detecting MDs. The study protocol was registered with PROSPERO (no. CRD42022331710). We performed a comprehensive search of PubMed, Web of Science and Scopus from January 10th, 2022 to July 27th, 2022 and included case-control and cohort diagnostic studies that targeted participants with MDs and used LSTA and/or LSTR as index tests. Two reviewers worked separately to compile information from selected articles. Risk of bias and applicability were assessed using the QUADAS-2 tool. Sensitivity and specificity, as well as diagnostic odds ratios (DORs) and area under the curve (AUC) were calculated using Meta-DiSc 2.0 and Stata software. The analysis included 14 studies with a total of 1064 participants, divided into six studies with 793 participants for LSTA and eight studies with 271 participants for LSTR. For LSTA the meta-analysis gave a pooled sensitivity of 0.67 (95 % CI 0.62, 0.72), a specificity of 0.93 (95 % CI 0.85, 0.97), DOR of 26.63 (95 % CI 10.99, 64.52), and AUC of 0.70 (95 % CI 0.66, 0.74). For LSTR, the pooled sensitivity was 0.52 (95 % CI 0.33, 0.70), specificity 0.94 (95 % CI 0.79, 0.99), DOR 18.14 (95 % CI 2.99, 109.85), and the AUC 0.80 (95 % CI 0.76, 0.83). LSTA and LSTR showed as screening tests moderate sensitivity and high specificity for MD diagnosis, particularly for LSTR. The choice of test may depend on the patient's individual aerobic capacity and motor skills and the availability of equipment.
Keywords: Absolute load lactate stress test; Diagnostic accuracy; Meta-analysis; Mitochondrial disorders; Relative load lactate stress test.
© 2024 The Authors. Published by Elsevier Ltd.
Conflict of interest statement
The authors declare that they have no known competing financial interests or personal relationships that could have appeared to influence the work reported in this paper.
Figures
Similar articles
-
Diagnostic yield of the lactate stress test in respiratory chain disorders under absolute and relative workload.J Neurosci Methods. 2001 Jul 15;108(1):65-70. doi: 10.1016/s0165-0270(01)00371-5. J Neurosci Methods. 2001. PMID: 11459619
-
Diagnostic Accuracy of Artificial Intelligence Compared to Biopsy in Detecting Early Oral Squamous Cell Carcinoma: A Systematic Review and Meta Analysis.Asian Pac J Cancer Prev. 2024 Aug 1;25(8):2593-2603. doi: 10.31557/APJCP.2024.25.8.2593. Asian Pac J Cancer Prev. 2024. PMID: 39205556 Free PMC article.
-
Accuracy of FGF-21 and GDF-15 for the diagnosis of mitochondrial disorders: A meta-analysis.Ann Clin Transl Neurol. 2020 Jul;7(7):1204-1213. doi: 10.1002/acn3.51104. Epub 2020 Jun 25. Ann Clin Transl Neurol. 2020. PMID: 32585080 Free PMC article.
-
Diagnostic value of neutrophil gelatinase-associated lipocalin for early diagnosis of cardiac surgery-associated acute kidney injury: a meta-analysis.Eur J Cardiothorac Surg. 2016 Mar;49(3):746-55. doi: 10.1093/ejcts/ezv199. Epub 2015 Jun 20. Eur J Cardiothorac Surg. 2016. PMID: 26094017 Review.
-
Diagnostic Accuracy of Contrast Enhanced Computed Tomography (CECT) in Cervical Lymph Node Metastasis of Oral Carcinoma: A Systematic Review and Meta-Analysis.Asian Pac J Cancer Prev. 2024 Aug 1;25(8):2615-2623. doi: 10.31557/APJCP.2024.25.8.2615. Asian Pac J Cancer Prev. 2024. PMID: 39205558 Free PMC article.
References
LinkOut - more resources
Full Text Sources
Research Materials
Miscellaneous
