

Lactucin ameliorates FFA-induced steatosis in HepG2 cells by modulating mitochondrial homeostasis through the SIRT1/PGC-1α signaling axis
- PMID: 39524853
- PMCID: PMC11550614
- DOI: 10.1016/j.heliyon.2024.e39890
Lactucin ameliorates FFA-induced steatosis in HepG2 cells by modulating mitochondrial homeostasis through the SIRT1/PGC-1α signaling axis
Abstract
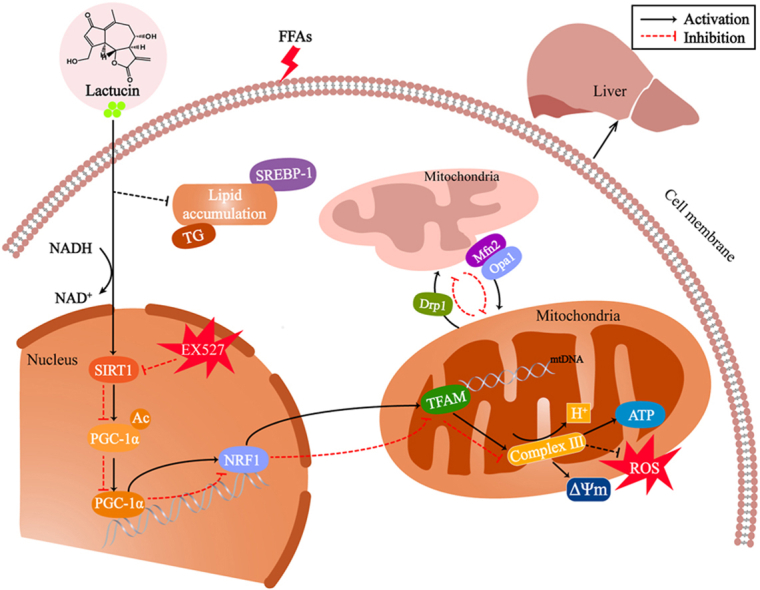
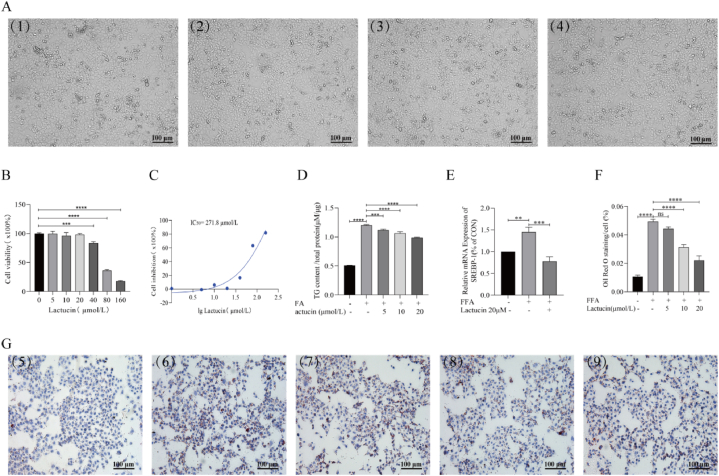
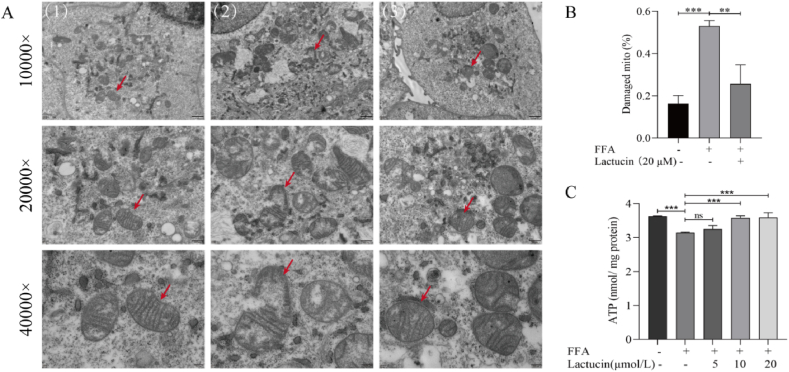
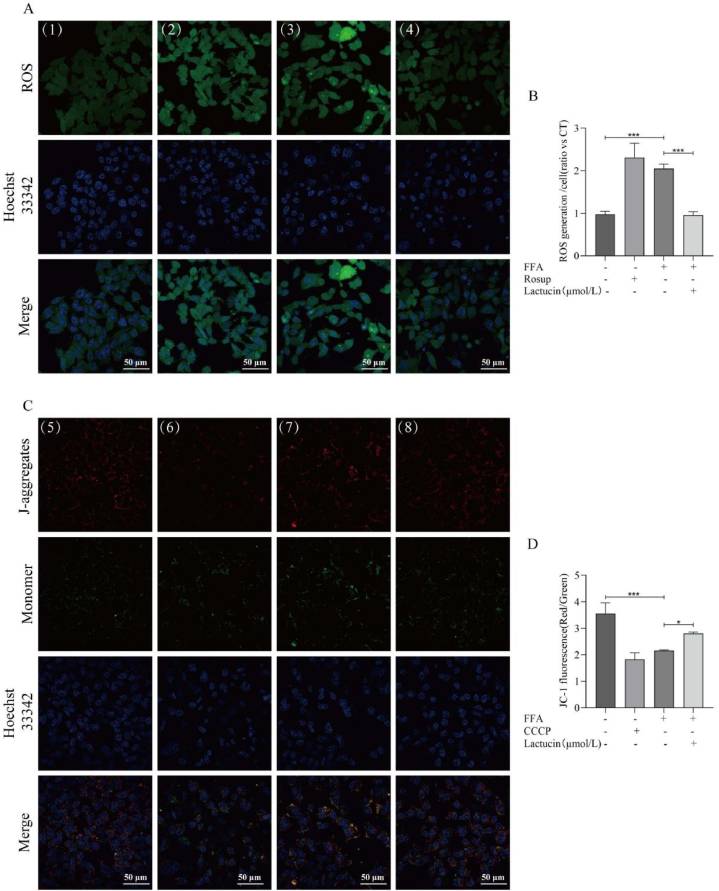
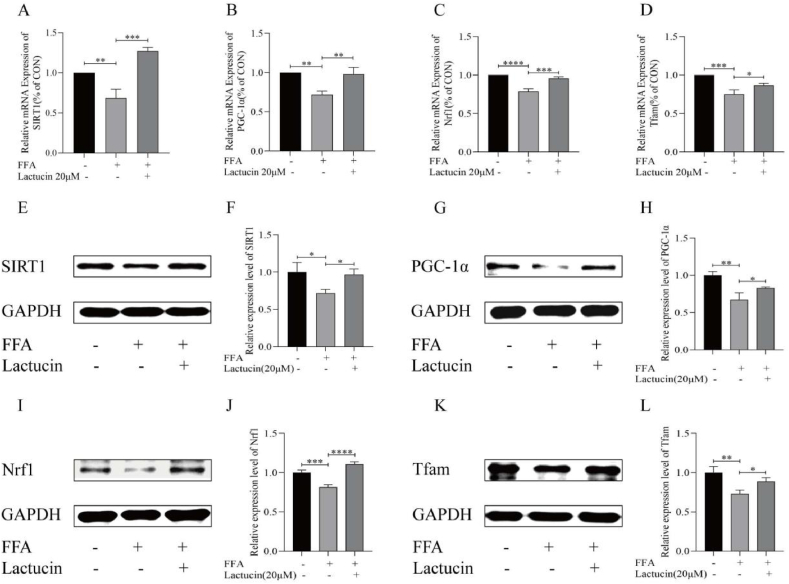
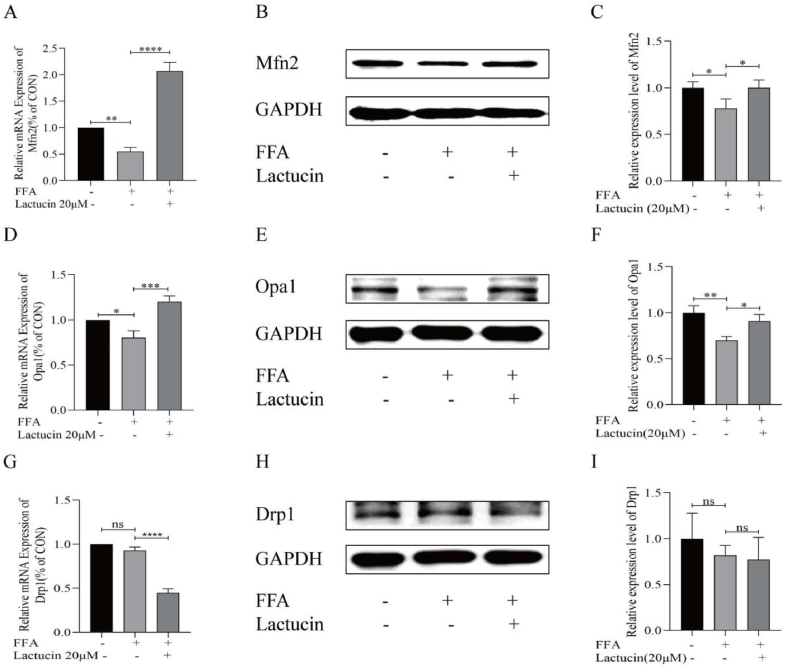
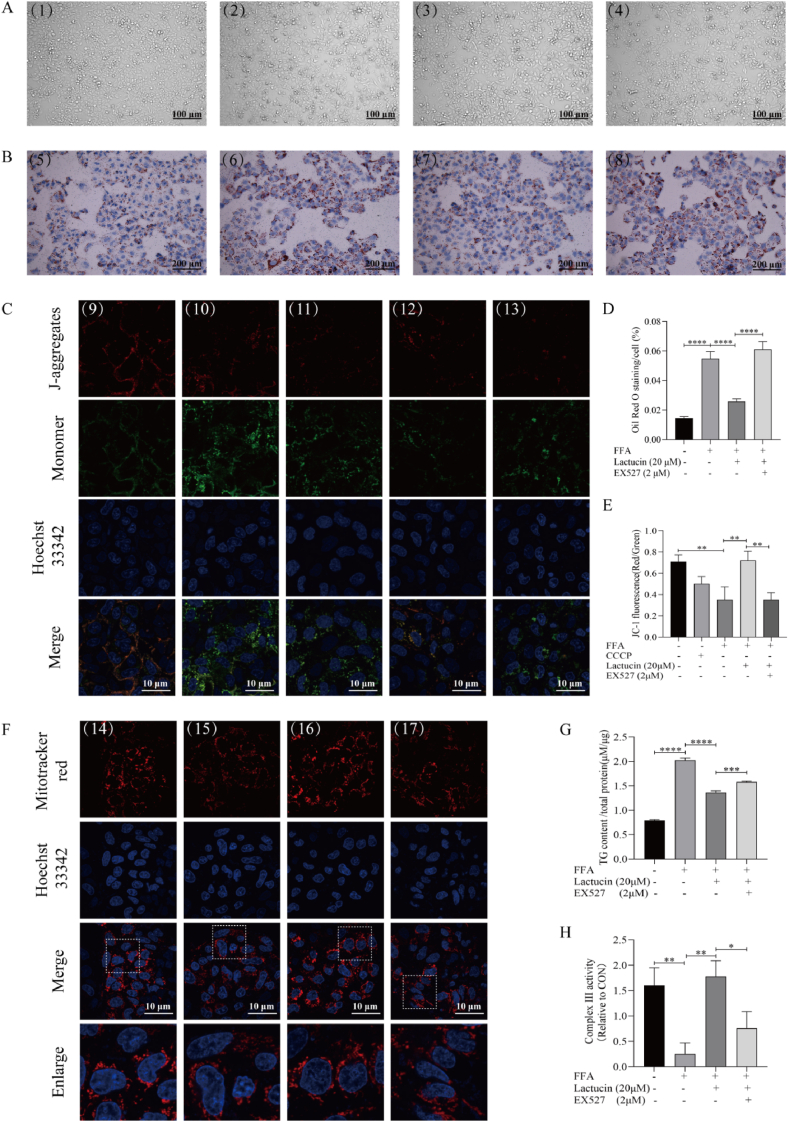
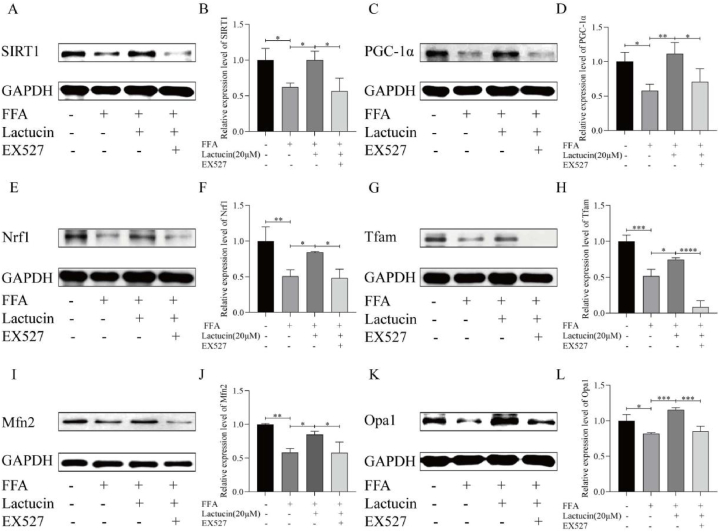
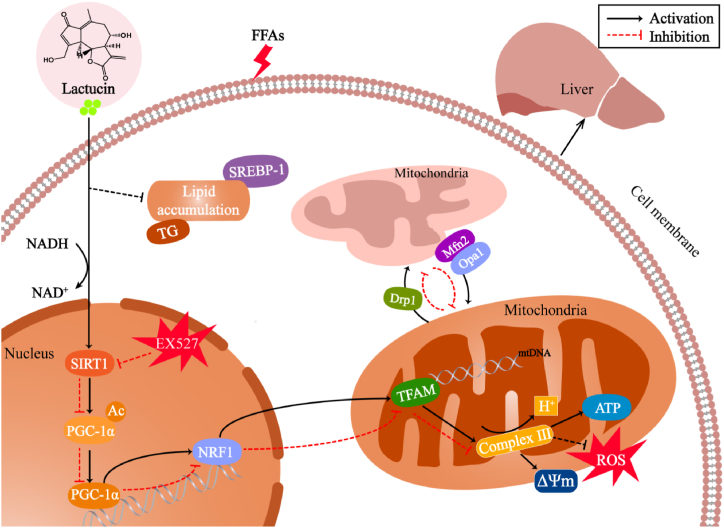
Nonalcoholic fatty liver disease is a complex disease involving abnormal liver metabolism. Its strong association with metabolic dysfunction has led to a change in nomenclature to metabolism dysfunction-associated fatty liver disease (MAFLD). MAFLD pathogenesis involves abnormal accumulation of hepatic lipids that lead to the production of excess free fatty acids (FFAs), which in turn cause an imbalance in hepatic mitochondrial function. Lactucin, a natural compound extracted from Cichorium glandulosum Boiss. et Huet, regulates liver metabolism and protects the liver. However, the potential mechanisms underlying the lactucin-mediated effects in MAFLD require further investigation. In the present study, HepG2 cells were treated with FFAs to establish an in vitro model of MAFLD. Parameters related to lipid accumulation and mitochondrial function, including triglycerides (TG), oil red O-stained lipid droplets, reactive oxygen species (ROS), mitochondrial membrane potential (JC-1), adenine triphosphate (ATP), and complex III were analysed. Morphology of the mitochondria were evaluated by transmission electron microscopy. Furthermore, key proteins in the sirtuin 1 (SIRT1)/peroxisome proliferator-activated receptor gamma coactivator-1α (PGC-1α) signalling axis and mitochondrial quality control were analysed. The SIRT1 inhibitor EX-527 was used to verify the key role of the SIRT1 signalling pathway. Western blotting showed that lactucin upregulated the expression of SIRT-1, PGC-1α, Nrf1, Tfam, Mfn2, and Opa1, and promoted mitochondrial biosynthesis and kinetics. The results suggest that lactucin restores mitochondrial dynamic homeostasis by upregulating the SIRT1/PGC-1α signalling axis, thereby reducing FFA-induced lipid accumulation in HepG2 cells.
Keywords: HepG2 cells; Lactucin; Mitochondrial biosynthesis; Mitochondrial dynamics.
© 2024 The Authors.
Conflict of interest statement
The authors declare the following financial interests/personal relationships which may be considered as potential competing interests:Jian Yang reports was provided by 10.13039/501100001809National Natural Science Foundation of China. Jian Yang reports equipment, drugs, or supplies was provided by the 10.13039/100009110Natural Science Foundation of Xinjiang Uygur Autonomous Region, China. Xiao-li Ma reports equipment, drugs, or supplies was provided by the Xinjiang Uygur Autonomous Region Tianshan Talent Youth Top Talent Project, China. Reports a relationship with that includes:. Has patent pending to. If there are other authors, they declare that they have no known competing financial interests or personal relationships that could have appeared to influence the work reported in this paper.Abbreviations:ATPAdenosine TriphosphateCCK-8Cell Counting Kit-8CCCPCarbonyl cyanide 3-chlorophenylhydrazoneDCFH-DA2,7-Dichlorodihydrofluorescein diacetateDRP1Dynamin-related protein 1;EX527SelisistatFFAFree fatty acidHepG2Hepatocellular carcinoma cellsIC50Half maximal inhibitory concentrationNRF1Recombinant Nuclear Respiratory Factor 1OAOleic acidOPA1Optic atrophy 1PAPalmitic acidPGC-1αPeroxisome proliferator-activated receptor gamma coactivator 1-alphaPMSFPhenylmethylsulfonyl fluorideROSReactive oxygen spicesSIRT-1Sirtuin-1SREBP1Sterol-regulatory element binding protein 1TFAMMitochondrial transcription factorATGTriglyceride
Figures
Similar articles
-
Fenofibrate alleviates NAFLD by enhancing the PPARα/PGC-1α signaling pathway coupling mitochondrial function.BMC Pharmacol Toxicol. 2024 Jan 3;25(1):7. doi: 10.1186/s40360-023-00730-6. BMC Pharmacol Toxicol. 2024. PMID: 38173037 Free PMC article.
-
Elucidation of SIRT-1/PGC-1α-associated mitochondrial dysfunction and autophagy in nonalcoholic fatty liver disease.Lipids Health Dis. 2021 Apr 26;20(1):40. doi: 10.1186/s12944-021-01461-5. Lipids Health Dis. 2021. PMID: 33902605 Free PMC article.
-
Seed oil of Rosa roxburghii Tratt against non-alcoholic fatty liver disease in vivo and in vitro through PPARα/PGC-1α-mediated mitochondrial oxidative metabolism.Phytomedicine. 2022 Apr;98:153919. doi: 10.1016/j.phymed.2021.153919. Epub 2022 Jan 1. Phytomedicine. 2022. PMID: 35104757
-
Study on the role of Dihuang Yinzi in regulating the AMPK/SIRT1/PGC-1α pathway to promote mitochondrial biogenesis and improve Alzheimer's disease.J Ethnopharmacol. 2025 Jan 30;337(Pt 2):118859. doi: 10.1016/j.jep.2024.118859. Epub 2024 Sep 26. J Ethnopharmacol. 2025. PMID: 39341266
-
Role of mitochondria in diabetic peripheral neuropathy: Influencing the NAD+-dependent SIRT1-PGC-1α-TFAM pathway.Int Rev Neurobiol. 2019;145:177-209. doi: 10.1016/bs.irn.2019.04.002. Epub 2019 Jun 8. Int Rev Neurobiol. 2019. PMID: 31208524 Free PMC article. Review.
References
LinkOut - more resources
Full Text Sources
Miscellaneous
