. 2024 Sep 30;32(4):101349.
doi: 10.1016/j.omtm.2024.101349. eCollection 2024 Dec 12.

Single cell and TCR analysis of immune cells from AAV gene therapy-dosed Duchenne muscular dystrophy patients

Affiliations

Single cell and TCR analysis of immune cells from AAV gene therapy-dosed Duchenne muscular dystrophy patients

Michael R Emami et al. Mol Ther Methods Clin Dev. .

Abstract

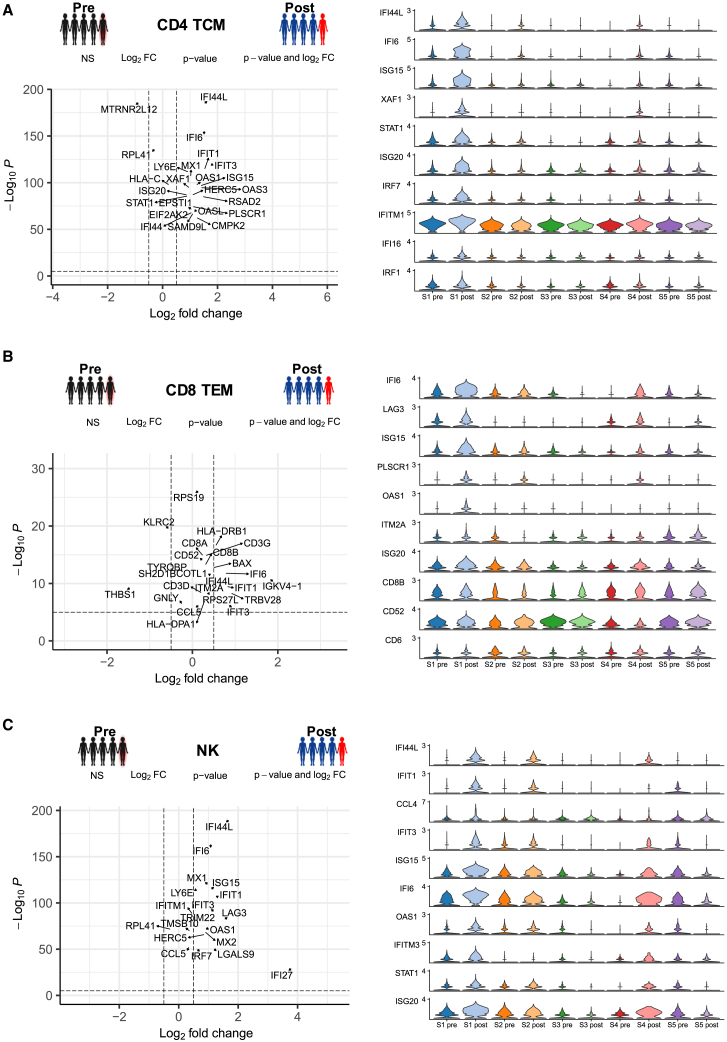
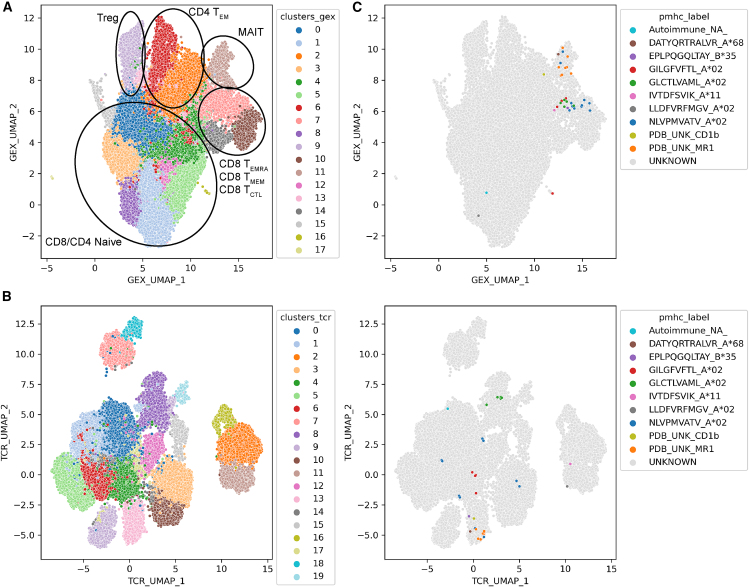
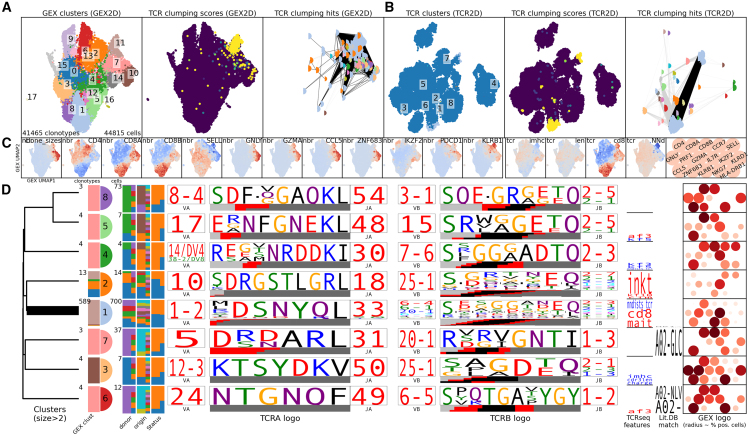
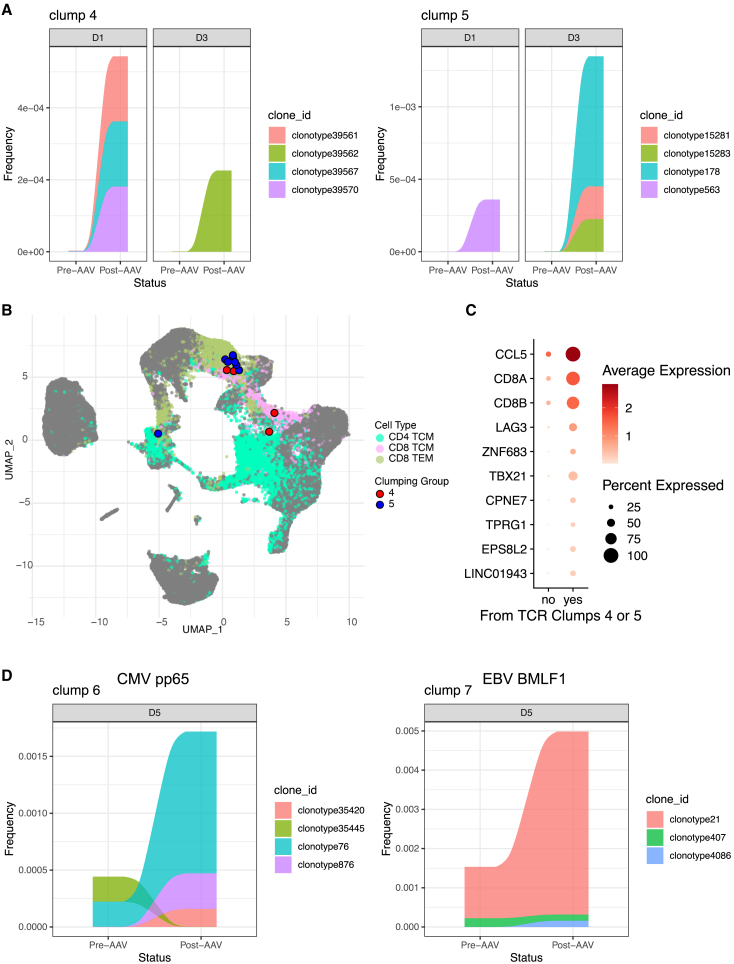
Clinical trials for Duchenne muscular dystrophy (DMD) are assessing the therapeutic efficacy of systemically delivered adeno-associated virus (AAV) carrying a modified DMD transgene. High vector doses (>1E14 vg/kg) are needed to globally transduce skeletal muscles; however, such doses trigger immune-related adverse events. Mitigating these immune responses is crucial for widespread application of AAV-based therapies. We used single-cell RNA sequencing and T cell receptor (TCR) sequencing on peripheral blood mononuclear cells from five participants prior to, and after, dosing. One subject in the high-dose cohort experienced thrombotic microangiopathy (TMA). Few changes in cell frequencies occurred after treatment; however, differential gene expression demonstrated induction of interferon response genes in most T cell types. T cell clonotype and clumping analysis showed the expansion or appearance of groups of related TCR sequences in the post-treatment samples. Three of these expanded clumps could be assigned to prior human herpesvirus infections, two of which were present in the participant that exhibited TMA. These data provide insight on the mechanistic basis of human immune-AAV interactions and lay a foundation for improved understanding of why TMA arises in some patients and not others.

Keywords: AAV; Duchenne; T cell receptor sequencing; adeno-associated virus; gene therapy; immune response; muscular dystrophy; neuromuscular disorders; single-cell sequencing.


Conflict of interest statement

M.J.S. and C.S.Y. are co-founders of MyoGene Bio, a startup spun out of UCLA developing gene editing therapies for DMD. C.S.Y. and M.R.E. are employees of MyoGene Bio. M.A.B. is a listed inventor on a pending patent relating to AAV gene therapy (WO 2021/242664 A1).

Figures

None
Graphical abstract
Figure 1
Figure 1
DMD scRNA-seq and scTCR-seq experimental study design and subject characteristics (A) Schematic outline of the study design. Five DMD patients were dosed with either 2E14 vg/kg or 0.67 vg/kg of AAV9 mini-dystrophin. (∗) Doses initially provided as 3 × 1014 vg/kg and 1 × 1014 vg/kg, as calculated by ITR qPCR and adjusted here by correction factor using an updated transgene PCR titer method. Subject 5, dosed with 2E14 vg/kg experienced an adverse event of thrombotic microangiopathy. PBMCs were collected from the five DMD subjects at baseline and 12–19 weeks post-AAV administration. PBMCs were stimulated with AAV9 peptides for 16 h and then processed through 10x Genomics scRNA-seq and scTCR-seq. (B and C) Anti-AAV9 and anti-mini-dystrophin anti-drug antibodies (ADAs) measured at baseline and time points post-AAV administration. (D and E) IFNγ ELISpot responses against AAV9 and mini-dystrophin. Peptides spanning the coding sequence of AAV9 and mini-dystrophin were used to stimulate PBMCs. The horizontal line indicates the threshold cutoff.
Figure 2
Figure 2
PBMC cell populations post- compared with pre-AAV-mini-dystrophin show a predominant interferon signature (A) Azimuth annotation of cell types derived from five DMD subjects before (pre) and after (post)-AAV administration in a uniform manifold approximation and projection (UMAP) plot. Each dot represents a single cell and was colored according to cell type. (B) UMAP of PBMCs from each subject at each time point (pre- vs. post-dosing). (C) Volcano plot of differential gene expression in PBMCs post-PF06939926 compared with pre. Significantly up- and down-regulated genes contain Log2(Fold Change) > 0.5 or Log2(Fold Change) < 0.5 and -Log10(p value) > 2.0. (D) Dot plot of significantly upregulated genes. Color is scaled by average expression and the dot size is proportional to the percentage of cells expressing the respective gene.
Figure 3
Figure 3
Differential gene expression profiling of PBMCs post-dose vs. baseline (Left) Volcano plot of differential gene expression in individual cell types post-PF06939926 compared with pre-dose by cell type. (Right) Violin plots of selected differentially expressed genes, shown by patient and time point in individual cell types. Volcano plots of differential gene expression shown for CD4 TCM (A), CD8 TEM (B), and NK cells (C). Significantly up- and down-regulated genes contain Log2(Fold Change) > 0.5 or Log2(Fold Change) < 0.5 and -Log10(p value) > 2.0. Volcano and violin plots for additional cell types are in Figures S3 and S4.
Figure 4
Figure 4
TCR clonotype similarity analysis of AAV9-mini-dystrophin treated patients (A) ConGA Clonotype gene expression (left) and TCR clonotype (right) UMAP projection of T cells with paired-chain TCR information from all patients pre- and post-AAV9-mini-dystrophin. For GEX clusters, where a TCR clone abundance >1, the clonotype is reduced to, and plotted as, a single, median cell. (B) Plot of all T cell clonotypes with literature database identified reactivities overlayed on ConGA gene expression (left) and TCR (right) clonotype UMAPs. (C) Plot of all T-cell clonotypes with literature database identified reactivities overlayed on AonGA gene expression (left) and TCR (right) clonotype UMAPs.
Figure 5
Figure 5
ConGA plot showing TCR clumping analysis with integrated gene expression (A) ConGA map showing the gene expression clusters, TCR clumping scores, and TCR clumping hits in gene expression space (A) and TCR space (B). Positioning of identified statistically similar clonotypes and relative locations in gene expression and TCR space. (C) Expression heat maps for select T cell-related genes. (D) TCR clumping group results. Clumping group results are annotated (from left to right) ‘Clonotypes’ = the number of different TCR sequences within a clumping group; GEX cluster = vertical colored bar denoting the proportion of cells from a clumping group within a gene expression cluster in (A); colored semi-circle = the numerical identity of the TCR clumping group in (B); cells = the total number of T cells within the clumping group; Colored vertical bars show the proportion of cells originating from each; donor, origin (sample), and status (pre vs. post-AAV); amino acid sequence logo plots for (left) alpha and (right) beta chains of the TCR, showing V gene contribution, CDR3 amino acid sequence, and J gene contribution; TCRseqfeatures = sequences associated with a T cell phenotype (red = positively associated, blue = negatively associated); Lit.DB match = statistical similarity matching of sequences to previously identified epitope reactive TCRs; GEX logo = relative expression of select T cell-associated genes, and proportion of expressing cells within the TCR clumping group.
Figure 6
Figure 6
Expanded TCR clumps from subject 5 are associated with human herpes viruses (A) Relative frequency of TCR clumps 4 (left) and 5 (right) within donors 1 and 3 pre- and post-AAV treatment. (B) Location of cells from clump 4 (red) and clump 5 (blue) overlayed on the full PBMC gene expression UMAP. (C) Dot plot of gene expression profiles of clumping groups 4 and 5 combined as compared with all other T cells in dataset. (D) Relative frequency of HHV reactive TCR clumps 6 (left) and 7 (right) within donor 5 pre- and post-AAV treatment.

References

    1. Harper S.Q., Hauser M.A., DelloRusso C., Duan D., Crawford R.W., Phelps S.F., Harper H.A., Robinson A.S., Engelhardt J.F., Brooks S.V., Chamberlain J.S. Modular flexibility of dystrophin: implications for gene therapy of Duchenne muscular dystrophy. Nat. Med. 2002;8:253–261. doi: 10.1038/nm0302-253. - DOI - PubMed
    1. Manno C.S., Pierce G.F., Arruda V.R., Glader B., Ragni M., Rasko J.J., Ozelo M.C., Hoots K., Blatt P., Konkle B., et al. Successful transduction of liver in hemophilia by AAV-Factor IX and limitations imposed by the host immune response. Nat. Med. 2006;12:342–347. doi: 10.1038/nm1358. - DOI - PubMed
    1. Salabarria S.M., Corti M., Coleman K.E., Wichman M.B., Berthy J.A., D'Souza P., Tifft C.J., Herzog R.W., Elder M.E., Shoemaker L.R., et al. Thrombotic microangiopathy following systemic AAV administration is dependent on anti-capsid antibodies. J. Clin. Invest. 2024;134 doi: 10.1172/JCI173510. - DOI - PMC - PubMed
    1. Shen W., Liu S., Ou L. Corrigendum: rAAV immunogenicity, toxicity, and durability in 255 clinical trials: A meta-analysis. Front. Immunol. 2022;13 doi: 10.3389/fimmu.2022.1104646. - DOI - PMC - PubMed
    1. Shen W., Liu S., Ou L. rAAV immunogenicity, toxicity, and durability in 255 clinical trials: A meta-analysis. Front. Immunol. 2022;13 doi: 10.3389/fimmu.2022.1001263. - DOI - PMC - PubMed