. 2024 Oct 31;13(10):5278-5299.
doi: 10.21037/tcr-24-277. Epub 2024 Oct 29.

Exploring SSR1 as a novel diagnostic and prognostic biomarker in hepatocellular carcinoma, and its relationship with immune infiltration

Affiliations

Exploring SSR1 as a novel diagnostic and prognostic biomarker in hepatocellular carcinoma, and its relationship with immune infiltration

Qingyu Xiao et al. Transl Cancer Res. .

Abstract

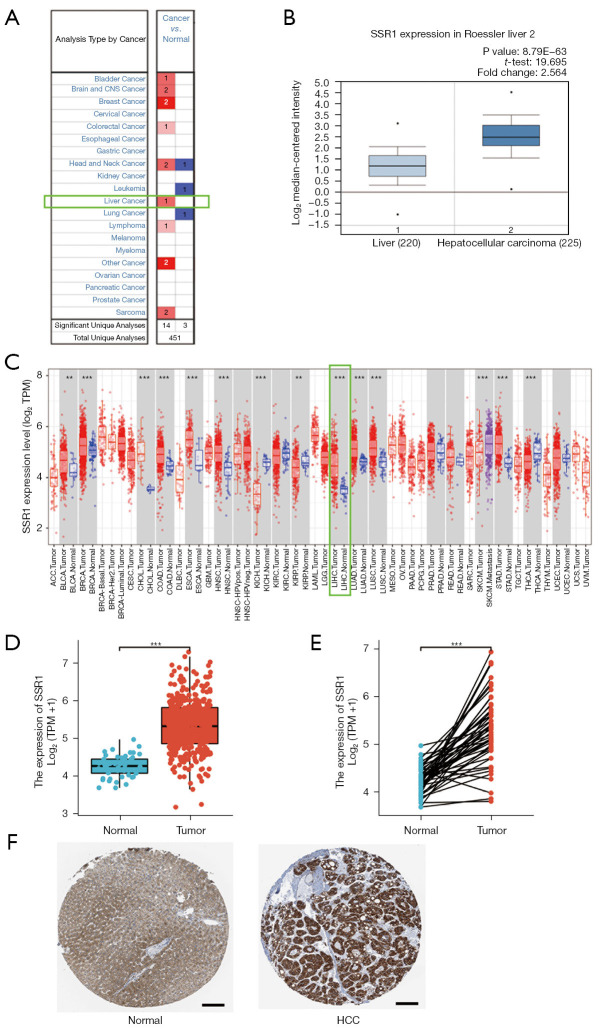
Background: Although signal sequence receptor subunit 1 (SSR1) has undergone thorough examination in different cancer types, its importance in hepatocellular carcinoma (HCC) remains largely uncharted and warrants further investigation. The aim of this study is to explore the role of SSR1 in HCC progression and to decipher its underlying molecular mechanisms.

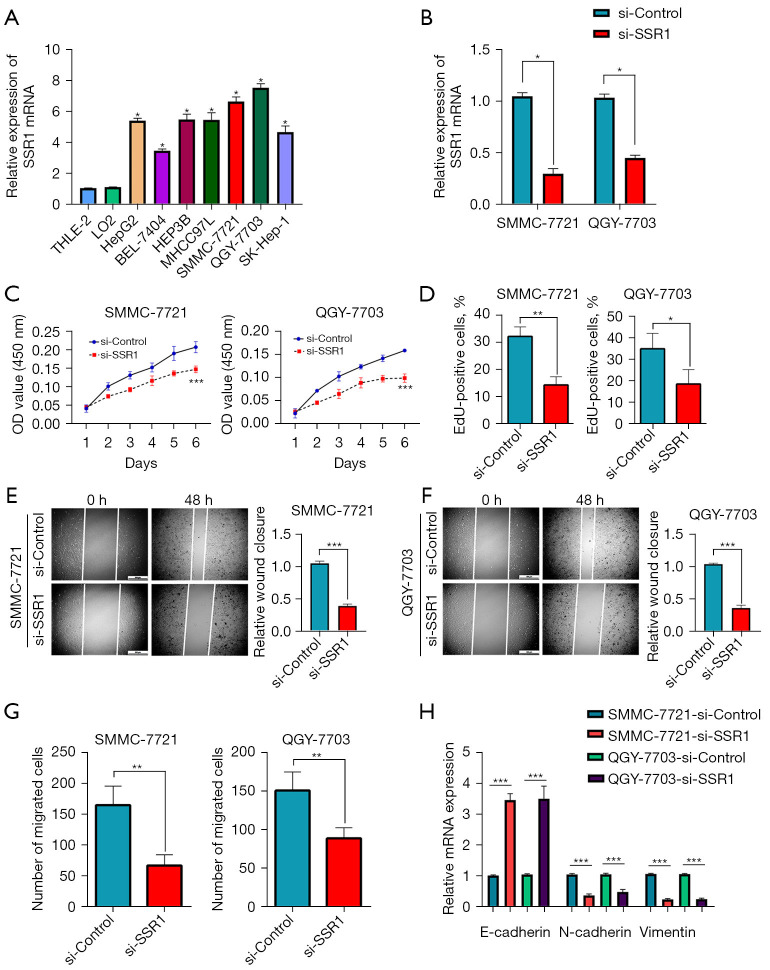
Methods: We employed the ONCOMINE, Tumor IMmune Estimation Resource (TIMER), and The Cancer Genome Atlas databases to assess SSR1 expression levels within tumor tissues. Logistic and Cox regression analyses, Kaplan-Meier survival plots, nomograms, and forest plots were employed to establish correlation between SSR1 and prognosis. Receiver operating characteristic (ROC) curves demonstrated diagnostic utility of SSR1. Additionally, Gene Ontology (GO) and gene set enrichment analysis (GSEA) analyses were conducted to uncover relevant molecular pathways. TIMER was instrumental in elucidating the connection between SSR1 and immune cell infiltration. Actions of SSR1 in HCC proliferation and migration were investigated through quantitative real-time polymerase chain reaction, Cell Counting Kit-8, 5-ethynyl-2'-deoxyuridine cell proliferation assays, and Transwell migration and wound healing experiments.

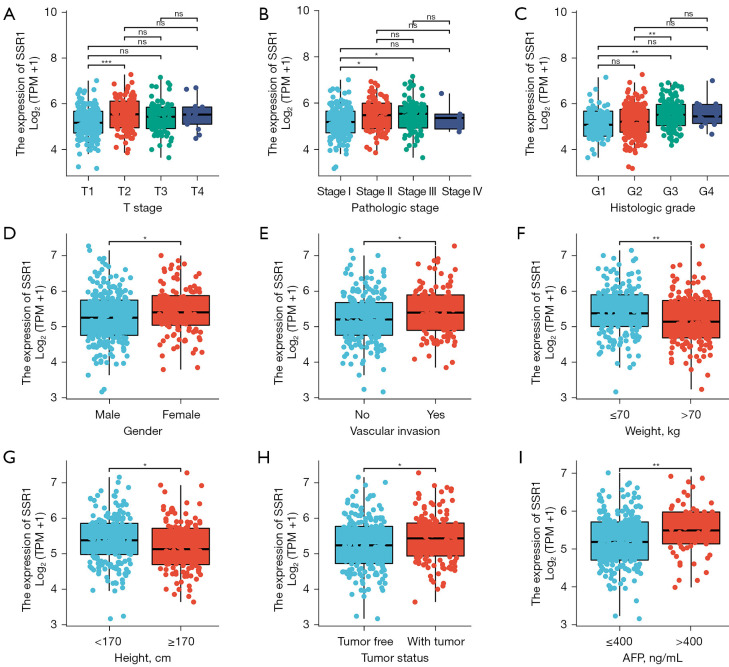
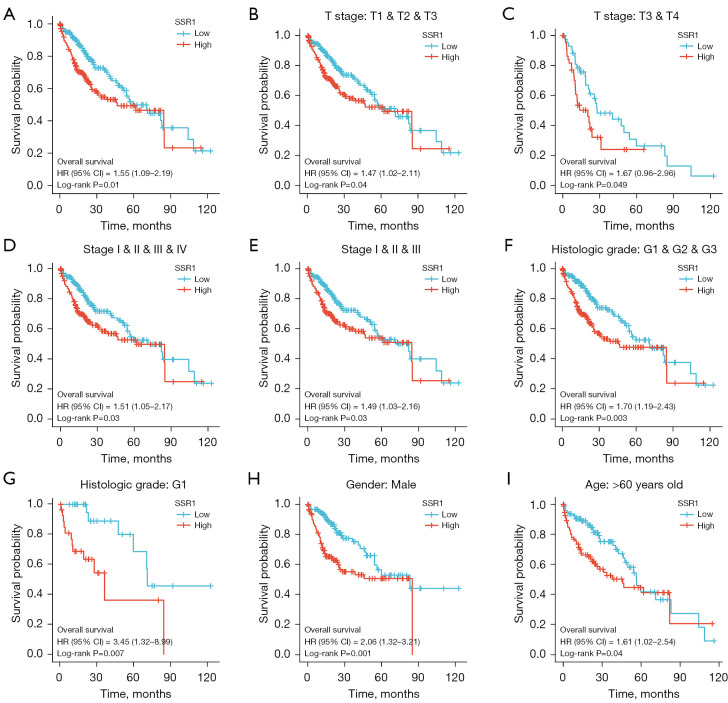
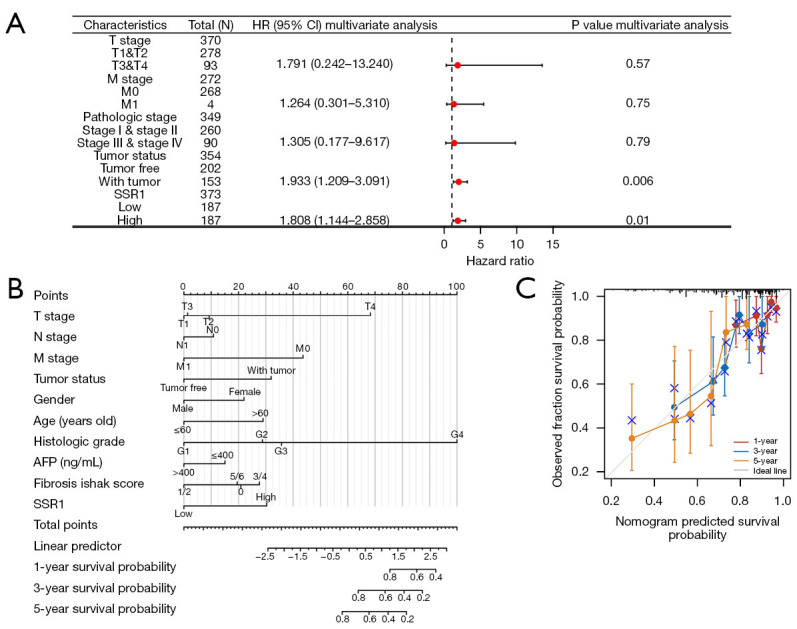
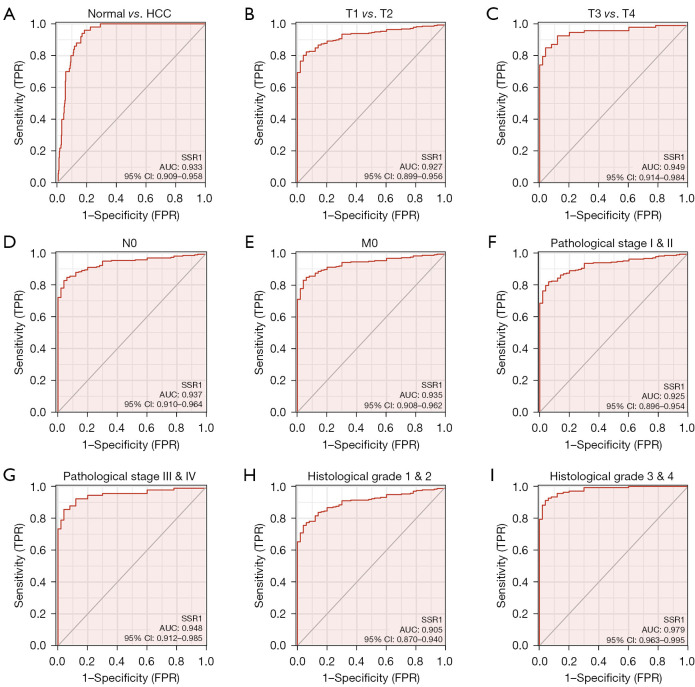
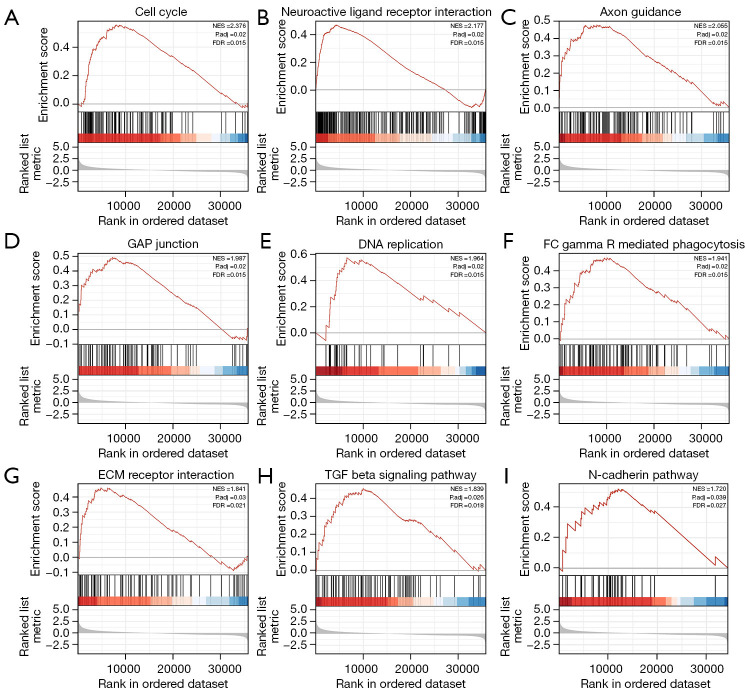
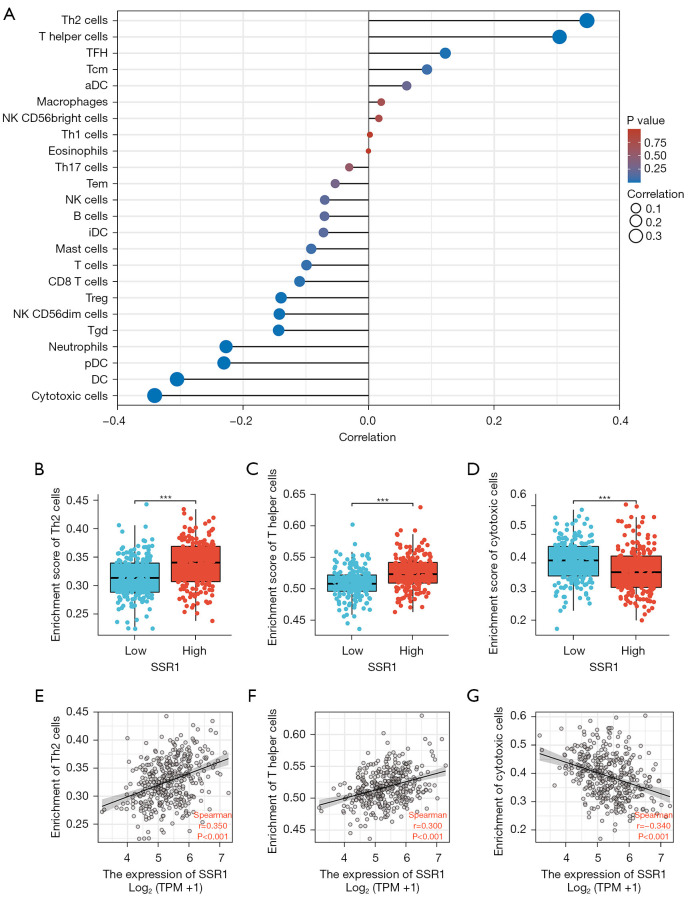
Results: Elevated SSR1 levels were found to be correlated with clinical parameters such as age and pathologic stage, thereby predicting a reduced overall survival (OS) rate in HCC patients. Multivariate survival analysis underscored SSR1 as an independent prognostic marker for OS. A nomogram underscored SSR1's effectiveness as a predictive tool for HCC outcomes, while ROC analysis indicated its high diagnostic accuracy. GO and GSEA analyses suggested that elevated SSR1 expression may be associated with epithelial-mesenchymal transition (EMT) pathway. SSR1 exhibited a negative correlation with cytotoxic cells and a positive correlation with Th2 cells. Our in vitro experiments provided evidence that heightened SSR1 levels may impact HCC proliferation and migration through EMT pathway.

Conclusions: SSR1 surfaces as a new diagnostic and potentially prognostic biomarker, showing an association with immune cell infiltration and cell proliferation in HCC.

Keywords: Signal sequence receptor subunit 1 (SSR1); epithelial-mesenchymal transition (EMT); hepatocellular carcinoma (HCC); immune infiltration.


Conflict of interest statement

Conflicts of Interest: All authors have completed the ICMJE uniform disclosure form (available at https://tcr.amegroups.com/article/view/10.21037/tcr-24-277/coif). The authors have no conflicts of interest to declare.

Figures

Figure 1
Figure 1
Expression analysis of SSR1 by ONCOMINE, TIMER and TCGA databases. (A) Expression of SSR1 in different types of human cancers in the ONCOMINE database; Different colors represent different expression levels of SSR1 in those studies; red represents high expression, and blue represents low expression; (B) SSR1 is over-expressed in HCC tissues comparing with normal tissues in Roessler Liver 2 dataset of ONCOMINE; 1, group 1 with normal tissues; 2, group 2 with HCC tissues; (C) expression of SSR1 in different types of human cancers in the TIMER database; (D) expression of SSR1 in HCC and normal tissues in TCGA database; (E) expression of SSR1 in HCC and adjacent normal tissues in TCGA database; (F) expression of SSR1 protein in HCC and normal tissues. Representative immunohistochemistry images of SSR1 in HCC and normal tissues source from the HPA database (https://www.proteinatlas.org/). Image credit goes to the HPA database. The links to SSR1 staining are provided for normal (https://www.proteinatlas.org/ENSG00000124783-SSR1/tissue/liver#img) and tumor tissues (https://www.proteinatlas.org/ENSG00000124783-SSR1/pathology/liver+cancer#img), respectively. Scale bar =100 µm. **, P<0.01; ***, P<0.001. HCC, hepatocellular carcinoma; HPA, Human Protein Atlas; SSR1, signal sequence receptor subunit 1; TCGA, The Cancer Genome Atlas; TIMER, Tumor IMmune Estimation Resource; TPM, transcripts per million.
Figure 2
Figure 2
Association with SSR1 expression and clinicopathological characteristics, including T stage (A), pathologic stage (B), histological grade (C), gender (D), vascular invasion (E), weight (kg) (F), height (cm) (G), tumor status (H), and AFP (I) in HCC patients in TCGA cohort. *, P<0.05; **, P<0.01; ***, P<0.001. AFP, alpha-fetoprotein; HCC, hepatocellular carcinoma; ns, not significant; SSR1, signal sequence receptor subunit 1; TCGA, The Cancer Genome Atlas; TPM, transcripts per million.
Figure 3
Figure 3
Kaplan-Meier survival curves comparing the high and low expression of SSR1 in HCC. (A) Survival curves of OS between SSR1-high and -low patients with HCC. (B-I) OS survival curves of T1 & T2 & T3 stage, T3 & T4 stage, pathologic stage I& II& III & IV, pathologic stage I & II & III, histologic grade G1 & G2 & G3, histologic grade G1, male, age >60 years old subgroup between SSR1-high and -low patients with HCC. CI, confidence interval; HCC, hepatocellular carcinoma; HR, hazard ratio; OS, overall survival; SSR1, signal sequence receptor subunit 1.
Figure 4
Figure 4
Forest plot of the multivariate Cox regression analysis and quantitative method to predict HCC patients’ probability of 1-, 3-, and 5-year OS. (A) Forest plot of the multivariate Cox regression analysis in HCC. (B) A nomogram for predicting the probability of 1-, 3-, and 5-year OS for HCC patients. (C) Calibration plots of the nomogram for predicting the probability of OS at 1, 3, and 5 years. HR, hazard ratio; CI, confidence interval; SSR1, signal sequence receptor subunit 1; AFP, alpha-fetoprotein; HCC, hepatocellular carcinoma; OS, overall survival.
Figure 5
Figure 5
Diagnostic value of SSR1 expression in HCC. (A) ROC curve for SSR1 in normal liver tissue and HCC; (B-I) subgroup analysis for T1 & T2 stage, T3 & T4 stage, N0, M0, pathological stage I & II, pathological stage III & IV, histological grade 1&2, histological grade 3&4. AUC, area under the curve; CI, confidence interval; FPR, false positive rate; HCC, hepatocellular carcinoma; ROC, receiver operating characteristic; SSR1, signal sequence receptor subunit 1; TPR, true positive rate.
Figure 6
Figure 6
Enrichment plots from GSEA. Gene set enrichment plots of cell cycle (A), neuroactive ligand receptor interaction (B), axon guidance (C), GAP junction (D), DNA replication (E), Fc gamma R mediated phagocytosis (F), ECM receptor interaction (G), TGF beta signaling pathway (H), and N-cadherin pathway (I) in hepatocellular carcinoma cases with high SSR1 expression. ECM, extracellular matrix; FDR, false discovery rate; GSEA, gene set enrichment analysis; NES, normalized enrichment score; SSR1, signal sequence receptor subunit 1; TGF, transforming growth factor.
Figure 7
Figure 7
The expression level of SSR1 was associated with the immune infiltration in the tumor microenvironment. (A) Correlation between the relative abundances of 24 immune cells and SSR1 expression level. The size of dots shows the absolute value of Spearman R. (B-G) Scatter plots and correlation diagrams showing the difference of Th2 cells, T helper cells, and cytotoxic cells infiltration level between SSR1-high and -low groups. ***, P<0.001. aDC, activated dendritic cell; DC, dendritic cell; iDC, immature dendritic cell; NK, natural killer; pDC, plasmacytoid dendritic cell; SSR1, signal sequence receptor subunit 1; Tcm, central memory T cell; Tfh, follicular helper T cell; Tgd, γ/δ T cell; Th, T helper cell; TPM, transcripts per million; Treg, regulatory T cell.
Figure 8
Figure 8
Expression, molecular function and mechanism of SSR1 in HCC tissues and cell lines. (A) SSR1 expression levels in THLE-2, LO2, HepG2, BEL-7404, Hep3B, MHCC97L, SMMC-7721, QGY-7703 and SK-Hep-1 by qRT-PCR; (B) SSR1 expression in SMMC-7721 and QGY-7703 cells transfected with si-SSR1 and si-Control were confirmed by qRT-PCR; (C) the proliferation ability of HCC cells SMMC-7721 and QGY-7703 with si-Control or si-SSR1 measured by the Cell Counting Kit-8 assay; (D) the proliferation ability of HCC cells SMMC-7721 and QGY-7703 with si-Control or si-SSR1 measured by EdU cell proliferation assay; (E,F) the migration ability of HCC cells SMMC-7721 and QGY-7703 with si-Control or si-SSR1 measured by the wound-healing assay. The wound-healing was observed under a light microscope. Scale bar =500 µm; (G) the migration ability of HCC cells SMMC-7721 and QGY-7703 with si-Control or si-SSR1 measured by Transwell migration assay; (H) the mRNA expression levels of E-cadherin, N-cadherin and Vimentin of SMMC-7721 and QGY-7703 with si-Control or si-SSR1 by qRT-PCR. *, P<0.05; **, P<0.01; ***, P<0.001. SSR1, signal sequence receptor subunit 1; EdU, 5-ethynyl-2'-deoxyuridine; HCC, hepatocellular carcinoma; OD, optical density; qRT-PCR, quantitative real-time polymerase chain reaction.

Similar articles

References

    1. Miller KD, Nogueira L, Mariotto AB, et al. Cancer treatment and survivorship statistics, 2019. CA Cancer J Clin 2019;69:363-85. 10.3322/caac.21565 - DOI - PubMed
    1. Ferlay J, Shin HR, Bray F, et al. Estimates of worldwide burden of cancer in 2008: GLOBOCAN 2008. Int J Cancer 2010;127:2893-917. 10.1002/ijc.25516 - DOI - PubMed
    1. Rinella ME. Nonalcoholic fatty liver disease: a systematic review. JAMA 2015;313:2263-73. 10.1001/jama.2015.5370 - DOI - PubMed
    1. Batey RG, Burns T, Benson RJ, et al. Alcohol consumption and the risk of cirrhosis. Med J Aust 1992;156:413-6. 10.5694/j.1326-5377.1992.tb139846.x - DOI - PubMed
    1. Balogh J, Victor D, 3rd, Asham EH, et al. Hepatocellular carcinoma: a review. J Hepatocell Carcinoma 2016;3:41-53. 10.2147/JHC.S61146 - DOI - PMC - PubMed

LinkOut - more resources