

Raman spectroscopy coupled with the PLSR model: A rapid method for analyzing gamma-oryzanol content in rice bran oil
- PMID: 39525060
- PMCID: PMC11550018
- DOI: 10.1016/j.fochx.2024.101923
Raman spectroscopy coupled with the PLSR model: A rapid method for analyzing gamma-oryzanol content in rice bran oil
Abstract
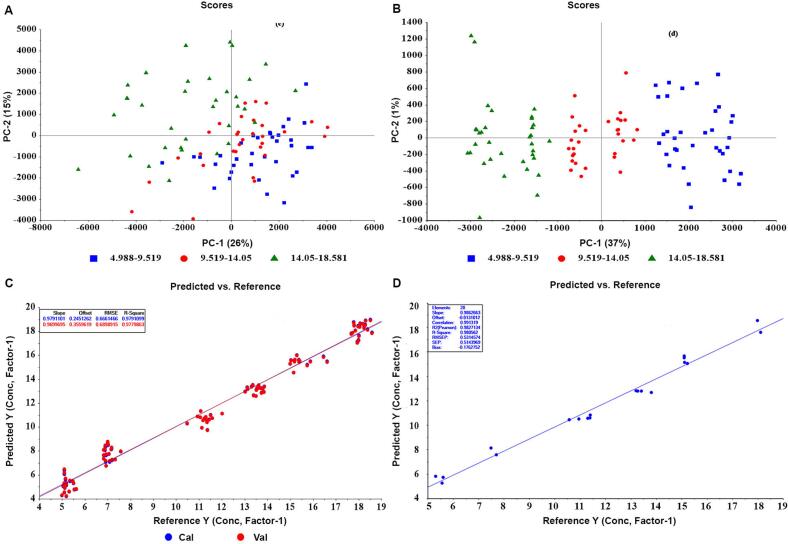
Rice bran oil (RBO) is widely used in food, nutraceutical, and cosmetic industries, due to its γ-oryzanol content, a key quality indicator. This study developed a rapid, non-destructive method for quantifying γ-oryzanol in RBO using Raman spectroscopy combined with partial least squares regression (PLSR). The optimal PLSR model, based on orthogonal signal correction (OSC)-pretreated data of Raman spectra from 800 to 1800 cm-1, demonstrated high accuracy with a strong R2-Pearson correlation coefficient of 0.9827 and low root mean square error of prediction (RMSEP) of 0.5314. Principal component analysis (PCA) of OSC-pretreated data showed improved sample grouping by concentration of γ-oryzanol compared to untreated data. Additionally, Bland-Altman plots comparing results from Raman and HPLC methods showed random scatter within ±2 SD of the mean difference, confirming the method's reliability. This study indicates that Raman spectroscopy can serve as a reliable method for determining γ-oryzanol content in RBO products within the related industries.
Keywords: Bioactive compounds; Multivariate analysis; Oryzanol; Quality control; Raman spectroscopy; Rice bran oil.
© 2024 The Authors.
Conflict of interest statement
The authors declare the following financial interests/personal relationships which may be considered as potential competing interests: Natthinee Anantachoke reports financial support was provided by Thailand Research Fund. Natthinee Anantachoke reports article publishing charges was provided by Mahidol University. Natthinee Anantachoke reports equipment, drugs, or supplies was provided by the Center of Excellence for Innovation in Chemistry. If there are other authors, they declare that they have no known competing financial interests or personal relationships that could have appeared to influence the work reported in this paper.
Figures


Similar articles
-
Determination of γ-Oryzanol in Refined Rice Bran Oil by Nuclear Magnetic Resonance Method.J Nutr Sci Vitaminol (Tokyo). 2019;65(Supplement):S72-S74. doi: 10.3177/jnsv.65.S72. J Nutr Sci Vitaminol (Tokyo). 2019. PMID: 31619651
-
Simultaneous Determination of Vitamin E and γ-Oryzanol in Rice Bran Oil via HPSEC-PDA without Sample Pretreatment.J Oleo Sci. 2023;72(7):655-665. doi: 10.5650/jos.ess22257. J Oleo Sci. 2023. PMID: 37380482
-
Improving Stability of Flaxseed Oil by Rice Bran Oil as Source of γ-Oryzanol.Pak J Biol Sci. 2022 Jan;25(8):698-704. doi: 10.3923/pjbs.2022.698.704. Pak J Biol Sci. 2022. PMID: 36098195
-
Biological and Pharmacological Effects of Gamma-oryzanol: An Updated Review of the Molecular Mechanisms.Curr Pharm Des. 2021;27(19):2299-2316. doi: 10.2174/1381612826666201102101428. Curr Pharm Des. 2021. PMID: 33138751 Review.
-
Amended final report on the safety assessment of Oryza Sativa (rice) Bran Oil, Oryza Sativa (rice) Germ Oil, Rice Bran Acid,Oryza Sativa (rice) Bran Wax, Hydrogenated Rice Bran Wax, Oryza Sativa (rice)Bran Extract, Oryza Sativa (rice) Extract, Oryza Sativa (rice) Germ Powder, Oryza Sativa (rice) Starch, Oryza Sativa (rice) Bran, Hydrolyzed Rice Bran Extract, Hydrolyzed Rice Bran Protein, Hydrolyzed Rice Extract, and Hydrolyzed Rice Protein.Int J Toxicol. 2006;25 Suppl 2:91-120. doi: 10.1080/10915810600964626. Int J Toxicol. 2006. PMID: 17090480 Review.
Cited by
-
Quantitative Analysis of Peanut Skin Adulterants by Fourier Transform Near-Infrared Spectroscopy Combined with Chemometrics.Foods. 2025 Feb 1;14(3):466. doi: 10.3390/foods14030466. Foods. 2025. PMID: 39942058 Free PMC article.
-
A review on spectral data preprocessing techniques for machine learning and quantitative analysis.iScience. 2025 May 29;28(7):112759. doi: 10.1016/j.isci.2025.112759. eCollection 2025 Jul 18. iScience. 2025. PMID: 40606754 Free PMC article. Review.
References
-
- Anwar F., Anwer T., Mahmood Z. Methodical characterization of rice (Oryza sativa) bran oil from Pakistan. Grasas y Aceites. 2005;56(2):125–134.
-
- Arendse E., Nieuwoudt H., Magwaza L.S., Magwaza L.S., Nturambirwe I.J.F., Fawole O.A., Opara U.L. Recent advancements on vibrational spectroscopic techniques for the detection of authenticity and adulteration in horticultural products with a specific focus on oils, juices and powders. Food and Bioprocess Technology. 2021;14:1–22. doi: 10.1007/s11947-020-02505-x. - DOI
LinkOut - more resources
Full Text Sources
