

Calculating Structure Factors of Protein Solutions by Atomistic Modeling of Protein-Protein Interactions
- PMID: 39525323
- PMCID: PMC11544587
- DOI: 10.1016/j.physa.2024.129844
Calculating Structure Factors of Protein Solutions by Atomistic Modeling of Protein-Protein Interactions
Abstract
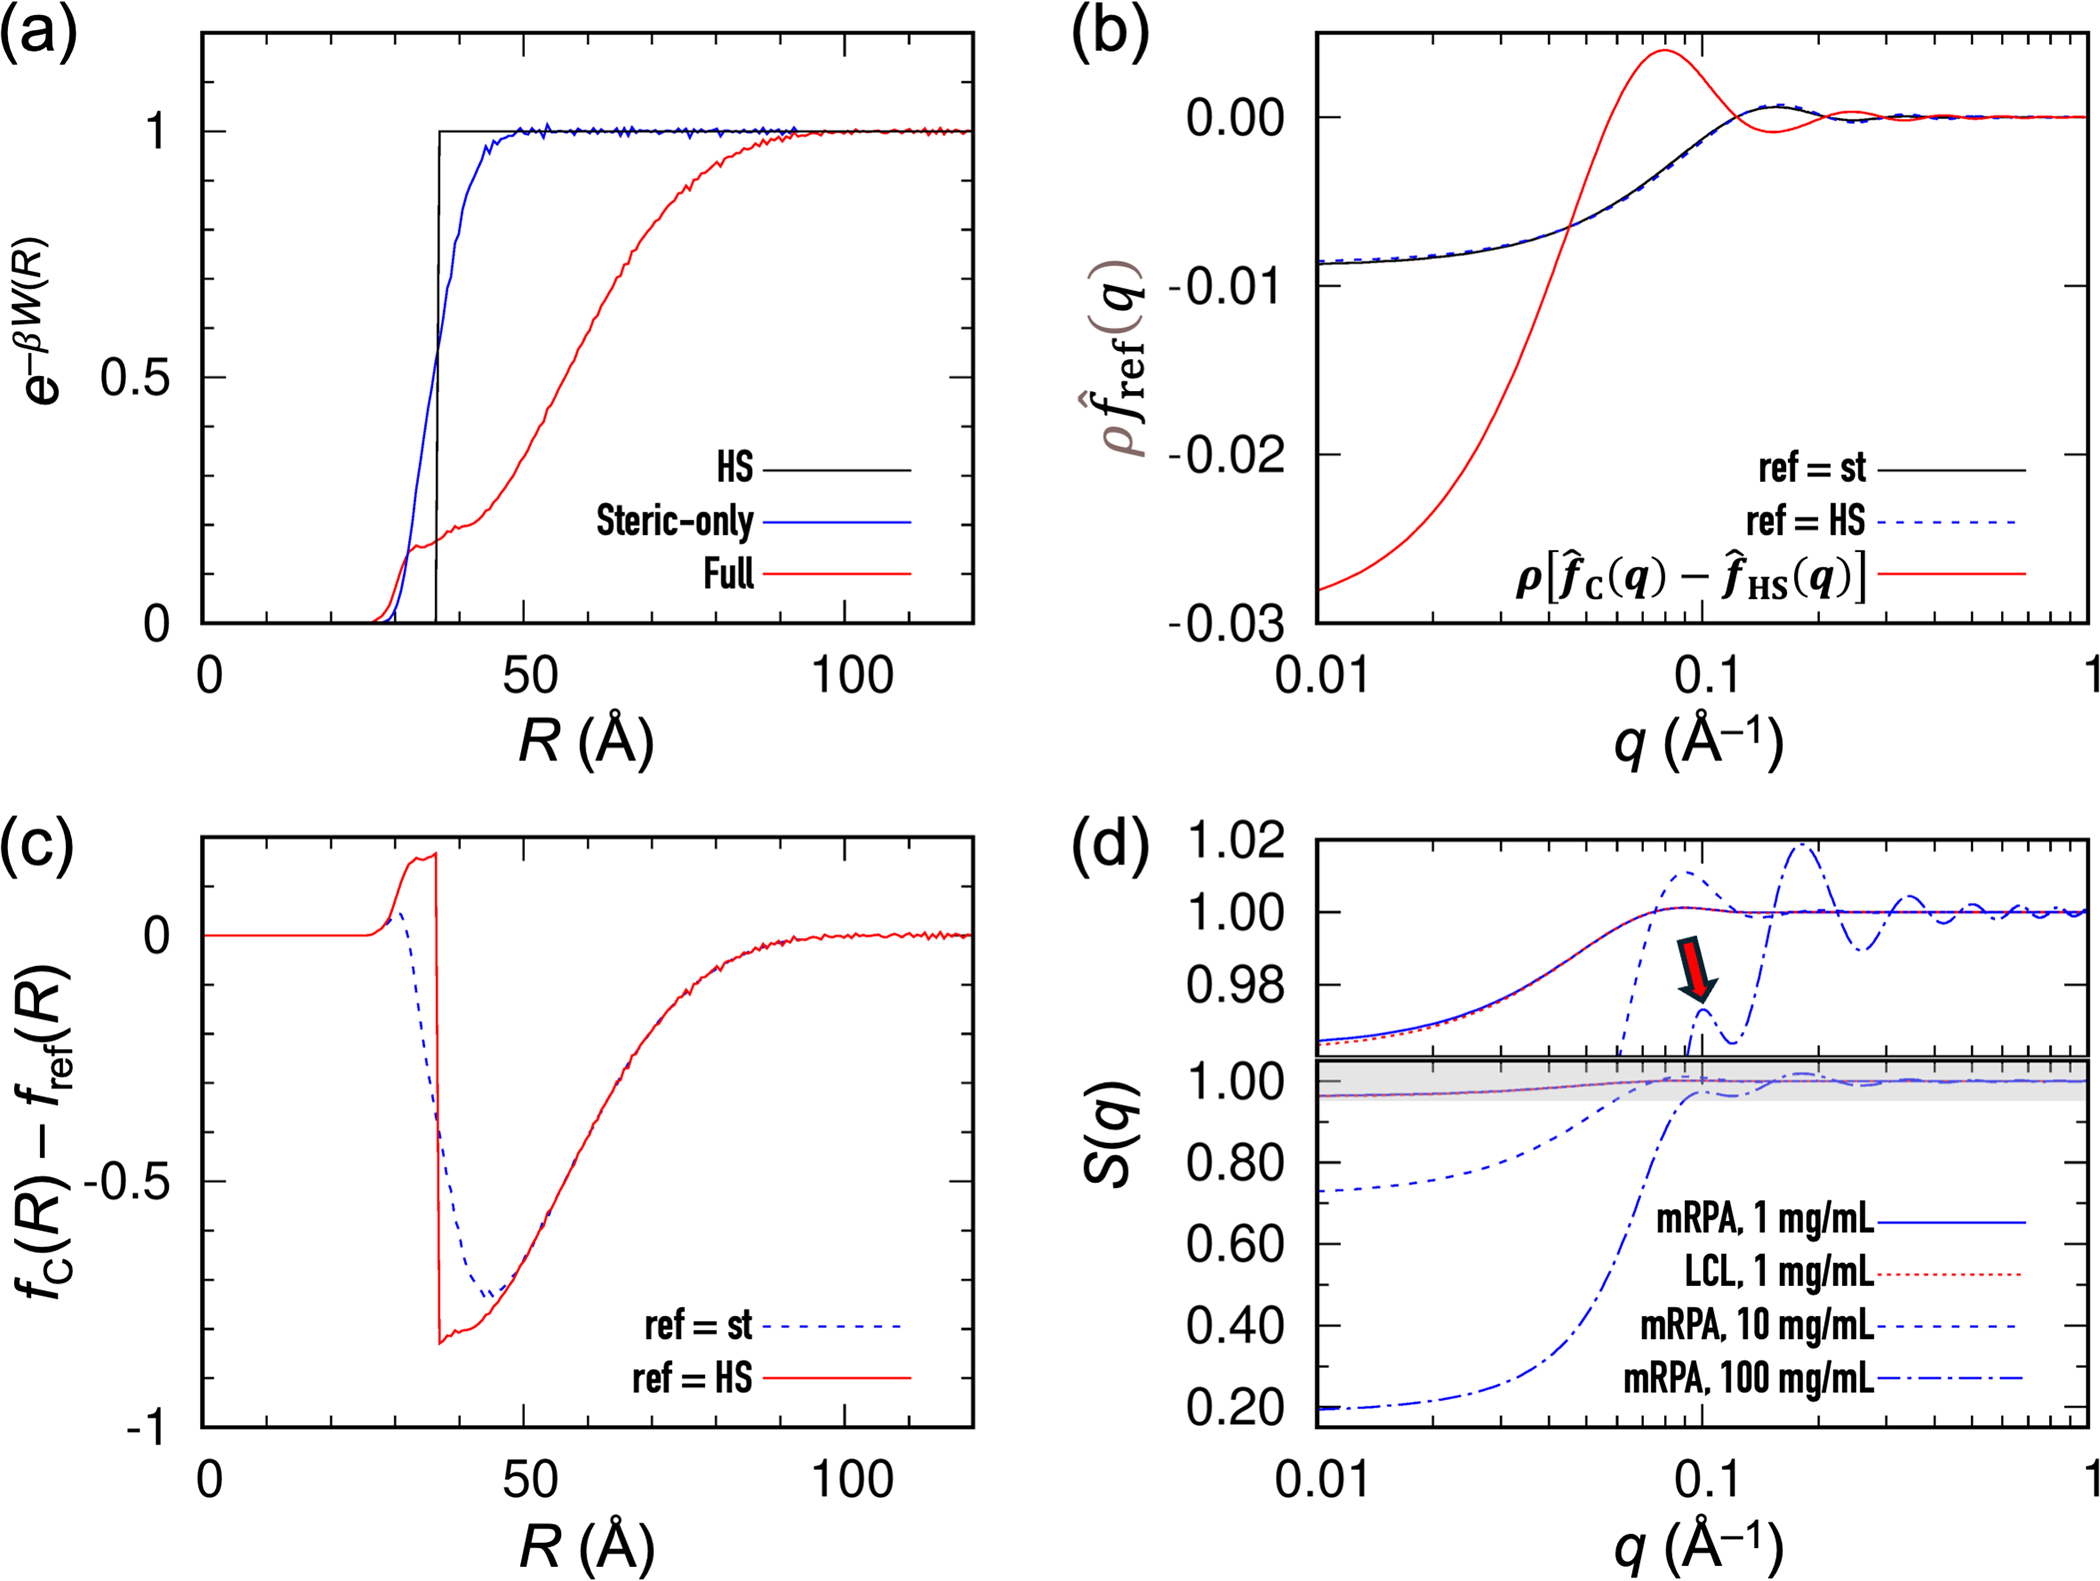
We present a method, FMAPS(q), for calculating the structure factor, , of a protein solution, by extending our fast Fourier transform-based modeling of atomistic protein-protein interactions (FMAP) approach. The interaction energy consists of steric, nonpolar attractive, and electrostatic terms that are additive among all pairs of atoms between two protein molecules. In the present version, we invoke the free-rotation approximation, such that the structure factor is given by the Fourier transform of the protein center-center distribution function . At low protein concentrations, can be approximated as , where is the potential of mean force along the center-center distance . We calculate using FMAPB2, a member of the FMAP class of methods that is specialized for the second virial coefficient [Qin and Zhou, J Phys Chem B 123 (2019) 8203-8215]. For higher protein concentrations, we obtain by a modified random-phase approximation, which is a perturbation around the steric-only energy function. Without adjusting any parameters, the calculated structure factors for lysozyme and bovine serum albumin at various ionic strengths, temperatures, and protein concentrations are all in reasonable agreement with those measured by small-angle X-ray or neutron scattering. This initial success motivates further developments, including removing approximations and parameterizing the interaction energy function.
Keywords: second virial coefficient; small-angle X-ray scattering; small-angle neutron scattering; structure factor.
Figures


Update of
-
Calculating Structure Factors of Protein Solutions by Atomistic Modeling of Protein-Protein Interactions.bioRxiv [Preprint]. 2024 Mar 28:2024.03.27.587040. doi: 10.1101/2024.03.27.587040. bioRxiv. 2024. Update in: Physica A. 2024 Jun 15;644:129844. doi: 10.1016/j.physa.2024.129844. PMID: 38585905 Free PMC article. Updated. Preprint.
Similar articles
-
Calculating Structure Factors of Protein Solutions by Atomistic Modeling of Protein-Protein Interactions.bioRxiv [Preprint]. 2024 Mar 28:2024.03.27.587040. doi: 10.1101/2024.03.27.587040. bioRxiv. 2024. Update in: Physica A. 2024 Jun 15;644:129844. doi: 10.1016/j.physa.2024.129844. PMID: 38585905 Free PMC article. Updated. Preprint.
-
Further Development of the FFT-based Method for Atomistic Modeling of Protein Folding and Binding under Crowding: Optimization of Accuracy and Speed.J Chem Theory Comput. 2014 Jul 8;10(7):2824-2835. doi: 10.1021/ct5001878. Epub 2014 May 6. J Chem Theory Comput. 2014. PMID: 25061446 Free PMC article.
-
Calculation of Second Virial Coefficients of Atomistic Proteins Using Fast Fourier Transform.J Phys Chem B. 2019 Oct 3;123(39):8203-8215. doi: 10.1021/acs.jpcb.9b06808. Epub 2019 Sep 19. J Phys Chem B. 2019. PMID: 31490691 Free PMC article.
-
Scattering approaches to unravel protein solution behaviors in ionic liquids and deep eutectic solvents: From basic principles to recent developments.Adv Colloid Interface Sci. 2024 Sep;331:103242. doi: 10.1016/j.cis.2024.103242. Epub 2024 Jun 23. Adv Colloid Interface Sci. 2024. PMID: 38964196 Review.
-
Folic acid supplementation and malaria susceptibility and severity among people taking antifolate antimalarial drugs in endemic areas.Cochrane Database Syst Rev. 2022 Feb 1;2(2022):CD014217. doi: 10.1002/14651858.CD014217. Cochrane Database Syst Rev. 2022. PMID: 36321557 Free PMC article.
References
-
- Stradner A, Sedgwick H, Cardinaux F, Poon WCK, Egelhaaf SU, Schurtenberger P, Equilibrium cluster formation in concentrated protein solutions and colloids, Nature, 432 (2004) 492–495. - PubMed
-
- Liu Y, Porcar L, Chen J, Chen W-R, Falus P, Faraone A, Fratini E, Hong K, Baglioni P, Lysozyme Protein Solution with an Intermediate Range Order Structure, J Phys Chem B, 115 (2011) 7238–7247. - PubMed
-
- Tanouye FT, Alves JR, Spinozzi F, Itri R, Unveiling protein-protein interaction potential through Monte Carlo simulation combined with small-angle X-ray scattering, Int J Biol Macromol, 248 (2023) 125869. - PubMed
-
- Zhang F, Skoda MWA, Jacobs RMJ, Martin RA, Martin CM, Schreiber F, Protein Interactions Studied by SAXS: Effect of Ionic Strength and Protein Concentration for BSA in Aqueous Solutions, J Phys Chem B, 111 (2007) 251–259. - PubMed
Grants and funding
LinkOut - more resources
Full Text Sources
Miscellaneous