

Species richness and abundance of wild tsetse flies collected from selected human-wildlife-livestock interface in Tanzania
- PMID: 39525368
- PMCID: PMC11550626
- DOI: 10.1016/j.parepi.2024.e00389
Species richness and abundance of wild tsetse flies collected from selected human-wildlife-livestock interface in Tanzania
Abstract
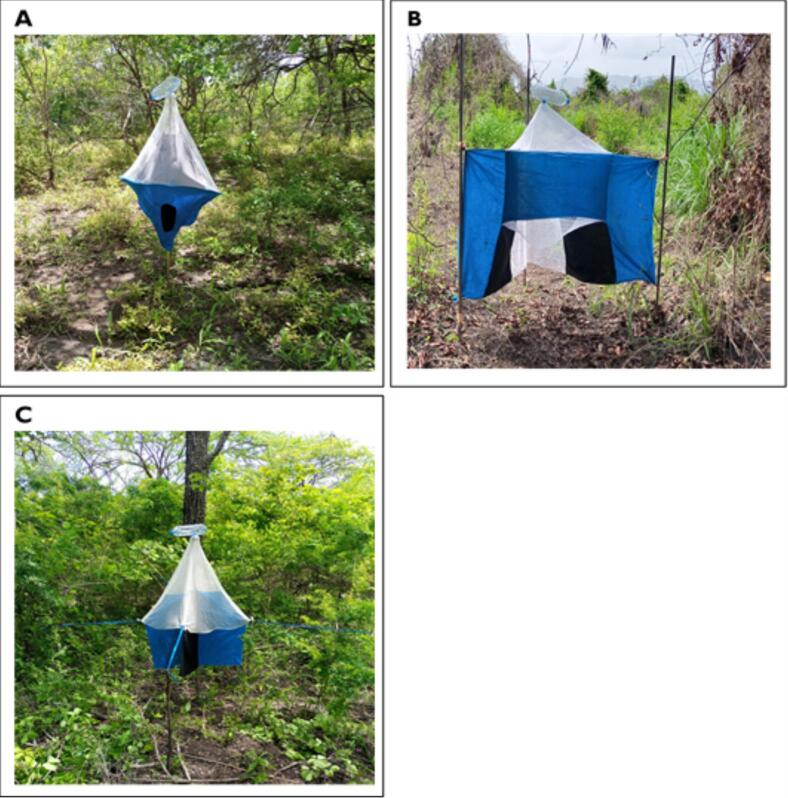
The successful control of tsetse flies largely depends on understanding of the species available and abundance. This study assessed the species richness, abundance and apparent density of wild collected tsetse flies from selected human-wildlife-livestock interface in Tanzania. Seasonal trapping using baited NZI, Pyramidal and Biconical traps was done across selected wards. Traps were set at 200 m apart, emptied after every 24 h then rotated to the next sites after 72 h. Collected flies were identified morphologically and letter confirmed using the Polymerase Chain Reaction (PCR). Only two Glossina species; Glossina pallidipes (n = 371; 47.32 %) and Glossina morsitans morsitans (n = 413; 52.68 %) were identified. Among them, 96 flies (80 Female, 16 Male) were blood fed; 57(48 Female and 9 Male) G. pallidipes and 39(32 Female and 7 Male) G.m. morsitans. Tsetse fly abundance varied across wards (χ2 = 4.597, df = 1, p = 0.032), villages (χ2 = 9.491, df = 3, p = 0.023), habitats (χ2 = 17.239, df = 2, p < 0.001), months (χ2 = 13.507, df = 3, p = 0.004) and deployed traps (χ2 = 6.348, df = 2, p = 0.04). About 78.82 % of the total catch occurred in Kisaki ward (n = 618; p < 0.001) and 21.17 % (n = 166; p = 0.032) in Bwakila chini. Similarly, 62.37 % of the catch occurred in Mbojoge village. NZI traps (n = 422; 54 %; 4.98 FTD) were most successful traps. Moreover, 78.06 % of the catch occurred in bushed grassland habitat (n = 612; 55.41 FTD) while 5.48 % in farmland (n = 43; 7.17 FTD). This study recommends NZI and Pyramidal traps for tsetse flies control at the interface and proposes wet season as appropriate time for successful trapping of the flies. Finally, it attracts a need for assessing tsetse flies' blood meal sources and the infection status to establish the prevalence to inform existing trypanosome control programs.
Keywords: Abundance; Diversity; Human-wildlife-livestock interface; NZI; Pyramidal; Tsetse fly.
© 2024 The Author(s). Published by Elsevier Ltd on behalf of World Federation of Parasitologists.
Conflict of interest statement
The authors declare no conflict of interest.
Figures


References
-
- Auty H., Cleaveland S., Malele I., Masoy J., Lembo T., Bessell P., Torr S., Picozzi K., Welburn S.C. Quantifying heterogeneity in host-vector contact: tsetse (Glossina swynnertoni and G. Pallidipes) host choice in Serengeti National Park, Tanzania. PloS One. 2016;11(10):1–19. doi: 10.1371/journal.pone.0161291. - DOI - PMC - PubMed
-
- Bengaly Z., Vitouley S.H., Somda M.B., Zongo A., Têko-Agbo A., Cecchi G., Adam Y., Sidibé I., Bayala B., Belem A.M.G., Van Den Abbeele J., Delespaux V. Drug quality analysis of isometamidium chloride hydrochloride and diminazene diaceturate used for the treatment of African animal trypanosomosis in West Africa. BMC Vet. Res. 2018;14(1):1–8. doi: 10.1186/s12917-018-1633-7. - DOI - PMC - PubMed
-
- Bouteille B., Louis F.J., Buguet A. Trypanosomoses africaines: maladie du sommeil. EMC – Maladies infectieuses 2014. 2014;11(1):1–12. [Article 8-504-A-20]. EMC - Maladies Infectieuses. 11. 1-12.
-
- Cecchi R., Mattioli G. Geospatial datasets and analyses for an environmental approach to African trypanosomiasis. Programme against African Trypanosomiasis. 2009. https://api.semanticscholar.org/CorpusID:209520653
LinkOut - more resources
Full Text Sources
Miscellaneous
