. 2024 Oct;14(10):4461-4477.
doi: 10.1016/j.apsb.2024.07.004. Epub 2024 Jul 6.

Spatial metabolomics highlights metabolic reprogramming in acute myeloid leukemia mice through creatine pathway

Affiliations

Spatial metabolomics highlights metabolic reprogramming in acute myeloid leukemia mice through creatine pathway

Yucheng Bao et al. Acta Pharm Sin B. 2024 Oct.

Abstract

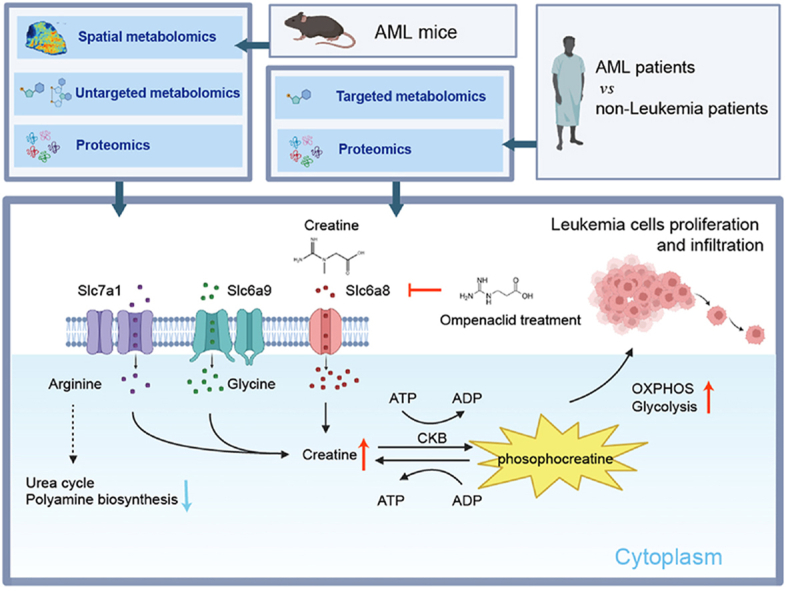
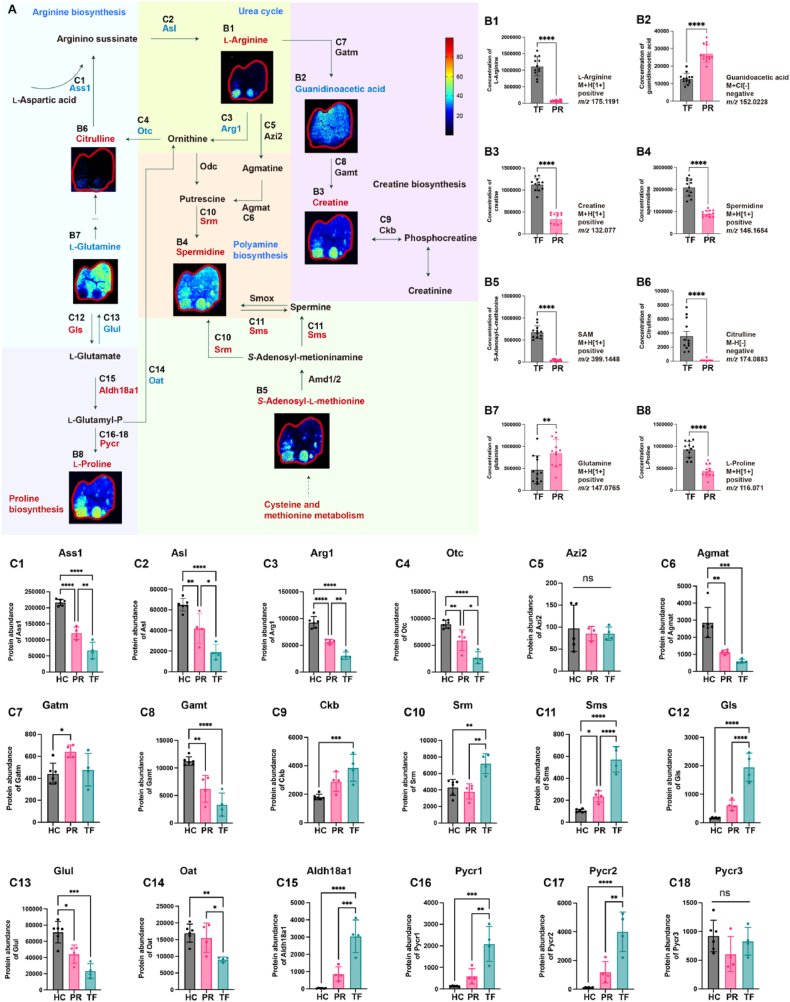
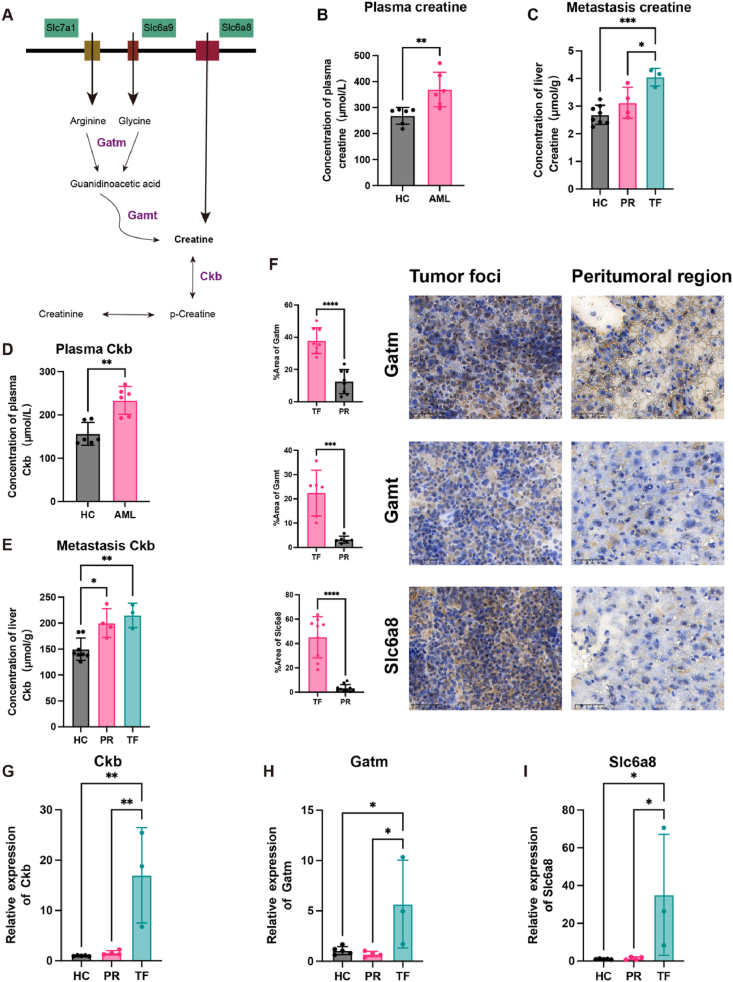
Acute myeloid leukemia (AML) is recognized as an aggressive cancer that is characterized by significant metabolic reprogramming. Here, we applied spatial metabolomics to achieve high-throughput, in situ identification of metabolites within the liver metastases of AML mice. Alterations at metabolite and protein levels were further mapped out and validated by integrating untargeted metabolomics and proteomics. This study showed a downregulation in arginine's contribution to polyamine biosynthesis and urea cycle, coupled with an upregulation of the creatine metabolism. The upregulation of creatine synthetases Gatm and Gamt, as well as the creatine transporter Slc6a8, resulted in a marked accumulation of creatine within tumor foci. This process further enhances oxidative phosphorylation and glycolysis of leukemia cells, thereby boosting ATP production to foster proliferation and infiltration. Importantly, we discovered that inhibiting Slc6a8 can counter these detrimental effects, offering a new strategy for treating AML by targeting metabolic pathways.

Keywords: Acute myeloid leukemia; Creatine; Glycolysis; Metabolic reprogramming; Metastasis; Oxidative phosphorylation; Slc6a8; Spatial metabolomics.


Conflict of interest statement

The authors declare no conflicts of interest.

Figures

Image 1
Graphical abstract
Figure 1
Figure 1
Spatial metabolomics profiling of endogenous metabolites in leukemia mice using AFADESI-MSI. (A) The methodology and workflow of spatial metabolomics, aim to delineate metabolites for molecular histology characterization. (B, C) Enrichment analysis (B) and pathway analysis (C) of AFADESI-MSI data, and metabolites exhibiting significant differential expression (VIP>1 and P < 0.05) were analyzed using MetaboAnalyst 6.0 through the KEGG database to elucidate underlying biological pathways and interactions. (D) PCA score plots derived from AFADESI-MSI data, comparing TF with PR. PR, peritumoral region; TF, tumor foci.
Figure 2
Figure 2
Multi-omics analysis of metabolic reprogramming across tumor tissues. (A) Schematic representation of the workflow for untargeted metabolomics and proteomics. (B) Enrichment analysis showcasing significant pathways identified in spatial and untargeted metabolomics, along with a summary of their KEGG pathway secondary classifications. (C) PCA score plot derived from untargeted metabolomics data, comparing HC, TF, and PR. (D) Venn diagram highlighting the common significant differential metabolites between spatial and untargeted metabolomics. (E) Enrichment analysis of the overlapped significant differential metabolites of spatial and untargeted metabolomics. (F, G) Heatmaps illustrating the patterns of overlapped metabolites above from spatial metabolomics (F) and untargeted metabolomics (G), data analysis was performed via MetaboAnalyst 6.0 using ‘Euclidean’ distance and ‘Ward’ clustering method. (H) Venn diagram showing the significant differential proteins' overlap among comparisons: PR vs. HC, TF vs. HC, and PR vs. HC, (fold-change <0.7 or >1.5 and P-value of <0.05). (I) Gene Ontology (GO) biological process analysis for both downregulated (fold-change <0.7; P-value <0.05) and upregulated (fold-change >1.5; P-value <0.05) overlapped proteins above. (J) Summary of the top 20 enriched KEGG pathways, with a focus on the metabolism-related pathways. PR, peritumoral region; TF, tumor foci; HC, healthy control.
Figure 3
Figure 3
Visualization of reprogrammed arginine and proline metabolism in liver metastasis of AML mice. (A) Spatial metabolomics imagery alongside proteomics data underscores crucial metabolites and enzymes in the arginine and proline metabolism pathway and its extended metabolic networks. (Intensity in MS image color scale is relative value, in the names of metabolic pathways or enzymes, blue font denotes a decrease, red an increase, and black no change or undetected). (B) (B1–B8) Column charts detailing the abundance levels of metabolites detected by SM in the arginine and proline metabolism pathway. (C) (C1–C18) Column charts illustrating the protein abundance of crucial enzymes in the arginine and proline metabolism pathway. PR, peritumoral region; TF, tumor foci; HC, healthy control; Gatm, glycine amidinotransferase; Gamt, guanidinoacetate N-methyltransferase; Ckb, creatine kinase brain type; Arg1, arginase 1; Otc, ornithine transcarbamylase; Ass1, argininosuccinate synthase 1; Asl, argininosuccinate lyase; Azi2, 5-azacytidine induced 2; Agmat, agmatinase; Srm, spermidine synthase; Sms, spermine synthase; Gls, glutaminase; Glul, glutamate-ammonia ligase; Oat, ornithine aminotransferase; Aldh18a1, aldehyde dehydrogenase 18 family, member a1; Pycr, pyrroline-5-carboxylate reductase. For (B1) to (B8), with a sample size of n = 12, statistical analysis was conducted using the Student's t-test. For (C1) to (C18), where the sample size varied n = 4–6, one-way ANOVA was employed for statistical evaluation. Error bars represent the mean ± SEM. Statistical significance is denoted as follows: ∗P < 0.05, ∗∗P < 0.01, ∗∗∗P < 0.001, ∗∗∗∗P < 0.0001.
Figure 4
Figure 4
Reprogrammed metabolism was verified in AML patient samples. (A) Venn diagram showing the 145 common differential proteins between two datasets: (1) CD34+ BMNCs from non-leukemia patients (Ctrl) vs BMNCs from AML patients (fold-change <0.7 or >1.5 and P-value of <0.05); (2) 1433 overlapping differential proteins from AML mice samples mentioned in Fig. 2H. (B) A summary of secondary classifications of significant KEGG pathway derived from common differential proteins in Fig. 4B. (C)The significant enriched metabolism part of KEGG pathways in Fig. 4B. (D) Targeted metabolomics validated important metabolites in the creatine pathway and its extended metabolic networks. Red font indicates an increase in metabolite levels in AML compared to Ctrl, blue signifies a decrease, and black denotes no change. Solid lines represent a direct relationship within the metabolic pathway, while dashed lines indicate that skip over some unrelated metabolites. (E1‒E11) A total of 11 metabolites were detected. The concentrations of phosphocreatine, l-arginine, creatinine, citrulline, proline, l-glutamate, glutamine, l-aspartic acid, ornithine, S-adenosylmethionine and creatine were shown by bar chart. For (A) to (C), with a sample size of n = 5–6, statistical analysis was conducted using the Student's t-test. For (D) to (E), with a sample size of n = 5 (Ctrl group) and n = 6 (AML group), 3 technical replicates, Student's t-test was employed for statistical evaluation. Error bars represent the mean ± SEM. Statistical significance is denoted as follows: ∗P < 0.05, ∗∗P < 0.01, ∗∗∗P < 0.001, ∗∗∗∗P < 0.0001.
Figure 5
Figure 5
Enhancement of the creatine pathway in liver metastasis of AML mice through biosynthetic and transport mechanisms. (A) Illustration of creatine accumulation in AML cells via two ways: synthesis from arginine and glycine through Gatm and Gamt enzymes and import via the creatine transporter Slc6a8. (B, C) The concentrations of creatine in plasma (B) and liver metastasis (C) of AML mice and healthy mice were quantified using ELISA. (D, E) Levels of creatine kinase B (Ckb) in plasma (D) and liver metastasis (E) of AML mice and healthy mice were quantified using ELISA. (F) Immunohistochemical analysis was conducted to compare the expression of Gatm, Gamt, and Slc6a8 between tumor foci and the peritumoral region. (G–I) Relative mRNA expression levels of Ckb (G), Gatm (H), and Slc6a8 (I) in the liver metastasis of AML mice and healthy mice were evaluated using qRT-PCR. PR, peritumoral region; TF, tumor foci; HC, healthy control. For (B) and (D), each having a sample size of n = 6, the Student's t-test was utilized for statistical analysis. For (C) and (E), with sample sizes ranging from n = 3–8, statistical evaluation was performed using one-way ANOVA. For (F), which included a minimum sample size of 5, the Student's t-test was applied for statistical analysis. For (G) to (I), where the sample size varied between n = 3–5, one-way ANOVA was employed for statistical evaluation. Error bars represent the mean ± SEM. Statistical significance is denoted as follows: ∗P < 0.05, ∗∗P < 0.01, ∗∗∗P < 0.001, ∗∗∗∗P < 0.0001.
Figure 6
Figure 6
Creatine promotes proliferation and infiltration of AML cells in vitro and in vivo. (A–D) Evaluation of cell proliferation in AML cell lines treated with either 5 mmol/L creatine, 10 mmol/L ompenaclid, or a combination of 5 mmol/L creatine and 10 mmol/L ompenaclid over durations of 12, 24, and 48 h, utilizing the CCK8 assay. (E) Representative in vivo imaging system (IVIS) luciferase images depicting AML mice administered with PBS (control group), 85 mg/mL creatine (Creatine group), or 130 mg/mL ompenaclid (Ompenaclid group) water, 200 μL via oral gavage three times per week. (F) The bar chart shows the total flux of AML mice in different groups. For (A) to (D), the sample size n = 6, two-way ANOVA was employed for statistical evaluation. For (E) and (F), with sample sizes n = 4, statistical evaluation was performed using one-way ANOVA. Error bars represent the mean ± SEM. Statistical significance is denoted as follows: ∗P < 0.05, ∗∗P < 0.01, ∗∗∗P < 0.001, ∗∗∗∗P < 0.0001.
Figure 7
Figure 7
Creatine plays a pivotal role in enhancing both oxidative phosphorylation and glycolysis in leukemia cells. (A–H) C1498 and THP-1 were treated with either 5 mmol/L creatine, 10 mmol/L ompenaclid in media containing 1% FBS for 24 h in advance, then oxygen consumption rate (OCR) (A–D) and extracellular acidification rate (ECAR) (E–H) were detected using a Seahorse XF-96 Extracellular Flux Analyzer. Oligomycin (oligo) is a complex V inhibitor, fluoro-carbonyl cyanide phenylhydrazone (FCCP) is an uncoupling agent, and rotenone and antimycin A are complex I and complex III inhibitors, respectively. 2-DG is a competitive hexokinase inhibitor.

Similar articles

Cited by

References

    1. Papaemmanuil E., Gerstung M., Bullinger L., Gaidzik V.I., Paschka P., Roberts N.D., et al. Genomic classification and prognosis in acute myeloid leukemia. N Engl J Med. 2016;374:2209–2221. - PMC - PubMed
    1. Döhner H., Weisdorf D.J., Bloomfield C.D. Acute myeloid leukemia. N Engl J Med. 2015;373:1136–1152. - PubMed
    1. Society A.C. Key statistics for acute myeloid leukemia (aml) 2024. https://www.cancer.org/cancer/types/acute-myeloid-leukemia/about/key-sta... Available from:
    1. Shimony S., Stahl M., Stone R.M. Acute myeloid leukemia: 2023 update on diagnosis, risk-stratification, and management. Am J Hematol. 2023;98:502–526. - PubMed
    1. Facts SCS. Cancer stat facts: Leukemia — acute myeloid leukemia (aml). Available from: https://seer.cancer.gov/statfacts/html/amyl.html.

LinkOut - more resources