. 2024 Oct;14(10):4329-4344.
doi: 10.1016/j.apsb.2024.07.022. Epub 2024 Aug 3.

Ribonucleotide reductase small subunit M2 promotes the proliferation of esophageal squamous cell carcinoma cells via HuR-mediated mRNA stabilization

Affiliations

Ribonucleotide reductase small subunit M2 promotes the proliferation of esophageal squamous cell carcinoma cells via HuR-mediated mRNA stabilization

Jing Zhang et al. Acta Pharm Sin B. 2024 Oct.

Abstract

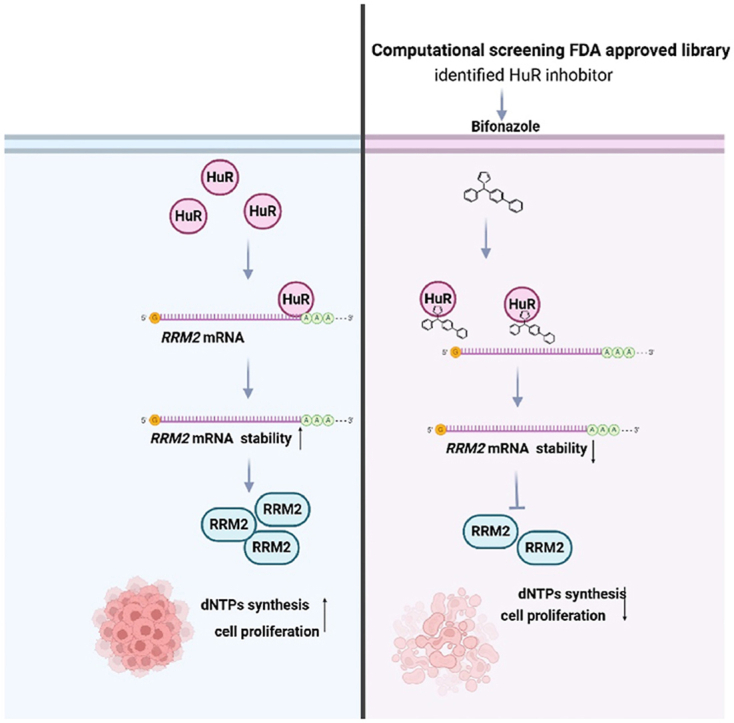
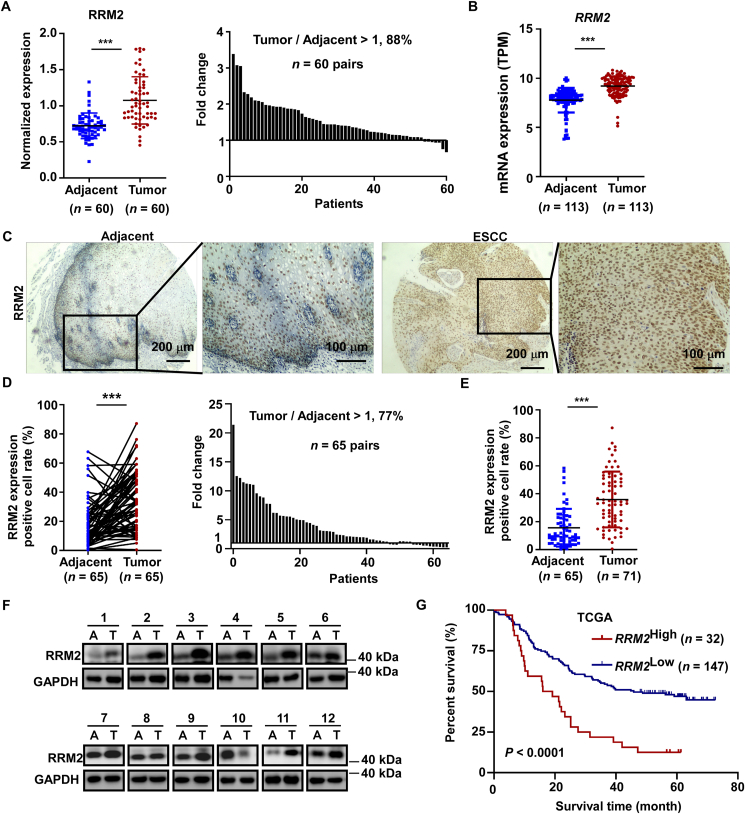
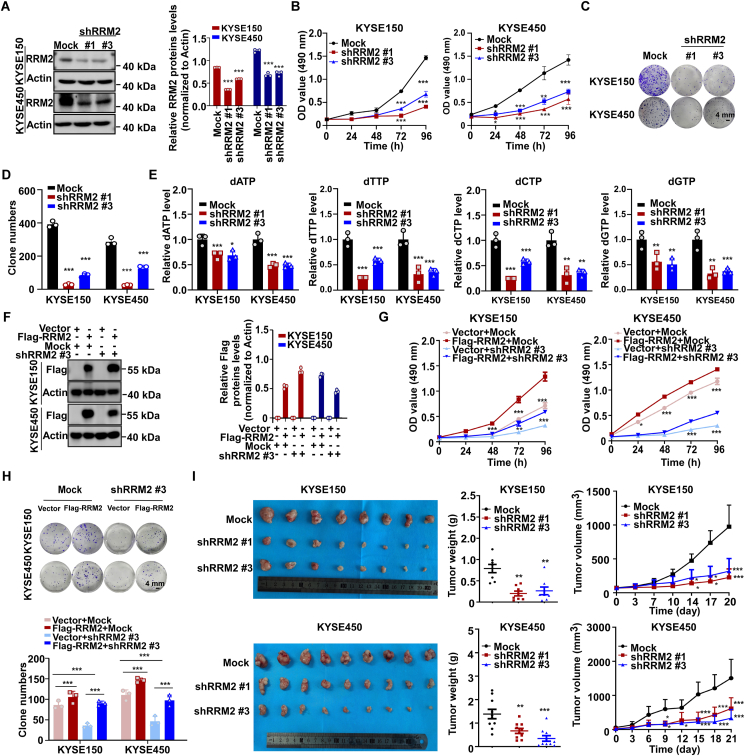
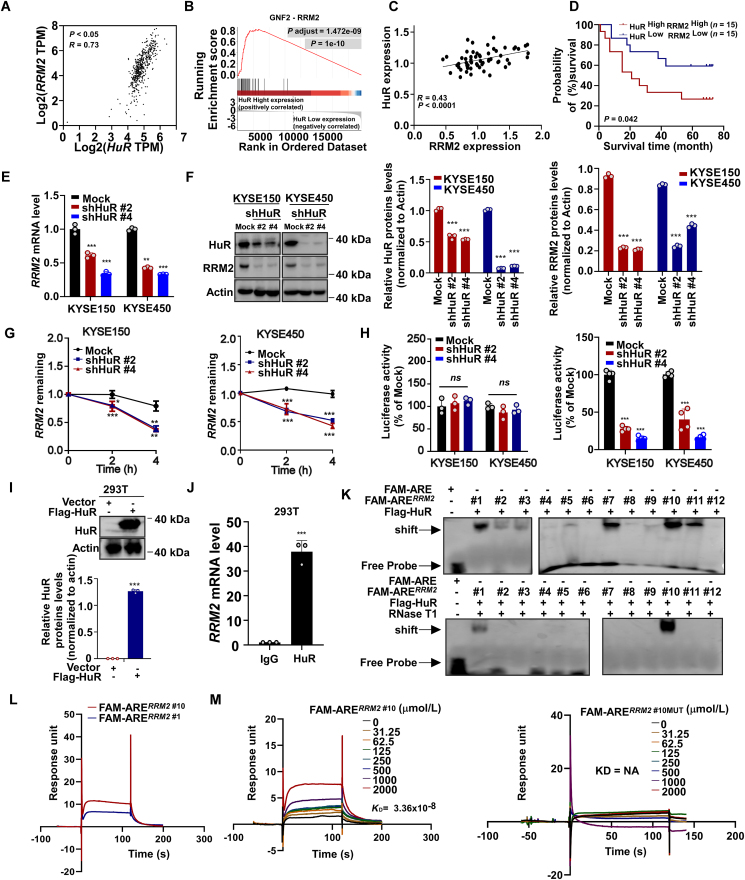
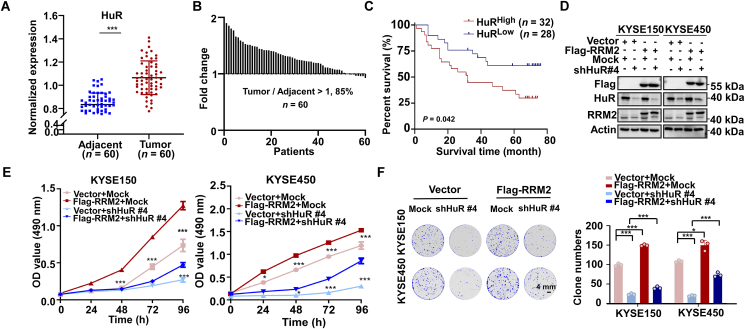
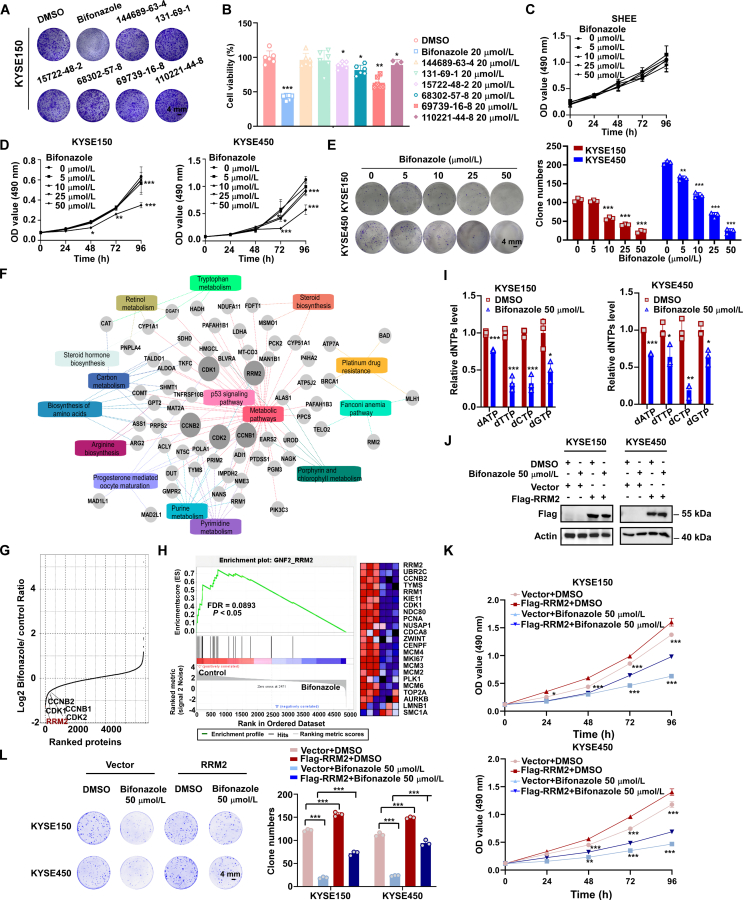
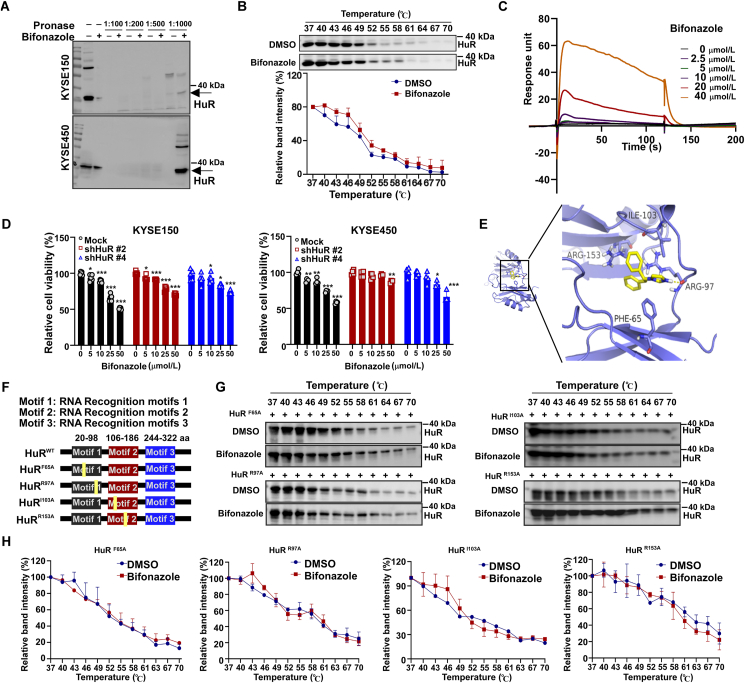
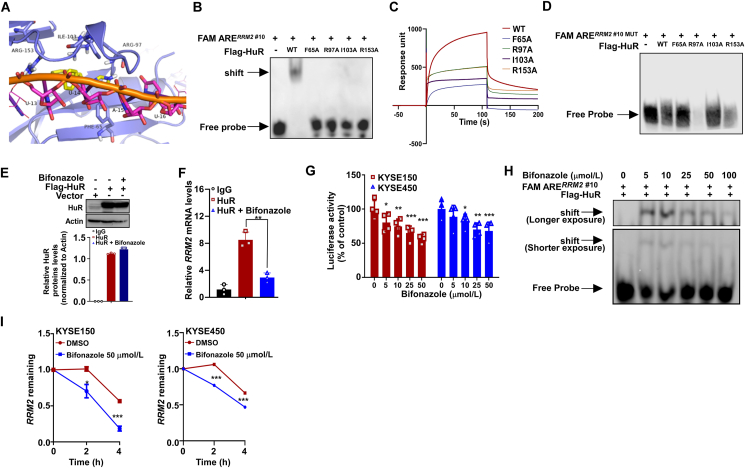
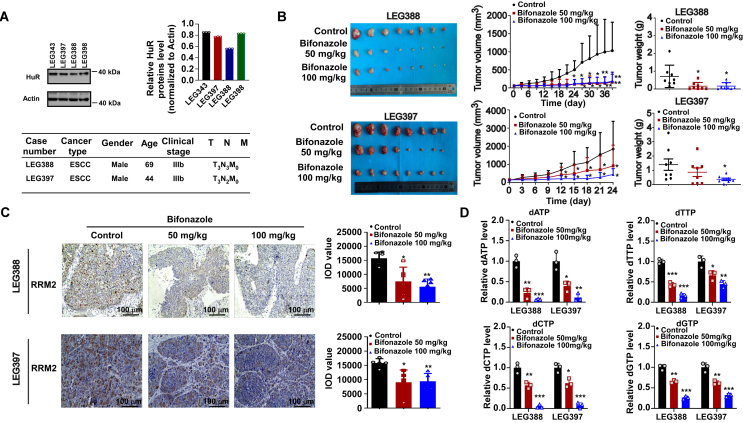
Esophageal squamous cell carcinoma (ESCC), a malignancy of the digestive system, is highly prevalent and the primary cause of cancer-related deaths worldwide due to the lack of early diagnostic biomarkers and effective therapeutic targets. Dysregulated ribonucleotide reductase (RNR) expression has been confirmed to be causally linked to tumorigenesis. This study demonstrated that ribonucleotide reductase small subunit M2 (RRM2) is significantly upregulated in ESCC tissue and that its expression is negatively correlated with clinical outcomes. Mechanistically, HuR promotes RRM2 mRNA stabilization by binding to the adenine/uridine (AU)-rich elements (AREs) within the 3'UTR, resulting in persistent overexpression of RRM2. Furthermore, bifonazole is identified as an inhibitor of HuR via computational screening and molecular docking analysis. Bifonazole disrupts HuR-ARE interactions by competitively binding to HuR at F65, R97, I103, and R153 residues, resulting in reduced RRM2 expression. Furthermore, bifonazole exhibited antitumor effects on ESCC patient-derived xenograft (PDX) models by decreasing RRM2 expression and the dNTP pool. In summary, this study reveals the interaction network among HuR, RRM2, and bifonazole and demonstrated that bifonazole is a potential therapeutic compound for ESCC through inhibition of the HuR/RRM2 axis.

Keywords: AU-rich elements (AREs); Bifonazole; Cell proliferation; Esophageal squamous cell carcinoma (ESCC); Hu antigen R (HuR); Ribonucleotide reductase small subunit M2 (RRM2); dNTP; mRNA stability.


Conflict of interest statement

The authors declare no conflict of interests.

Figures

Image 1
Graphical abstract
Figure 1
Figure 1
RRM2 is upregulated in ESCC. (A) RRM2 protein levels in ESCC tumor samples compared with adjacent samples (left). Waterfall plot showing the fold changes in RRM2 protein levels in ESCC tumor samples compared with adjacent samples (right), n = 60. (B) RRM2 mRNA levels in ESCC tumor samples compared with adjacent samples in the GEO database (GSE44021), n = 113. (C) Representative images of IHC staining in ESCC tumor samples and paired adjacent tissue samples (scale bar: 100 μm; scale bar: 200 μm). (D) RRM2 protein levels in 65 pairs of ESCC tissues (left) and the waterfall plot showing the fold changes in RRM2 protein levels in the 65 pairs of ESCC tissues and adjacent tissues (right), n = 65. (E) IHC staining was used to evaluate RRM2 protein expression in microarrays of unpaired ESCC tissues, adjacent = 65, tumor = 71. (F) Protein levels of RRM2 in 12 pairs of ESCC tumor tissues and adjacent tissues, as determined by Western blotting, n = 12. (G) Relationship between the RRM2 mRNA expression level and overall survival in patients represented in the TCGA database. The data are presented as the mean ± SD; ∗P < 0.05; ∗∗P < 0.01; ∗∗∗P < 0.001.
Figure 2
Figure 2
RRM2 overexpression promotes ESCC cell proliferation. (A) Left: Western blotting was used to determine the knockdown efficiency of shRRM2 in ESCC cells. Right: Densitometric analysis of RRM2 protein levels in RRM2-knockdown ESCC cells (n = 3). (B) Cell counts for KYSE150 and KYSE450 cells transfected with shRRM2 or mock shRNA. At the 0, 24, 48, 72, and 96 h time points, the cells were treated with MTT solution (0.5 mg/mL), and after 2 h of incubation, the absorbance was measured using a microplate reader. (C, D) Colony formation of KYSE150 and KYSE450 cells after 7 days (scale bar: 4 mm). (E) KYSE150 and KYSE450 cells transfected with shRRM2 or mock shRNA were used for a dNTP pool assay. (F) Left: RRM2 overexpression was restored with the pcDNA3.1-3 × flag-RRM2 plasmid in RRM2-knockdown KYSE150 and KYSE450 cells, and Western blotting was performed to measure the protein level of Flag. Right: Densitometric analysis of RRM2 protein levels in ESCC (n = 3). (G) Cell counts for KYSE150 and KYSE450 cells with restoration of RRM2 overexpression. At the 0, 24, 48, 72, and 96 h time points, the cells were treated with MTT solution (0.5 mg/mL), and after 2 h of incubation, DMSO was used to stop the reaction and the absorbance was measured using a microplate reader. (H) Colony formation of KYSE150 and KYSE450 cells after 7 days (scale bar: 4 mm). (I) Orthotopic xenografts were established in nude mice with shRRM2 and control ESCC cells (1 × 107 cells/mouse; KYSE150, 8 mice per group; KYSE450, 9 mice per group). After 20 (KYSE150) and 21 (KYSE450) days, the tumor masses were excised and photographed (left). The tumor weight was calculated (middle). The tumor volume was also calculated, and tumor growth curves were plotted (right). The data are presented as the mean ± SD; ∗P < 0.05; ∗∗P < 0.01; ∗∗∗P < 0.001.
Figure 3
Figure 3
HuR interacts with RRM2 via direct binding to the RRM2 3′UTR. (A) The correlation between the mRNA levels of RRM2 and HuR was evaluated based on data derived from GEPIA. (B) GSEA was used to explore the expression profiles of genes related to HuR expression in TCGA datasets. (C) The association between the protein levels of RRM2 and HuR was investigated in a cohort of 60 paired ESCC tissues. (D) Overall survival analysis was performed to compare survival between the RRM2low and RRM2high groups based on the HuR expression levels in 60 pairs of ESCC tumor samples. (E) qPCR analysis was performed to assess measure the levels of RRM2 in HuR knockdown KYSE150 and KYSE450 cells. (F) Left: Representative Western blotting results. Right: Densitometric analysis of RRM2 protein levels in HuR knockdown KYSE150 and KYSE450 cells (n = 3). (G) Influence of HuR on the mRNA stability of RRM2 in KYSE150 and KYSE450 cells treated with actinomycin D (0.1 μg/mL). The mRNA abundance was estimated using qPCR. (H) Left: The relative luciferase activity of pGL4.17-RRM2-Promoter was measured in KYSE150 and KYSE450 cells transfected with shHuR or mock shRNA. Right: The relative luciferase activity of pmirGLO-RRM2 3′UTR was measured in KYSE150 and KYSE450 cells transfected with shHuR or mock shRNA. Firefly luciferase activity was measured and normalized to Renilla luciferase activity. (I) Upper: Western blotting was used to determine the overexpression efficiency of HuR in 293T cells. Lower: Densitometric analysis of HuR protein levels in 293T cells (n = 3). (J) An anti-HuR antibody was utilized in the RIP assay. After incubation of 293T cells with protein G-agarose beads coated with IgG or the anti-HuR antibody, RNA was extracted from 293T cells. The specific anti-HuR-binding regions in RRM2 mRNA were identified using qPCR. (K) EMSAs were performed using purified HuR protein, biotin-labeled ARERRM2 probes (125 μmol/L) and 2000 U/mL RNase T1. (L, M) SPR analysis revealed the interaction between HuR and RRM2 mRNA. ARERRM2 probes (WT or mutant) were fixed on SA chips. The raw response (RU) curves were fitted to a site-specific kinetic model to calculate a Kd value for the interaction. The data are presented as the mean ± SD; ∗P < 0.05; ∗∗P < 0.01; ∗∗∗P < 0.001, “ns” indicates no statistically significant difference.
Figure 4
Figure 4
HuR promotes ESCC progression by regulating the expression of RRM2 in ESCC cells. (A) The expression pattern of HuR in 60 pairs of ESCC tumors and their corresponding tissues was determined using proteomic analysis, n = 60. (B) A waterfall plot was generated to illustrate the fold change in the expression of HuR in the 60 ESCC clinical samples compared to the paired adjacent tissues, n = 60. (C) Kaplan–Meier survival analysis was performed to compare the survival time of ESCC patients between the high HuR expression group and the low HuR expression group. (D) RRM2 overexpression was restored in HuR knockdown KYSE150 and KYSE450 cells, and Western blotting analysis was performed to measure the expression levels of RRM2, Flag, and HuR. (E) Cell counts for KYSE150 and KYSE450 cells transfected with shHuR after restoration of RRM2 overexpression. At the 0, 24, 48, 72, and 96 h, the cells were treated with MTT solution (0.5 mg/mL), and after 2 h of incubation. The absorbance was measured using a microplate reader. (F) Colony formation of HuR knockdown KYSE150 and KYSE450 cells with restoration of RRM2 overexpression after 7 days (scale bar: 4 mm). The data are presented as the mean ± SD; ∗P < 0.05; ∗∗P < 0.01; ∗∗∗P < 0.001.
Figure 5
Figure 5
Bifonazole inhibits the proliferation of ESCC cells by regulating the expression of RRM2. (A) A colony formation assay was performed to evaluate the suppressive effects of the top 7 candidate compounds (20 μmol/L) on ESCC cells (scale bar: 4 mm). (B) MTT assays were applied to assess cell viability at 96 h. (C) The normal esophageal cell line SHEE was treated with bifonazole (0, 5, 10, 25, or 50 μmol/L). At the 0, 24, 48, 72, and 96 h, the cells were treated with MTT solution (0.5 mg/mL), and after 2 h of incubation. The absorbance was measured using a microplate reader. (D) KYSE150 and KYSE450 cells were treated with different concentrations of bifonazole for 0, 24, 48, 72, and 96 h. The cells were then treated with MTT solution (0.5 mg/mL), and after 2 h of incubation, the absorbance was measured using a microplate reader. (E) ESCC cells were treated with bifonazole (0, 5, 10, 25, and 50 μmol/L), and colonies were stained with 3% crystal violet after treatment for 12 days. (F) Proteomic analysis was performed to identify the differentially expressed proteins between the control (DMSO) and bifonazole (50 μmol/L) groups. We focused mainly on the proteins with enrichment in the downregulated pathways. The size of each point represents the degree of differential expression. (G) Rankings of RRM2, CDK1, CDK2, CCNB1, and CCNB2 in the quantitative complete proteome according to the Log2 fold change in their expression between the DMSO- and bifonazole-treated groups. (H) GSEA showed the enrichment of RRM2-related proteins after bifonazole treatment. (I) ESCC cells treated with bifonazole (50 μmol/L) were used for a dNTP pool assay. Paired Student's t test was used for statistical analysis. (J) RRM2 overexpression was restored in KYSE150 and KYSE450 cells prior to treatment with bifonazole (50 μmol/L), and Western blotting analysis was performed to measure the Flag expression level (n = 3). (K, L) Cell proliferation and colony formation assays were performed in KYSE150 and KYSE450 cells treated with bifonazole (50 μmol/L) after restoration of RRM2 overexpression (scale bar: 4 mm). The data are presented as the mean ± SD; ∗P < 0.05; ∗∗P < 0.01; ∗∗∗P < 0.001.
Figure 6
Figure 6
Bifonazole directly targets HuR. (A) The change in the binding intensity between bifonazole and HuR after pronase treatment was assessed. (B) Upper: Western blotting was performed to analyze the results of the CETSA. Lower: relative band intensity of HuR in the control and bifonazole (50 μmol/L) treatment groups. (C) SPR analysis was conducted to examine the interaction between bifonazole and HuR. The raw response (RU) curves were fitted to a site-specific kinetic model to calculate a Kd value for the interaction. (D) HuR knockdown and mock shRNA-transfected KYSE150 and KYSE450 cells were treated with bifonazole (0, 5, 10, 25, and 50 μmol/L), and cell viability was analyzed at 48 h. (E) The crucial amino acids involved in the interaction between HuR and bifonazole were identified by in silico docking analysis. (F) The diagram shows different HuR mutation sites. (G) The binding between HuR mutant proteins and bifonazole was examined using Western blotting analysis and CETSA. (H) Relative band intensities of HuR mutant proteins in the control and bifonazole treatment groups. The data are presented as the mean ± SD; ∗P < 0.05; ∗∗P < 0.01; ∗∗∗P < 0.001.
Figure 7
Figure 7
Bifonazole binds competitively with ARERRM2 to HuR. (A) Diagram showing the selected key amino acids involved in the interactions of bifonazole (yellow) and ARERRM2 (orange) with HuR (purple). (B) EMSA was performed with 3′-biotin-labeled ARERRM2 probes and purified HuR (WT or mutant) protein. The concentration of the biotinylated probe was 2 μg/mL. (C) SPR analysis of the interactions between HuR (WT or mutant) and the biotin-labeled ARERRM2 probes. The raw response (RU) curves were fitted to a site-specific kinetic model to calculate a Kd value for the interaction. (D) EMSA was performed with 3′-biotin-labeled ARERRM2#10MUT and purified HuR WT protein. The concentration of the biotinylated probe was 125 μmol/L. (E) Upper: Western blotting was used to determine the overexpression efficiency of HuR in 293T cells (treated with bifonazole or left untreated). Lower: Densitometric analysis of the HuR protein level in 293T cells (n = 3). (F) An anti-HuR antibody was utilized in the RIP assay. After incubation of 293T cells with protein G-agarose beads coated with IgG or the anti-HuR antibody, RNA was extracted. The specific anti-HuR-binding regions in RRM2 mRNA were identified using qPCR. The concentration of bifonazole was 50 μmol/L, and the treatment time was 24 h. (G) Relative luciferase activity of pmirGLO-RRM2 3′UTR in ESCC cells treated with either 50 μmol/L bifonazole or DMSO. The activity of firefly luciferase was measured and then normalized to the activity of Renilla luciferase. (H) EMSA was performed to analyze the interaction between HuR and RRM2 in the presence of bifonazole (0, 5, 10, 25, and 50 μmol/L). The mixture was incubated for 15 min. (I) qPCR was performed to estimate the impact of bifonazole on RRM2 mRNA stability in ESCC cells treated with actinomycin D (0.1 μg/mL). The data are presented as the mean ± SD; ∗P < 0.05; ∗∗P < 0.01; ∗∗∗P < 0.001.
Figure 8
Figure 8
Bifonazole exhibits antitumor effects in vivo. (A) Protein levels of HuR in different PDX tumors (left). Densitometric analysis of HuR protein levels in ESCC tissues (n = 3) (right). Clinical information corresponding to two PDXs (lower). (B) Mice were treated with bifonazole (50 mg/kg, 100 mg/kg) or sterile water. After 36 or 24 days, the tumor masses were excised and photographed (left). The tumor volume and growth curves were generated (middle). The tumor weight was measured (right), n = 8. (C) Representative images of IHC staining for RRM2 in LEG388 and LEG397 tumor tissues (50 × magnification) after DAB staining. Scale bar, 100 μm (left). The number of positive cells was calculated using the Image-Pro Plus software program (right), n = 3. (D) Tissues from the LEG388 and LEG397 tumors from mice treated with bifonazole were used for a dNTP pool assay, n = 3. The data are presented as the mean ± SD; ∗P < 0.05; ∗∗P < 0.01; ∗∗∗P < 0.001.

Similar articles

Cited by

References

    1. Zhang G.C., Yu X.N., Guo H.Y., Sun J.L., Liu Z.Y., Zhu J.M., et al. PRP19 enhances esophageal squamous cell carcinoma progression by reprogramming SREBF1-dependent fatty acid metabolism. Cancer Res. 2023;83:521–537. - PubMed
    1. Chen L., Zhang W., Chen D., Yang Q., Sun S., Dai Z., et al. RBM4 dictates ESCC cell fate switch from cellular senescence to glutamine-addiction survival through inhibiting LKB1–AMPK–axis. Signal Transduct Target Ther. 2023;8:159. - PMC - PubMed
    1. He S., Xu J., Liu X., Zhen Y. Advances and challenges in the treatment of esophageal cancer. Acta Pharm Sin B. 2021;11:3379–3392. - PMC - PubMed
    1. Yang Y.M., Hong P., Xu W.W., He Q.Y., Li B. Advances in targeted therapy for esophageal cancer. Signal Transduct Target Ther. 2020;5:229. - PMC - PubMed
    1. Wei Y., Wu W., Jiang Y., Zhou H., Yu Y., Zhao L., et al. Nuplazid suppresses esophageal squamous cell carcinoma growth in vitro and in vivo by targeting pak4. Br J Cancer. 2022;126:1037–1046. - PMC - PubMed

LinkOut - more resources