. 2024 Oct;14(10):4526-4543.
doi: 10.1016/j.apsb.2024.06.027. Epub 2024 Jun 28.

Disease-derived circulating extracellular vesicle preconditioning: A promising strategy for precision mesenchymal stem cell therapy

Affiliations

Disease-derived circulating extracellular vesicle preconditioning: A promising strategy for precision mesenchymal stem cell therapy

Ke Lv et al. Acta Pharm Sin B. 2024 Oct.

Abstract

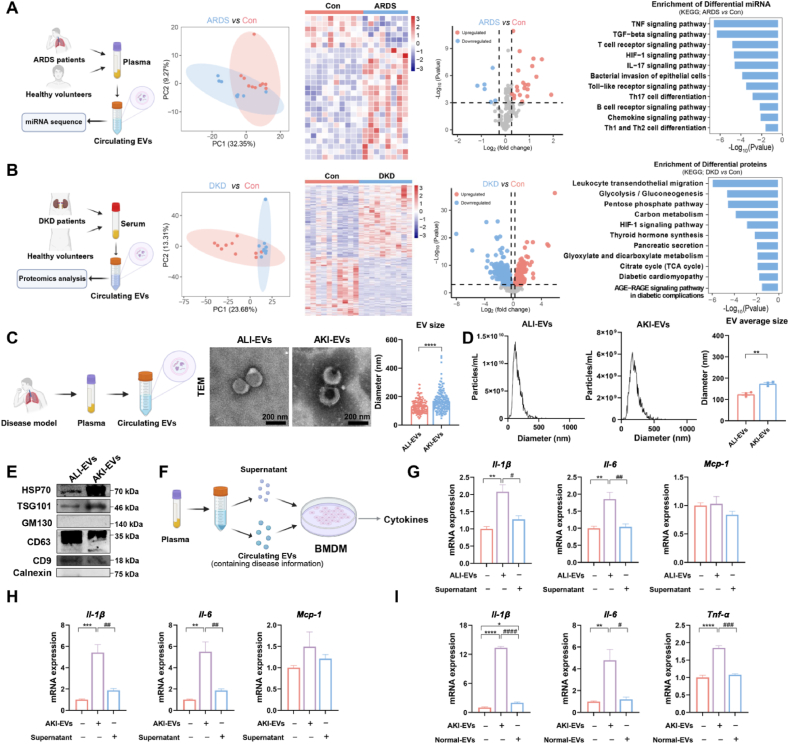
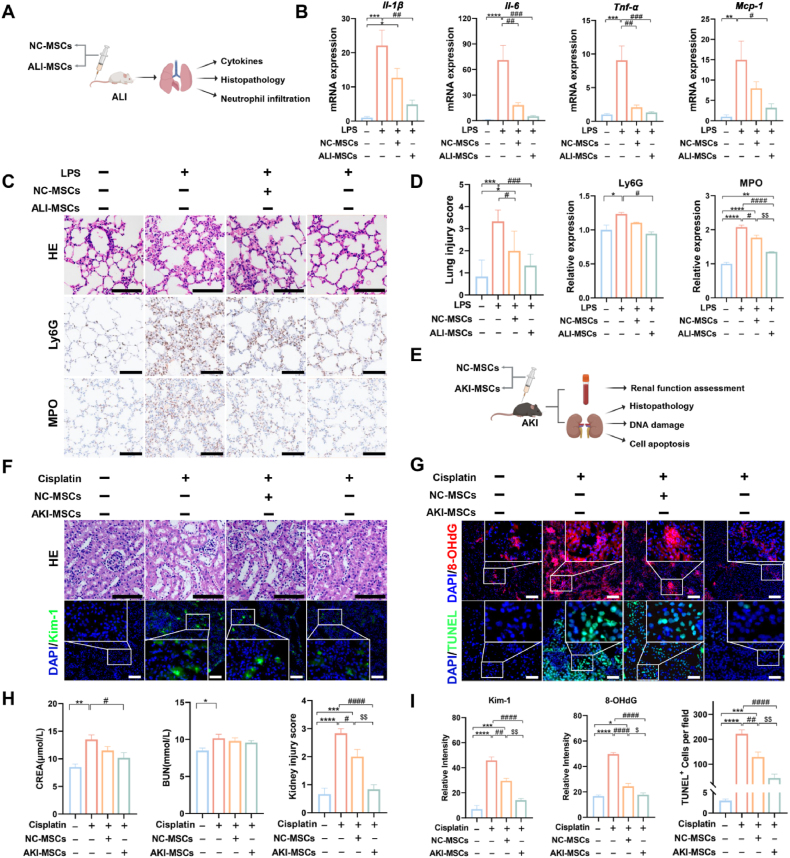
Mesenchymal stem cell (MSC)-based therapies have emerged as promising methods for regenerative medicine; however, how to precisely enhance their tissue repair effects is still a major question in the field. Circulating extracellular vesicles (EVs) from diseased states carry diverse pathological information and affect the functions of recipient cells. Based on this unique property, we report that disease-derived circulating EV (disease-EV) preconditioning is a potent strategy for precisely enhancing the tissue repair potency of MSCs in diverse disease models. Briefly, plasma EVs from lung or kidney tissue injuries were shown to contain distinctly enriched molecules and were shown to induce tissue injury-specific gene expression responses in cultured MSCs. Disease-EV preconditioning improved the performance (including proliferation, migration, and growth factor production) of MSCs through metabolic reprogramming (such as via enhanced oxidative phosphorylation and lipid metabolism) without inducing an adverse immune response. Consequently, compared with normal MSCs, disease-EV-preconditioned MSCs exhibited superior tissue repair effects (including anti-inflammatory and antiapoptotic effects) in diverse types of tissue injury (such as acute lung or kidney injury). Disease-derived EVs may serve as a type of "off-the-shelf" product due to multiple advantages, such as flexibility, stability, long-term storage, and ease of shipment and use. This study highlights the idea that disease-EV preconditioning is a robust strategy for precisely enhancing the regenerative capacity of MSC-based therapies.

Keywords: Cell death; Circulating extracellular vesicle; Inflammation; Mesenchymal stem cell; Metabolic reprogramming; Preconditioning; Regenerative medicine; Tissue injury.


Conflict of interest statement

The authors declare that they have no competing interests in this work.

Figures

Image 1
Graphical abstract
Figure 1
Figure 1
Comparison of the conventional preconditioning strategy and the circulating disease-related EV preconditioning strategy. The conventional preconditioning strategy uses a single factor (e.g., cytokines, hormones, or hypoxia) to prime MSCs but lacks disease specificity. A novel preconditioning strategy was proposed. Disease-derived circulating EVs from body fluids (e.g., blood) can deliver disease information to MSCs when they are preconditioned with MSCs for precisely enhanced therapeutic effects.
Figure 2
Figure 2
Disease-derived EVs are enriched in diverse tissue injury-related biomolecules and can be presented to cultured cells. (A) The experimental scheme of plasma miRNA sequencing in ARDS patients and healthy volunteers and the representative PCA score plot, differential miRNA heatmap, volcano plot, and KEGG enrichment pathway (n = 8–10). (B) The experimental scheme of serum proteomics in ARDS patients and healthy volunteers and the representative PCA map, differential protein score plot, volcano plot, and KEGG enrichment pathway (n = 10). (C) Experimental schematic of disease-derived EVs isolated from plasma and representative TEM micrographs of ALI-EVs and AKI-EVs (scale bar = 200 nm). The sizes of the ALI-EVs and AKI-EVs were determined by TEM (n = 140 EVs). ∗∗∗∗P < 0.0001, vs. the ALI-EVs group. (D) The size distributions of ALI-EVs and AKI-EVs were measured via NTA. The average sizes of the ALI-EVs and AKI-EVs were measured by NTA (n = 3). ∗∗P < 0.01, vs. the ALI-EVs group. (E) Western blot analysis of EV-positive markers (HSP70, TSG101, CD63, and CD9) and a negative control marker (GM130 and Calnexin). (F) Schematic process for evaluating the pathological role of EVs. (G) Cytokine (Il-1β, Il-6, and Mcp-1) levels in macrophages treated with ALI-EVs or EV-free supernatant were measured (n = 3). ∗∗P < 0.01, vs. the Con group; #P < 0.05, ##P < 0.01, vs. the ALI-EV group. (H) Cytokine (Il-1β and Il-6) and chemokine (Mcp-1) levels in BMDMs treated with AKI-EVs or EV-free supernatants were measured (n = 3). ∗∗P < 0.01, ∗∗∗P < 0.001, vs. the Con group; ##P < 0.01, vs. the AKI-EVs group. (I) Cytokine (Il-1β, Il-6, and Tnf-α) levels in BMDMs treated with AKI-EVs or normal EVs were measured (n = 3). ∗P < 0.05, ∗∗P < 0.01, ∗∗∗∗P < 0.0001, vs. the Con group; #P < 0.05, ###P < 0.001, ####P < 0.0001, vs. the AKI-EVs group.
Figure 3
Figure 3
Disease-EV preconditioning induces distinct disease-specific gene expression responses in cultured MSCs. (A) The experimental process of circulating EV-preconditioned MSCs for mRNA and miRNA sequencing (n = 3). (B) Representative images of disease-EV uptake stained with phalloidine (green), DAPI (blue), and MemGlow-labeled circulating EVs (red) (scale bar = 200 μm) (n = 3). (C) PCA score plot of mRNAs and miRNAs representing discrepancies between different disease-related EV preconditioning regimens. (D) Heatmap of the DEGs between different disease EV preconditioning regimens. (E) Venn diagram representing the number of unique and overlapping genes. (F) GO analysis of the unique (left panel) and common (right panel) genes upregulated in response to preconditioning with different disease-related EVs. (G) Heatmap of the differentially expressed miRNAs between EVs from patients with different diseases. (H) Venn diagram representing the number of unique and overlapping miRNAs. (I) KEGG analysis of the upregulated miRNAs related to precourse treatment with different disease-related EVs. (J) Schematic illustrating the diverse tissue injury-related genes and pathways involved in the preconditioning of MSCs with different disease-related EVs.
Figure 4
Figure 4
Disease-EV preconditioning enhances the extent of tissue repair mediated by MSCs. (A) Schematic illustrating the evaluation of proliferation, migration, and GF production in MSCs with or without disease-related EVs. (B–C) The proliferation and migration rates and GF (KGF, HGF, FGF2, and VEGF) production of MSCs with or without disease-related EV treatment. ∗P < 0.05, ∗∗P < 0.01, ∗∗∗P < 0.001, ∗∗∗∗P < 0.0001, vs. the Con group. (D) The metabolomics and lipidomic data of disease-related EVs preconditioned from MSCs (n = 5). (E) The PLS-DA plot and heatmap of metabolites representing discrepancies between different disease-related EV preconditioning methods. (F) Heatmap of the relative abundance of citrate cycle, OXPHOS, and FA biosynthesis metabolites in MSCs treated with or without disease-related EVs. (G) Integrated pathway analysis of upregulated DEGs and differential DEMs. (H) Heatmap of lipids representing discrepancies between preconditioning with different disease-related EVs. (I) The number of lipids that differed between ALI-MSCs or AKI-MSCs and NC-MSCs. (J) The key enzymes involved in lipid biosynthesis. (K) Schematic illustrating the mechanism by which the citrate cycle, OXPHOS, and FA biosynthesis enhance MSC proliferation and migration and GF production in MSCs with diseased EVs.
Figure 5
Figure 5
The underlying mechanism of enhanced proliferation, migration, and GF production in cultured MSCs. (A) Schematic illustrating the FCCP treatment experiment (n = 3–5). (B–D) The proliferation and migration rates and GF (FGF2, KGF, HGF, and VEGF) production in disease-derived EVs preconditioned with MSCs with or without FCCP. ∗P < 0.05, ∗∗P < 0.01, ∗∗∗∗P < 0.0001, vs. the Con group; #P < 0.05, ##P < 0.01, vs. the disease EVs group. (E) Schematic illustrating the iSCD1 treatment experiment (n = 3–5). (F–H) Proliferation and migration rates and GF (FGF2, KGF, HGF, and VEGF) production in disease-derived EVs preconditioned with MSCs with or without iSCD1. ∗P < 0.05, ∗∗P < 0.01, vs. the Con group; #P < 0.05, ##P < 0.01, ###P < 0.001, vs. the disease EVs group.
Figure 6
Figure 6
Disease-EV preconditioning improves the tissue-protective potency of MSCs in vitro. (A) Experimental scheme for coculturing preconditioned MSCs with LPS-induced inflammatory macrophages (n = 3). (B) Measurement of cytokine (Il-6, Ifn-γ, and Tnf-α) mRNA levels in inflammatory macrophages treated with or without NC-MSCs or preconditioned MSCs by qPCR. ∗P < 0.05, ∗∗P < 0.01, ∗∗∗P < 0.001, ∗∗∗∗P < 0.0001, vs. the Con group; #P < 0.05, ##P < 0.01, ###P < 0.001, ####P < 0.0001, vs. the LPS group; $P < 0.05, $$$$P < 0.0001, vs. the NC-MSCs group; @P < 0.05, vs. the ALI-MSCs group. (C) Experimental scheme of coculturing preconditioned MSCs with cisplatin-induced apoptotic TECs (n = 3). (D) Measurement of kidney injury marker (KIM-1 and NGAL) and apoptotic molecule (BAX) mRNA levels in apoptotic TECs with or without NC-MSCs or preconditioned MSCs by qPCR. ∗P < 0.05, ∗∗P < 0.01, ∗∗∗P < 0.001, ∗∗∗∗P < 0.0001, vs. the Con group; ##P < 0.01, vs. the Cisplatin group. (E) Representative images of renal tubular epithelial cell NGAL and γ-H2AX IF staining (scale bar = 100 μm). (F) Quantitative analysis of NGAL and γ-H2AX protein expression. ∗∗∗∗P < 0.0001, vs. the Con group; ##P < 0.01, ###P < 0.001, ####P < 0.0001, vs. the Cisplatin group; $$P < 0.01, $$$P < 0.001, $$$$P < 0.0001, vs. the NC-MSCs group; @@P < 0.01, @@@P < 0.001, vs. the AKI-MSCs group.
Figure 7
Figure 7
In vivo distribution of disease-EV-preconditioned MSCs in micec (A) Schematic illustrating the biodistribution of MSCs in ALI mice with or without ALI-EV preconditioning (n = 3). (B) Representative IVIS images of organs harvested from mice at 24 h after intravenous injection of DiD-labeled MSCs. (C) Quantification of the fluorescence intensity in organs from ALI mice. ∗P < 0.05, vs. the NC-MSCs group. (D) Schematic illustrating the biodistribution of AKI-EV-preconditioned MSCs in AKI mice (n = 3). (E) Representative IVIS images of organs harvested from mice at 48 h after intravenous injection of DiD-labeled MSCs. (F) Quantification of the fluorescence intensity in organs from AKI mice. ∗P < 0.05, vs. the NC-MSCs group.
Figure 8
Figure 8
Disease-EV preconditioning improves the tissue repair potency of MSCs in diverse forms of tissue injury in vivo. (A) Experimental scheme of ALI induction and treatment (n = 3–6). (B) Measurement of cytokine (Il-1β, Il-6, and Tnf-α) and chemokine (Mcp-1) mRNA levels in the lungs of ALI mice treated with or without NC-MSCs or ALI-MSCs by qPCR. ∗P < 0.05, ∗∗P < 0.01, ∗∗∗P < 0.001, ∗∗∗∗P < 0.0001, vs. the Con group; #P < 0.05, ##P < 0.01, ###P < 0.001, vs. the LPS group. (C) Representative images of H&E-stained lungs (scale bar = 100 μm) and Ly6G and MPO IHC staining (scale bar = 100 μm). (D) Quantitative analysis of the lung injury score and Ly6G and MPO protein expression. ∗P < 0.05, ∗∗P < 0.01, ∗∗∗P < 0.001, ∗∗∗∗P < 0.0001, vs. the Con group; #P < 0.05, ###P < 0.001, ####P < 0.0001, vs. the LPS group. $$P < 0.01, vs. the NC-MSCs group. (E) Experimental scheme of AKI induction and treatment (n = 3–6). (F–G) Representative images of renal H&E staining (scale bar = 100 μm), Kim-1 and 8-OHdG IF staining (scale bar = 100 μm), and TUNEL staining (scale bar = 50 μm). (H) The kidney injury score and serum BUN and CREA levels 48 h after AKI. ∗P < 0.05, ∗∗P < 0.01, ∗∗∗P < 0.001, ∗∗∗∗P < 0.0001, vs. the Con group; #P < 0.05, ####P < 0.0001, vs. the Cisplatin group. $$P < 0.01, vs. the NC-MSCs group. (I) Quantitative analysis of Kim-1 and 8-OHdG protein expression and TUNEL+ cells. ∗P < 0.05, ∗∗∗P < 0.001, ∗∗∗∗P < 0.0001, vs. the Con group; ##P < 0.01, ####P < 0.0001, vs. the Cisplatin group. $P < 0.05, $$P < 0.01, vs. the NC-MSCs group.

References

    1. Margiana R., Markov A., Zekiy A.O., Hamza M.U., Al-Dabbagh K.A., Al-Zubaidi S.H., et al. Clinical application of mesenchymal stem cell in regenerative medicine: a narrative review. Stem Cell Res Ther. 2022;13 - PMC - PubMed
    1. Zhou J., Shi Y.F. Mesenchymal stem/stromal cells (MSCs): origin, immune regulation, and clinical applications. Cell Mol Immunol. 2023;20:555–557. - PMC - PubMed
    1. Ullah M., Liu D.D., Rai S., Dadhania A., Jonnakuti S., Concepcion W., et al. Reversing acute kidney injury using pulsed focused ultrasound and MSC therapy: a role for HSP-mediated PI3K/AKT signaling. Mol Ther Methods Clin Dev. 2020;17:683–694. - PMC - PubMed
    1. Xiao K., He W.X., Guan W., Hou F., Yan P., Xu J.Q., et al. Mesenchymal stem cells reverse EMT process through blocking the activation of NF-κB and Hedgehog pathways in LPS-induced acute lung injury. Cell Death Dis. 2020;11 - PMC - PubMed
    1. Hu C.X., Li L.J. Preconditioning influences mesenchymal stem cell properties in vitro and in vivo. J Cell Mol Med. 2018;22:1428–1442. - PMC - PubMed

LinkOut - more resources