. 2024 Oct 25:15:1422998.
doi: 10.3389/fphar.2024.1422998. eCollection 2024.

Dopamine internalization via Uptake2 and stimulation of intracellular D5-receptor-dependent calcium mobilization and CDP-diacylglycerol signaling

Affiliations

Dopamine internalization via Uptake2 and stimulation of intracellular D5-receptor-dependent calcium mobilization and CDP-diacylglycerol signaling

Wenfei Kang et al. Front Pharmacol. .

Abstract

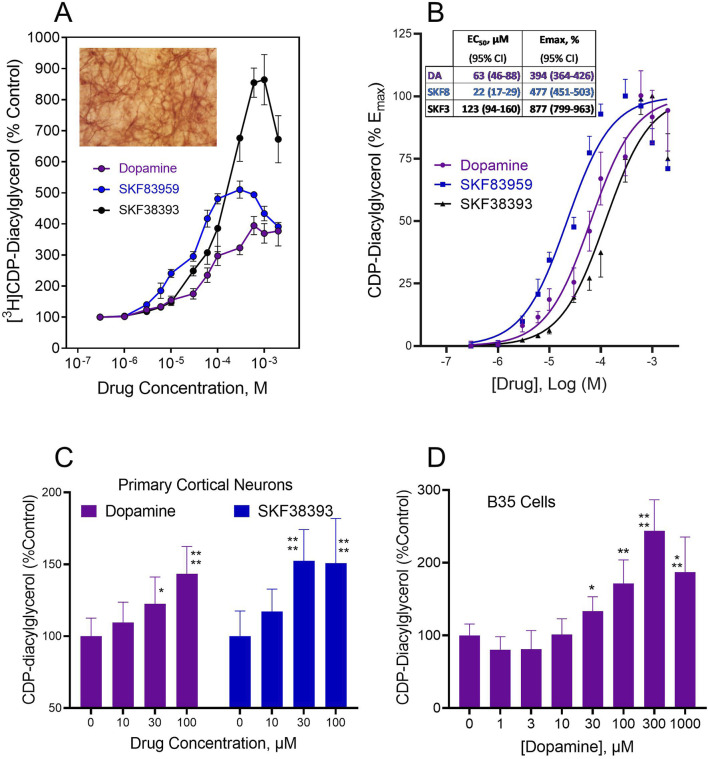
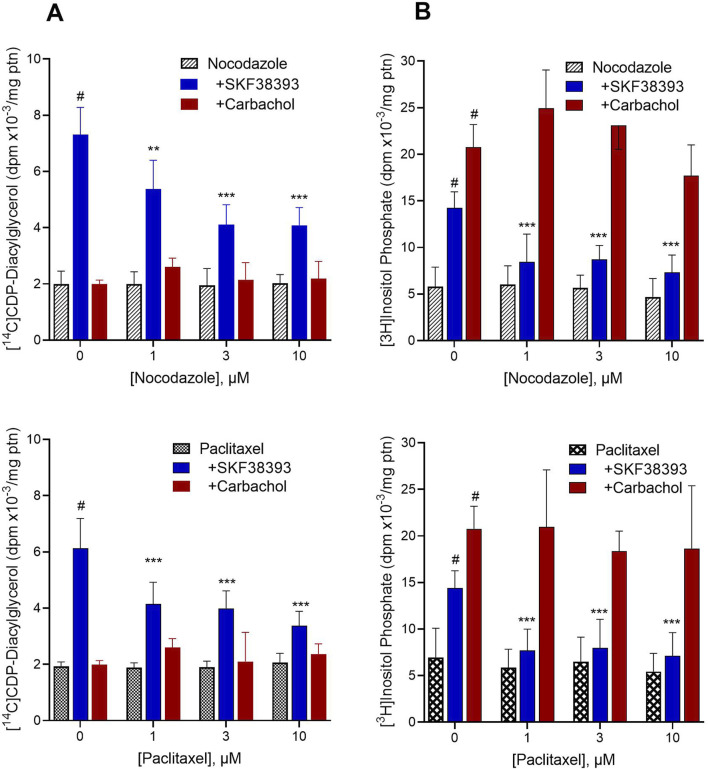
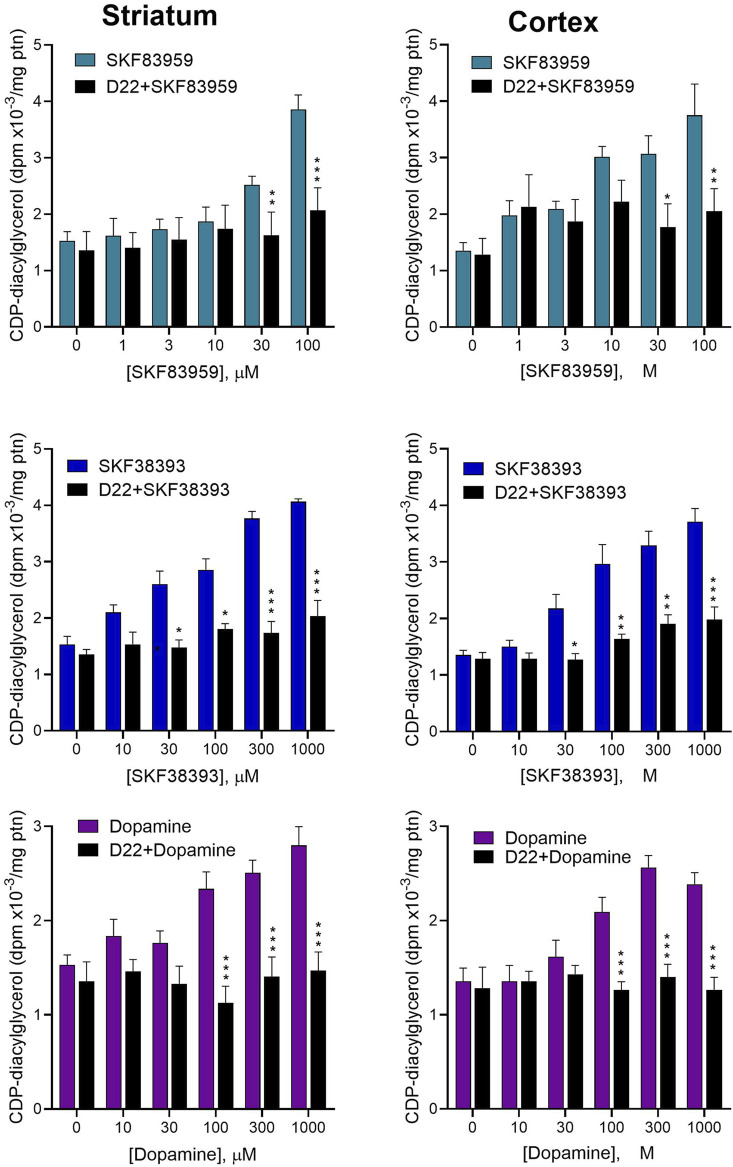
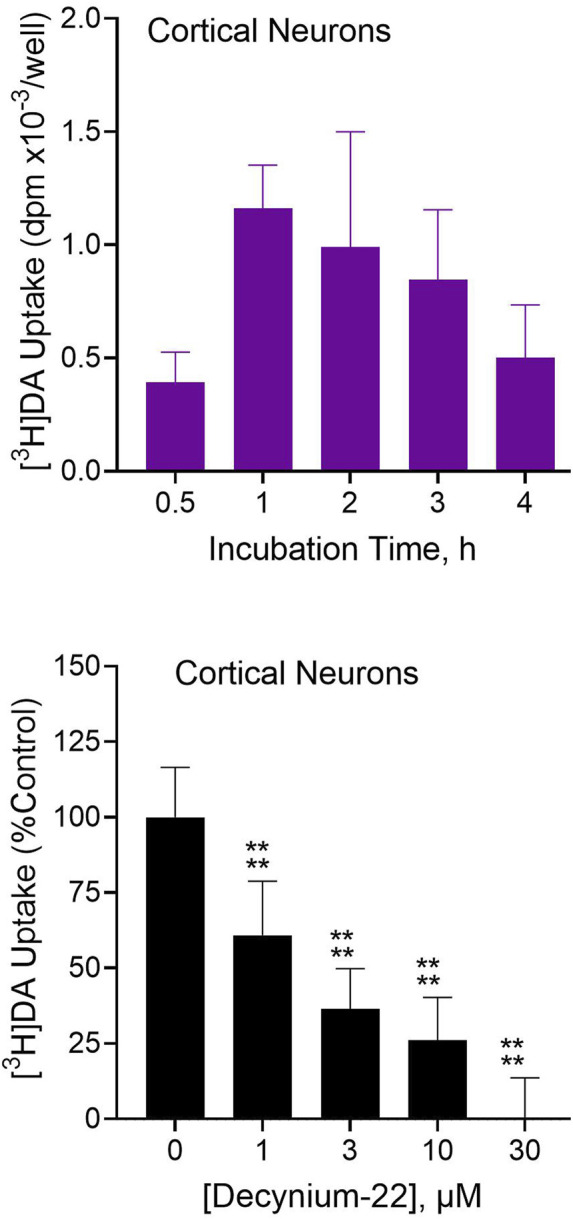
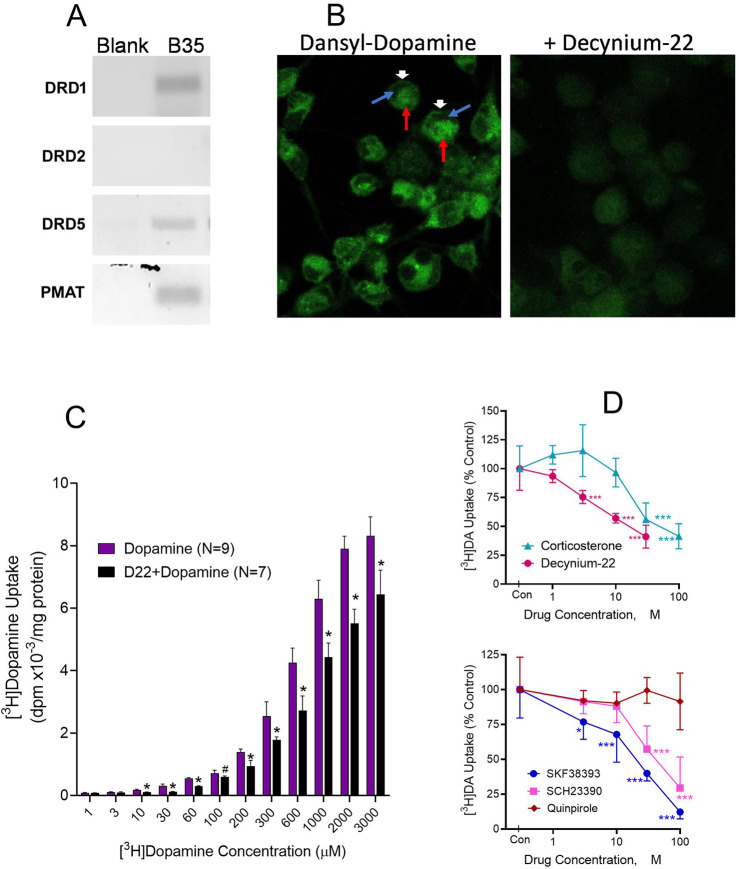
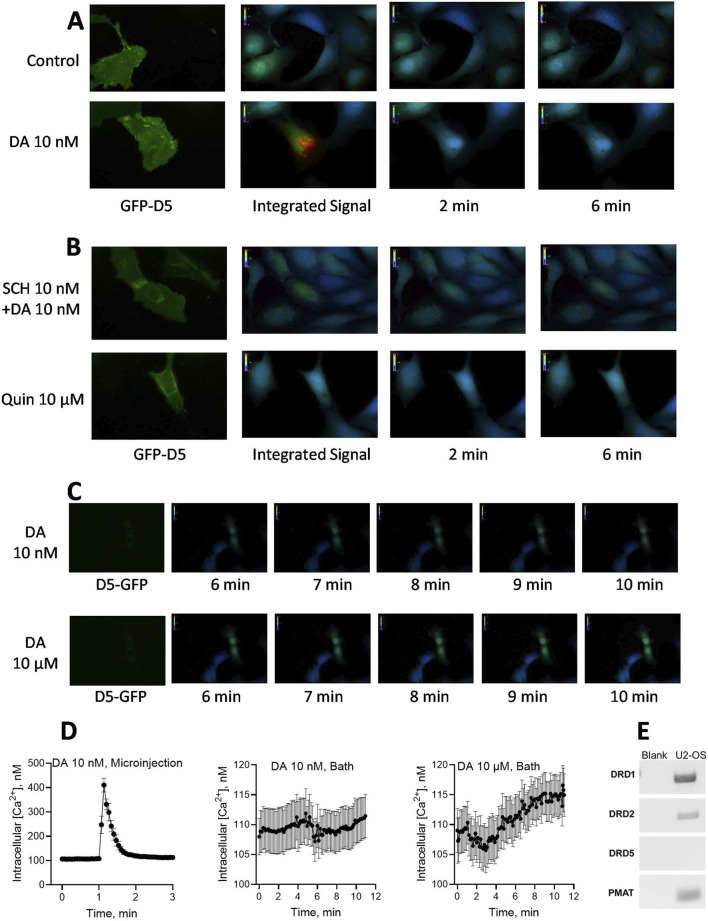
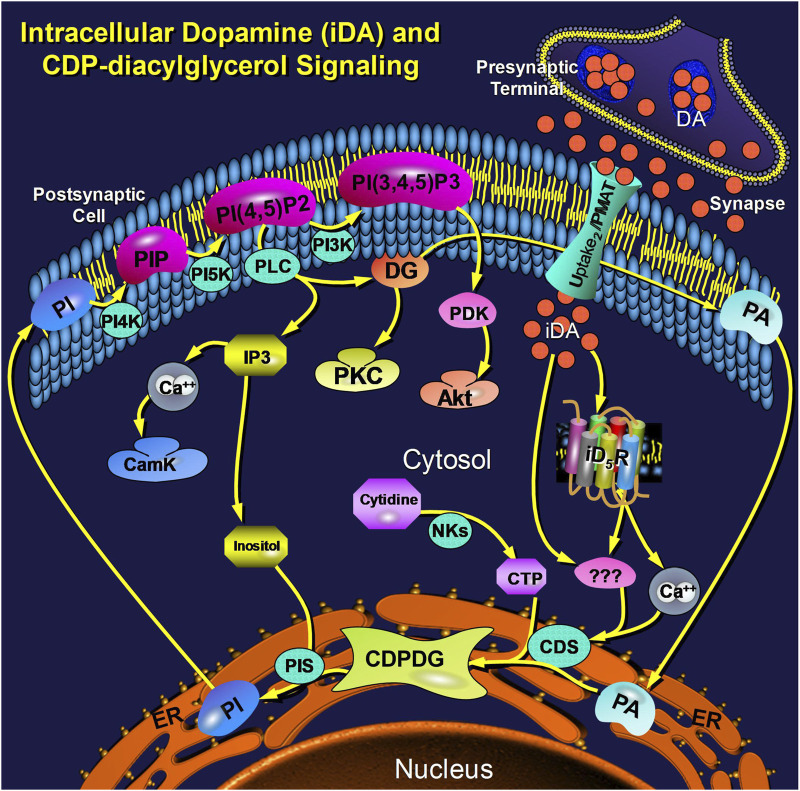
Dopamine stimulates CDP-diacylglycerol biosynthesis through D1-like receptors, particularly the D5 subtype most of which is intracellularly localized. CDP-diacylglycerol regulates phosphatidylinositol-4,5-bisphosphate-dependent signaling cascades by serving as obligatory substrate for phosphatidylinositol biosynthesis. Here, we used acute and organotypic brain tissues and cultured cells to explore the mechanism by which extracellular dopamine acts to modulate intracellular CDP-diacylglycerol. Dopamine stimulated CDP-diacylglycerol in organotypic and neural cells lacking the presynaptic dopamine transporter, and this action was selectively mimicked by D1-like receptor agonists SKF38393 and SKF83959. Dopaminergic CDP-diacylglycerol stimulation was blocked by decynium-22 which blocks Uptake2-like transporters and by anti-microtubule disrupters of cytoskeletal transport, suggesting transmembrane uptake and guided transport of the ligands to intracellular sites of CDP-diacylglycerol regulation. Fluorescent or radiolabeled dopamine was saturably transported into primary neurons or B35 neuroblastoma cells expressing the plasmamembrane monoamine transporter, PMAT. Microinjection of 10-nM final concentration of dopamine into human D5-receptor-transfected U2-OS cells rapidly and transiently increased cytosolic calcium concentrations by 316%, whereas non-D5-receptor-expressing U2-OS cells showed no response. Given that U2-OS cells natively express PMAT, bath application of 10 μM dopamine slowly increased cytosolic calcium in D5-expressing cells. These observations indicate that dopamine is actively transported by a PMAT-implicated Uptake2-like mechanism into postsynaptic-type dopaminoceptive cells where the monoamine stimulates its intracellular D5-type receptors to mobilize cytosolic calcium and promote CDP-diacylglycerol biosynthesis. This is probably the first demonstration of functional intracellular dopamine receptor coupling in neural tissue, thus challenging the conventional paradigm that postsynaptic dopamine uptake serves merely as a mechanism for deactivating spent or excessive synaptic transmitter.

Keywords: CDP-diacylglycerol; D5 dopamine receptor; calcium mobilization; dopamine uptake; nucleolipid; phosphatidylinositol; plasmamembrane monoamine transporter; uptake2.


Conflict of interest statement

The authors declare that the research was conducted in the absence of any commercial or financial relationships that could be construed as a potential conflict of interest. The author(s) declared that they were an editorial board member of Frontiers, at the time of submission. This had no impact on the peer review process and the final decision.

Figures

FIGURE 1
FIGURE 1
Dopamine agonist effects on CDP-diacylglycerol accumulation in cultured brain slices and neural cells that lack presynaptic dopamine terminals or endogenous dopamine. (A). CDP-diacylglycerol accumulation in [3H]cytidine-prelabeled organotypic striatal slices following 90 min incubations with various concentrations of dopamine (N = 8) or the D1-like receptor agonists SKF38393 (N = 8) and SKF83959 (N = 4). [3H]CDP-diacylglycerol responses were converted to percentages relative to Control (608 ± 121 dpm/mg protein, N = 20) to yield the mean ± SD values shown. Each drug concentration-dependently increased [3H]CDP-diacylglycerol in the cultured slice preparations as compared by Two-Way ANOVA, p < 0.001 compared across drug concentrations; p < 0.01 compared among drugs. Insert micrograph illustrates the ordinary appearance of a MAP2-stained 7 day-cultured organotypic striatal slice that has thinned out to reveal networks of neurons within the organotypic matrix. (B). Plot of data as net increase above control percent maximal response for each agent, thus the control response equals 0% and the maximal response equals 100%. A sigmoidal concentration-response function was fitted to the data to yield the fit curves shown. From this, pharmacological indices of potency (EC50) and efficacy (Emax) were determined for each drug using GraphPad Prism. Insert shows the computed geometric mean EC50 and Emax values with 95% confidence intervals (95% CI) summarized for the test drugs. (C). Agonist effects on [3H]CDP-diacylglycerol accumulation in frontal cortical neurons incubated with [3H]cytidine for 60 min. Each bar is mean ± SD for dopamine (N = 9) or SKF38393 (N = 6) as shown. Two-Way ANOVA analysis indicated differences between the effects of dopamine and SKF38393 (p < 0.05) as well as significant concentration-dependent effects of the drugs (p < 0.0001); subsequent posthoc tests for each drug showed significantly different mean effects at the 30–100 µM concentrations of dopamine or SKF38393. *p < 0.05; ****p < 0.0001 compared to respective control (0 µM) responses by Dunnett tests. (D) Effects of dopamine on CDP-diacylglycerol accumulation in B35 neuroblastoma cells incubated with [3H]cytidine and the indicated dopamine concentrations for 60 min. Each bar is the mean ± SD (N = 6). Drug concentrations of 30 µM and higher produced statistically significant increases in nucleolipid formation based on One-Way ANOVA analysis (p < 0.0001). *p < 0.05, **p < 0.01, ***p < 0.001, ****p < 0.0001 compared to the baseline (0 µM dopamine) group by posthoc Dunnett tests.
FIGURE 2
FIGURE 2
Effects of microtubule-disrupting agents (MDA) on drug-induced [14C]CDP-diacylglycerol and [3H]inositol phosphate accumulations. Freshly prepared rat striatal slices were concurrently incubated with [14C]cytidine and [3H]inositol to respectively label newly formed CDP-diacylglycerol and inositol phosphates. The results show the baseline effects of various concentrations of MDA alone, and the responses to 300 µM SKF38393 (N = 9) or 300 µM carbachol (N = 6) in the absence (0 µM) or presence of the MDA, nocodazole (Top, N = 9) and paclitaxel (Bottom, N = 9). Each bar is the mean ± SD of the responses expressed relative to protein (ptn) content of the brain slice aliquots (range 200–250 µg ptn). Data as shown for each graph were analyzed by Two-Way ANOVA of drug by MDA concentration followed by Dunnett tests to compare each agonist to MDA alone or each MDA concentration to its respective control (0 µM MDA). (A). Left panel [14C]CDP-diacylglycerol effects. SKF38393 significantly induced CDP-diacylglycerol accumulation compared to nocodazole alone (p < 0.0001) or paclitaxel alone (p < 0.0001). Carbachol did not produce a statistically significant effect on CDP-diacylglycerol. Comparison of responses at each MDA concentration to the 0 µM MDA concentration (SKF38393 alone) showed significant inhibition of the SKF38393 response at 1–10 µM nocodazole or paclitaxel. **p < 0.01, ***p < 0.001 compared to the SKF38393 response in the absence of respective MDA. (B). [3H]Inositol phosphate accumulation concurrently measured with the [14C]CDP-diacylglycerol assay as in panel (A). SKF38393 and carbachol each significantly increased inositol phosphate accumulation compared to baseline (#p < 0.0001 compared to MDA alone). Comparison of responses at each MDA concentration to the SKF38393 response at 0 µM MDA by Dunnett test showed significant inhibition of the SKF38393 response by nocodazole and by paclitaxel. ***p < 0.001 compared to the SKF38393 response in the absence of respective MDA. Carbachol effects on inositol phosphate accumulation were not significantly altered by nocodazole or paclitaxel.
FIGURE 3
FIGURE 3
Effects of blocking Uptake2 with decynium-22 (D22) on dopamine agonist-induced CDP-diacylglycerol formation in acute brain slices. Freshly prepared brain slices from the rat striatum (Left panel) or frontal cortex (Right panel) were incubated with or without 30 µM D22 and tested for CDP-diacylglycerol accumulation in response to indicated concentrations of SKF83959 (N = 6), SKF38393 (N = 6) or dopamine (N = 9). The 30 µM concentration was selected for use in order to ensure adequate penetration into the 350 µm-thick slices. Data from multiple experimental runs were normalized against control (no drug) values and pooled for statistical analysis and graphical presentation of each treatment pair (drug versus D22+drug) for each brain region. Each bar is the mean ± sem of CDP-diacylglycerol expressed relative to average protein (ptn) content of the slices for the indicated sample sizes. Based on the outcomes of the six respective Two-Way ANOVA tests, D22 significantly reduced the responses to dopamine (p < 0.0001), SKF38393 (p < 0.0001) and SKF83959 (p < 0.0001) on CDP-diacylglycerol accumulation in both the striatum and the cortex; moreover, the main effects of each drug were significantly concentration-dependent (p < 0.001 for each drug in each tissue). Subsequent Bonferroni paired comparisons performed at each drug concentration are shown: *p < 0.05, **p < 0.01, ***p < 0.001 comparing drug + D22 to drug alone.
FIGURE 4
FIGURE 4
[3H]Dopamine ([3H]DA) uptake into rat primary cortical neurons and effects of Uptake2 inhibition. Dissociated rat cortical neurons were cultured in vitro for 7 days and then used for testing. Top: Cultured cortical neurons were incubated with 100 µM [3H]dopamine for indicated times followed by analysis of intracellular tritium uptake. Each bar is the mean ± SD (N = 3). Substantial and time-dependent [3H]DA uptake was observed in the cultured primary cortical neurons. Bottom: Primary cortical neurons were incubated with 100 µM [3H]DA in the presence of indicated concentrations of D22 followed by analysis of [3H]DA uptake. Nonspecific uptake was defined with 30 µM D22. Data from multiple experimental runs was normalized by converting to percentages relative to uptake in the absence of D22 (equated to 100%). Each bar is the mean ± SD (N = 12). Data were analyzed by One-Way ANOVA followed by Dunnett test. ****p < 0.0001 compared to uptake in the absence of D22.
FIGURE 5
FIGURE 5
Intracellular dopamine (DA) uptake and effects of competing ligands and Uptake2 modulation. (A). Rat B35 cortical neuroblastoma cells demonstrably expressing PMAT (in addition to D1 and D5 receptors but not D2 receptor) were used. (B). Fluorescent dansyl-labeled DA uptake in B35 cells incubated for 30 min with 30 µM dansyl-dopamine only (Left) or 30 µM dansyl-dopamine in the presence of 10 µM decynium-22 (Right). Cells were visualized under confocal microscopy. Intracellular green fluorescence indicates dansyl-dopamine entry and retention in the B35 cells. Note the discrete intracellular distribution of the dopamine fluorescence in incubations with dansyl-dopamine, especially in the absence of decynium-22. Arrows show: Dansyldopamine fluorescence in cell membrane (White arrowhead); Cellular subregion of low dansyldopamine fluorescence (Blue arrow); Cellular subregion of high dansyldopamine fluorescence (Red arrow). (C). Cellular [3H]DA uptake in B35 cells incubated with indicated molar concentrations of total (cold + radiolabeled) dopamine in the presence or absence of 10 µM decynium-22 (D22). Nonspecific uptake was defined with 30 µM D22. Each bar is the mean ± SD (N = 7–9). Two-Way ANOVA showed significant effects of dopamine concentration (p < 0.0001) and of D22 pretreatment (p < 0.0001) on [3H]dopamine uptake. *p < 0.001 compared to the paired concentration of dopamine alone. (D). Effects on [3H]DA uptake of Uptake2 inhibitors D22 and corticosterone (Top) and competition by DA ligands (Bottom). Indicated concentrations of each uptake inhibitor compound were tested against 100 µM [3H]DA in B35 cells. Nonspecific uptake was defined with 300 µM SKF38393. Each point is the mean ± sem (N = 6). Two-Way ANOVA was performed for the competing agents followed by Dunnett testing to compare the concentration effect of each agent to its control ([3H]DA alone). *p < 0.05, ***p < 0.001 compared to Control (Con [3H]DA alone) for each drug treatment by Dunnett test.
FIGURE 6
FIGURE 6
Effects of dopamine (DA) microinjection or bath application on intracellular free calcium concentrations [iCa2+] in hDRD5 receptor-expressing cells. (A). Human U2-OS osteosarcoma cells natively expressing DRD1 and PMAT, but not DRD5, were pre-transfected with GFP-fluorescent human DRD5 receptor (green GFP-D5 fluorescence). Dopamine and other treatments were microinjected into the cell Soma followed by continuous 0.25 Hz recording of [iCa2+] signal as indicated by Fura-2AM. fluorescence. Pictograms of [iCa2+] from respective representative cells are shown (at least 12 transfected cells were tested with similar outcomes, and average results from 12 cells are shown in part D below). The control cell tested in parallel (top panel) was microinjected with buffered media alone, while the DA injected cell received 10 nM final intracellular concentration of DA. The [iCa2+] signal integrated over a 6 min observation window as well as point observations at 2 and 6 min, are shown. (B). Effects of co-microinjection of SCH23390 (SCH) 10 nM with dopamine 10 nM (Top panel) or of quinpirole microinjection (up to 10 μM, bottom panel) on [iCa2+] response. SCH23390 blocked the iCa2+ response to dopamine, while the D2 agonist quinpirole (Quin) was without effect. (C). Pictograms from representative experiments testing the effects of bath-applied DA on iCa2+ mobilization in U2-OS cells. Bath application of 10 nM dopamine had no effect (Top panel), while 10 µM dopamine monitored over 11 min revealed a slowly rising wave of [iCa2+] response that was highest toward the latest 11 min time point observed (Bottom panel). (D). Quantified observations and temporal patterns of responses for microinjected versus bath applied dopamine. Continually recorded [iCa2+] data resampled at 0.133 min intervals from 12 experiments are shown for microinjected DA 10 nM (Left graph, peak effect = 416%) in contrast with the effects of bath-applied DA 10 nM (Middle graph) and bath-applied DA 10 µM (Right graph). For bath-applied DA 10 μM, the average of the three observations made in the last 12 s of recording (106.2%, N = 12) was compared to the average of the three observations made in the first 12 s (0.2 min) of recording as the baseline (100%, N = 12); the comparison indicated a statistically significant increase in bath-applied dopamine-stimulated [iCa2+] response (paired t-test, p = 0.019). The experimental system could not support extension of observation period past the 11th minute. (E) Expression indications for various dopamine receptors and PMAT in U2-OS cells. While D1 and D2 receptors as well as PMAT were expressed, there was no indication of D5 receptor expression in the U2-OS cells.
FIGURE 7
FIGURE 7
Schema illustrating an integrated view of cellular dopamine uptake and postsynaptic intracellular signaling via CDP-diacylglycerol. Dopamine (DA) is released from presynaptic nerve terminals into the synaptic cleft and extracellular space where threshold concentrations of the transmitter trigger its active transport via the postsynaptic Uptake2/PMAT transporter into the postsynaptic cell. Postsynaptic intracellular dopamine (iDA) interacts with intracellular D5-type receptors (iD5R), probably anchored to the bilaminar membrane of a subcellular organelle, to elicit a cytosolic calcium response. The elevated calcium, probably in concert with other presently unknown mediators/mechanisms (shown as triple question marks), may then activate CDP-diacylglycerol synthase (CDS) to increase output of CDP-diacylglycerol (CDPDG). While the nature of CDS activation is presently unclear, the steps involving the conversion of CDP-diacylglycerol to PI and the subsequent reactions of the membrane phosphatidylinositides are well established; these components are shown here in context to illustrate their relatedness to the rate-limiting step of CDP-diacylglycerol biosynthesis. Other Abbreviations: PA (phosphatidic acid), NKs (nucleotide kinases), PIS (phosphatidylinositol synthase), PI (phosphatidylinositol), PIP (PI phosphate), PI-4,5-P2 (PI-4,5-bisphosphate), PI-3,4,5-P3 (PI-3,4,5-trisphosphate), PI4K (PI-4-kinase), PI5K (PI-5-kinase), PI3K (PI-3-kinase), IP3 (inositol trisphosphate), CamK (calmodulin kinases), DG (diacylglycerol), PKC (protein kinase C), PDK (PI-3,4,5-P3-dependent kinase), PMAT (plasmamembrane monoamine transporter).

Similar articles

References

    1. Alb J. G., Jr., Kearns M. A., Bankaitis V. A. (1996). Phospholipid metabolism and membrane dynamics. Curr. Opin. Cell Biol. 8 (4), 534–541. 10.1016/s0955-0674(96)80032-9 - DOI - PubMed
    1. Antonsson B. (1997). Phosphatidylinositol synthase from mammalian tissues. Biochim. Biophys. Acta 1348 (1-2), 179–186. 10.1016/s0005-2760(97)00105-7 - DOI - PubMed
    1. Baufreton J., Garret M., Rivera A., de la C. A., Gonon F., Dufy B., et al. (2003). D5 (not D1) dopamine receptors potentiate burst-firing in neurons of the subthalamic nucleus by modulating an L-type calcium conductance. J. Neurosci. 23 (3), 816–825. 10.1523/JNEUROSCI.23-03-00816.2003 - DOI - PMC - PubMed
    1. Brailoiu G. C., Deliu E., Hooper R., Dun N. J., Undieh A. S., Adler M. W., et al. (2012). Agonist-selective effects of opioid receptor ligands on cytosolic calcium concentration in rat striatal neurons. Drug Alcohol Depend. 123 (1-3), 277–281. 10.1016/j.drugalcdep.2011.11.021 - DOI - PMC - PubMed
    1. Brailoiu G. C., Deliu E., Marcu J., Hoffman N. E., Console-Bram L., Zhao P., et al. (2014). Differential activation of intracellular versus plasmalemmal CB2 cannabinoid receptors. Biochemistry 53 (30), 4990–4999. 10.1021/bi500632a - DOI - PMC - PubMed

LinkOut - more resources