. 2024 Oct 24:15:1472813.
doi: 10.3389/fphar.2024.1472813. eCollection 2024.

Didang Tang alleviates neuronal ferroptosis after intracerebral hemorrhage by modulating the PERK/eIF2α/ATF4/CHOP/GPX4 signaling pathway

Affiliations

Didang Tang alleviates neuronal ferroptosis after intracerebral hemorrhage by modulating the PERK/eIF2α/ATF4/CHOP/GPX4 signaling pathway

Jing Lu et al. Front Pharmacol. .

Abstract

Introduction: Ferroptosis is a crucial process contributing to neuronal damage following intracerebral hemorrhage (ICH). Didang Tang (DDT), a traditional therapeutic, has been used clinically to manage ICH for many years, yet the molecular mechanisms by which by DDT protects neurons from ferroptosis after ICH remain elusive.

Methods: This study utilized high-performance liquid chromatography-based fingerprint analysis to characterize DDT's chemical composition. An ICH rat model and hemin and erastin-induced PC12 cell ferroptosis models were developed to investigate DDT's neuroprotective mechanisms. Histological assessments of brain tissue morphology and iron deposition were performed using hematoxylin-eosin, Nissl, and Perl's blue staining. Neurological function was evaluated using Longa and Berderson scores, while lipid peroxidation was measured using biochemical assays and flow cytometry. Protein expression levels of ferroptosis- and endoplasmic reticulum stress (ERS)-related markers were analyzed via Western blotting and immunofluorescence.

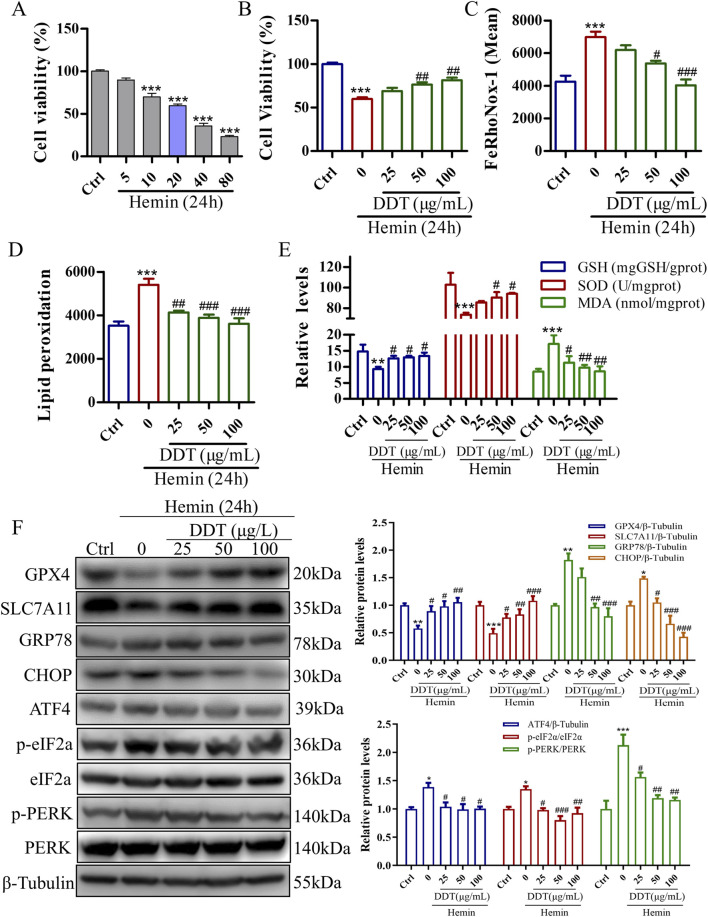
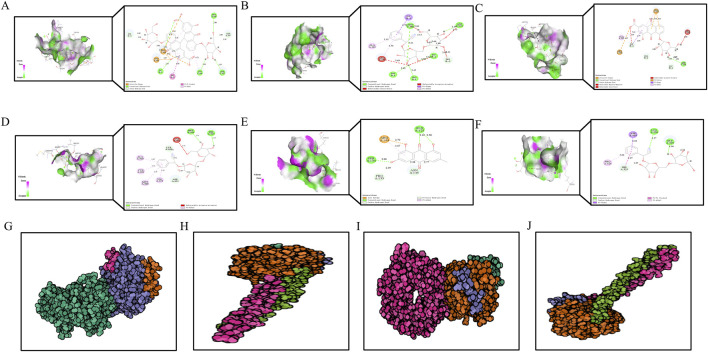
Results: Our results demonstrated that DDT reduced hematoma volume, decreased iron deposition, lowered malondialdehyde (MDA) levels, and upregulated glutathione peroxidase (GPX4) and SLC7A11 expression in affected brain regions. Furthermore, DDT downregulated GRP78 expression and inhibited the PERK/eIF2α/ATF4/CHOP/GPX4 pathway, exerting strong neuroprotective effects. The fluorescence staining results of MAP2/GPX4 and MAP2/CHOP suggested that DDT may regulate neuronal ferroptosis and ERs to exert the protective effect. In vitro experiments using hemin- and erastin-induced neuron-derived PC12 cells as neuronal ferroptosis models developed in our laboratory corroborated these in vivo findings, showing increased survival and reduced lipid peroxidation in DDT-treated cells, along with similar inhibitory effects on ferroptosis and ERS. Molecular docking suggested that DDT components, such as sennoside B, amygdalin, rhein, and emodin, interact favorably with PERK/eIF2α/ATF4/CHOP signaling pathway proteins, highlighting their potential role in DDT's anti-ferroptosis effects.

Conclusion: DDT alleviates neuronal ferroptosis after ICH by modulating the PERK/eIF2α/ATF4/CHOP/GPX4 signaling pathway. Overall, this study provides novel insights into DDT's protective mechanisms against ICH-induced neuronal injury by modulating ferroptosis and ERS pathways, underscoring its potential as an effective therapeutic strategy.

Keywords: Didang Tang; HPLC; endoplasmic reticulum stress; ferroptosis; intracerebral hemorrhage.


Conflict of interest statement

The authors declare that the research was conducted in the absence of any commercial or financial relationships that could be construed as a potential conflict of interest.

Figures

FIGURE 1
FIGURE 1
HPLC analysis of DDT. (A) HPLC fingerprints of 10 batches of DDT. (B) HPLC chromatograms of mixed standards. (C) HPLC chromatographic profile of DDT.
FIGURE 2
FIGURE 2
DDT reduced nerve injury in rats with ICH. (A) Representative images of hemorrhagic lesions in rats from different groups. (B) The quantitative analysis of hematoma volume. (C) Changes in body weight across the groups. (D, E) Longa and Berderson scores of ICH rats with/without DDT treatment at 1, 3 and 7 days post-ICH. (F) Representative images showing HE and Nissl staining of brain sections across the groups. Scale bar = 100 μm ** p < 0.01, *** p < 0.001 compared to the Sham group; # p < 0.05, ## p < 0.01, ### p < 0.001 compared to the ICH model group.
FIGURE 3
FIGURE 3
DDT reduced ferroptosis around hematoma after ICH. (A) Representative images of brain sections stained with Prussian blue from different experimental groups. Scale bar = 100 μm. (B) Quantitative analysis of Prussian blue-positive areas across the different groups. (C, D) MDA and GSH-px levels in brain tissue surrounding hematomas of different groups. (E) Protein levels of GPX4 and SLC7A11 around the hematoma at 7 days post-ICH. (F) Quantifications of GPX4 and SLC7A11 expression levels in rats. (G) Immunofluorescence staining of MAP2/GPX4 expression in brain tissue surrounding hematomas of different groups. Scale bar = 20 μm *** p < 0.001 compared to the Sham group; # p < 0.05, ## p < 0.01, ### p < 0.001 compared to the ICH model group.
FIGURE 4
FIGURE 4
DDT alleviated ERS around hematomas after ICH. (A) Protein levels of GRP78, CHOP, ATF4, p-PERK, PERK, p-eIF2α, and eIF2α, around hematomas of different groups at 7 days post-ICH. (B) Quantitative analysis of protein expression levels in (A). (C) Immunofluorescence staining of MAP2/CHOP in brain tissue surrounding hematomas of different groups. Scale bar = 20 μm * p < 0.05, *** p < 0.001 compared to the Sham group; # p < 0.05, ### p < 0.001 compared to the ICH model group.
FIGURE 5
FIGURE 5
DDT inhibited ferroptosis in PC12 cells induced by exposure to hemin. (A) The effect of hemin induction on cell viability in PC12 cells, evaluated using the CCK8 assay. (B) PC12 cells were treated with 20 μM hemin for 24 h, followed by DDT treatment for an additional 24 h. Cell viability was then assessed using the CCK8 assay. (C) Intracellular Fe2⁺ accumulation in hemin-induced PC12 cells was measured using the FeRhoNox-1 fluorescent probe, and the mean value of Fe2⁺ accumulation is shown. (D) Lipid peroxidation levels were evaluated using a C11 BODIPY probe and analyzed by flow cytometry (FCM). The bar chart shows the mean values of lipid peroxidation levels. (E) GSH-px, SOD, and MDA levels in PC12 cells. (F) Protein levels of GPX4, SLC7A11, GRP78, CHOP, ATF4, p-PERK, PERK, p-eIF2α, eIF2α analyzed by Western blotting. Quantitative analysis is shown on the right. * p < 0.05, ** p < 0.01, *** p < 0.001 compared to the Ctrl group; # p < 0.05, ## p < 0.01, ### p < 0.001 compared to the hemin group.
FIGURE 6
FIGURE 6
Erastin induces ERS and ferroptosis in NGF-differentiated PC12 cells. (A) The effect of erastin-induced cytotoxicity on cell viability in PC12 cells as measured using the CCK8 assay. (B, C) Erastin-induced Fe2+ accumulation in PC12 cells was evaluated using the FeRhoNox-1 fluorescent probe, followed by FCM. Mean values of Fe2+ accumulation were shown. (D) Protein levels of GPX4 and SLC7A11 in PC12 cells treated with varying concentrations of erastin, analyzed using Western blotting. (E) Quantitative analysis of protein expression in (D). (F) GRP78 expression in PC12 cells treated with different concentrations of erastin, analyzed using Western blotting, with relative levels shown below. (G) Immunofluorescence staining of GRP78 and GPX4 in PC12 cells following erastin treatment. * p < 0.05, ** p < 0.005, *** p < 0.001 compared to the Ctrl group.
FIGURE 7
FIGURE 7
DDT inhibited ferroptosis in PC12 cells following erastin exposure. (A) PC12 cells were treated with DDT followed by 30 μM erastin for 24 h, after which cell viability was assessed using the CCK8 assay. (B, C) Cells were stained with FeRhoNox-1 fluorescent probe and analyzed by FCM. The bar chart shows the mean values of intracellular Fe2+ accumulation. (D) Immunofluorescence staining of Fe2+ in PC12 cells. (E) Protein levels of GPX4 and SLC7A11 in PC12 cells treated with erastin and/or varying concentrations of DDT, analyzed by Western blotting. (F) Quantitative analysis of protein levels in (E). *** p < 0.001 compared to the Ctrl group; # p < 0.05, ## p < 0.01, ### p < 0.001 compared to the erastin group.
FIGURE 8
FIGURE 8
DDT inhibited lipid peroxidation in PC12 cells undergoing erastin-induced ferroptosis. (A) Cells were incubated with a C11 BODIPY probe to assess lipid peroxidation using FCM. (B) Bar chart displaying mean values of lipid peroxidation level in PC12 cells. (C) GSH levels, (D) GSH/GSSG ratios, (E) SOD levels. (F) MDA levels in PC12 cells undergoing ferroptosis. *** p < 0.001 compared to the Ctrl group; # p < 0.05, ## p < 0.01, ### p < 0.001 compared to the erastin group.
FIGURE 9
FIGURE 9
DDT Decreased erastin-induced ER Stress Through Blocking PERK Signaling in PC12 Cells. (A) Protein levels of GRP78, CHOP, ATF4, p-eIF2α, eIF2α, p-PERK, and PERK were observed by Western blotting. (B) Quantitative analysis of protein expression in (A). (C) Immunofluorescence staining of GRP78 and CHOP after DDT treatment in PC12 cells. (D) Mean fluorescence intensity values are shown. * p < 0.05, *** p < 0.001 compared to the Ctrl group; # p < 0.05, ## p < 0.01, ### p < 0.001 compared to the erastin group.
FIGURE 10
FIGURE 10
The diagram of molecular docking analysis. The diagram of molecular docking analysis. (A–F) 3D and 2D docking patterns of hub targets and key compounds: (A) Sennoside B-CHOP (Libdock:171.729). (B) Amygdalin-CHOP (Libdock:158.539). (C) Rhein-8-O-β-D-Glucopyranodise-CHOP (Libdock:133.385). (D) Sennoside B-PERK (Libdock:131.101). (E) EIF2A-Emodin (Libdock:126.429). (F) EIF2A-Sennoside B (Libdock:119.174). Lines of different colors represent various interactions. (Orange lines represent attractive charge or salt bridge interactions, Dark pink lines indicate pi-pi stacked interactions, Green lines show conventional hydrogen bonds, Light pink lines represent pi-alkyl interactions, Light green lines correspond to carbon or pi-donor hydrogen bonds, Purple lines signify pi-sigma interactions, Red lines denote unfavorable interactions, such as acceptor-acceptor, donor-donor, or negative-negative interactions.) The higher the Libdock score, the better the binding energy of hub genes and key compounds of herbs. (G–I) 3D docking patterns of hub targets and Hirudin (PDB ID: 16131390) the active protein in leech: (G) Hirudin-PERK (PDB ID: 4X7K, ZDock-Score:1279.557). (H) Hirudin-ATF4 (PDB ID: 8DYS, ZDock-Score:1279.984). (I) Hirudin-EIF2A (PDB ID: 1CI6, ZDock-Score:1286.565) (J) Hirudin-CHOP (PDB ID: 1NMQ, ZDock-Score:1098.362). The higher the ZDock score the better the binding energy of hub genes and Hirudin. Different atoms are identified as different colors, green is carbon, red is oxygen, and blue is nitrogen.

Similar articles

Cited by

References

    1. Butcher K. S., Baird T., Macgregor L., Desmond P., Tress B., Davis S. (2004). Perihematomal edema in primary intracerebral hemorrhage is plasma derived. Stroke 35, 1879–1885. 10.1161/01.STR.0000131807.54742.1a - DOI - PubMed
    1. Chen B., Chen Z., Liu M., Gao X., Cheng Y., Wei Y., et al. (2019). Inhibition of neuronal ferroptosis in the acute phase of intracerebral hemorrhage shows long-term cerebroprotective effects. Brain Res. Bull. 153, 122–132. 10.1016/j.brainresbull.2019.08.013 - DOI - PubMed
    1. Cominacini L., Mozzini C., Garbin U., Pasini A., Stranieri C., Solani E., et al. (2015). Endoplasmic reticulum stress and Nrf2 signaling in cardiovascular diseases. Free Radic. Biol. Med. 88, 233–242. 10.1016/j.freeradbiomed.2015.05.027 - DOI - PubMed
    1. De Oliveira Manoel A. L. (2020). Surgery for spontaneous intracerebral hemorrhage. Crit. Care 24, 45. 10.1186/s13054-020-2749-2 - DOI - PMC - PubMed
    1. Dixon S. J., Lemberg K. M., Lamprecht M. R., Skouta R., Zaitsev E. M., Gleason C. E., et al. (2012). Ferroptosis: an iron-dependent form of nonapoptotic cell death. Cell 149, 1060–1072. 10.1016/j.cell.2012.03.042 - DOI - PMC - PubMed

LinkOut - more resources