. 2025 Jan 6;53(D1):D582-D594.
doi: 10.1093/nar/gkae990.

scProAtlas: an atlas of multiplexed single-cell spatial proteomics imaging in human tissues

Affiliations

scProAtlas: an atlas of multiplexed single-cell spatial proteomics imaging in human tissues

Tiangang Wang et al. Nucleic Acids Res. .

Abstract

Spatial proteomics can visualize and quantify protein expression profiles within tissues at single-cell resolution. Although spatial proteomics can only detect a limited number of proteins compared to spatial transcriptomics, it provides comprehensive spatial information with single-cell resolution. By studying the spatial distribution of cells, we can clearly obtain the spatial context within tissues at multiple scales. Spatial context includes the spatial composition of cell types, the distribution of functional structures, and the spatial communication between functional regions, all of which are crucial for the patterns of cellular distribution. Here, we constructed a comprehensive spatial proteomics functional annotation knowledgebase, scProAtlas (https://relab.xidian.edu.cn/scProAtlas/#/), which is designed to help users comprehensively understand the spatial context within different tissue types at single-cell resolution and across multiple scales. scProAtlas contains multiple modules, including neighborhood analysis, proximity analysis and neighborhood network, to comprehensively construct spatial cell maps of tissues and multi-modal integration, spatial gene identification, cell-cell interaction and spatial pathway analysis to display spatial variable genes. scProAtlas includes data from eight spatial protein imaging techniques across 15 tissues and provides detailed functional annotation information for 17 468 394 cells from 945 region of interests. The aim of scProAtlas is to offer a new insight into the spatial structure of various tissues and provides detailed spatial functional annotation.


Figures

Graphical Abstract
Graphical Abstract
Figure 1.
Figure 1.
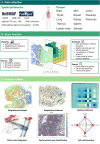
Overview of scProAtlas. (A). Public resources and tissues used in scProAtlas. (B). Basic function of scProAtlas. scProAtlas supports browsing, downloading and searching. (C). Analysis module in scProAtlas.
Figure 2.
Figure 2.
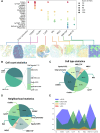
Data statistics in scProAtlas. (A). Region of interest (ROI) statistics display the number of ROIs within each tissue for every technique. Additionally, for each technique, examples of cell type distribution within scProAtlas are provided. (B). Distribution of the proportion of cells used in the analysis is shown across different techniques. (C). Distribution of the proportion of cell type used in the analysis is shown across different techniques. Subtypes of the same cell type are summarized and grouped into a single category for statistical purposes. (D). The proportion of neighborhood types across different techniques. (E). The proportion of spatial pattern genes in each imaging technique is categorized by Moran's I score: less than 0.02, 0.02 to 0.05, 0.05 to 0.1, and greater than 0.1, showing the distribution across different techniques.
Figure 3.
Figure 3.
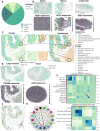
Example from analysis modules of scProAtlas. (A). Frequency of MZB1’s Moran's I score appearing in the top 10 across various tissues. (B). Comparison of MZB1’s spatial distribution and cell types in spleen, thymus and lymph node samples. The top row shows the spatial distribution of plasma cells in spleen, thymus and lymph node, respectively. The bottom row displays the distribution of MZB1 expression in spleen, thymus, and lymph node, with lighter colors indicating higher expression levels of MZB1 in those cells. (C). Example of cell type and neighborhood distribution in the large intestine using CODEX data. (D). First column is the spatial distribution of enterocyte of epithelium in CODEX large intestine data and TSPAN8 expression in the same sample. Second column is the spatial distribution of naïve B cells in CyCIF tonsil data and IGHD expression in the same sample. Lighter colors indicating higher expression levels of genes. (E). Spatial co-localization of CODEX large intestine data. Top heatmap is the co-localization of cell types, bottom is the co-localization of neighborhoods. Darker colors indicating higher co-localization score. (F). Neighborhood network of the same sample in Figure 3C, in the network diagram correspond to the neighborhood labels shown in Figure 3C. (G). Cell–cell interactions in CODEX large intestine Reg001 data.
Figure 4.
Figure 4.
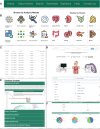
Interface of scProAtlas webpage. (A). Navigation bar of the function in scProAtlas. (B). Browser of analysis module and tissues in the scProAtlas home page. (C). All the datasets in scProAtlas are shown in Data Archieve page. User can access the whole analysis results with the ‘detail’ button. With the filter bars, users can filter the data they wish to browse based on technique, dataset, and tissue. (D). Advanced search of scProAtlas, users can use this feature to input a gene of interest based on their selected technique and tissue, allowing them to query the gene's results in spatial pattern genes, cell–cell interaction, and spatial pathways within the dataset. (E). ‘Help’ page of scProAtlas. (F). Statistics information in scProAtlas.

References

    1. Giesen C., Wang H.A., Schapiro D., Zivanovic N., Jacobs A., Hattendorf B., Schüffler P.J., Grolimund D., Buhmann J.M., Brandt S.et al. .. Highly multiplexed imaging of tumor tissues with subcellular resolution by mass cytometry. Nat. Methods. 2014; 11:417–422. - PubMed
    1. Chang Q., Ornatsky O.I., Siddiqui I., Loboda A., Baranov V.I., Hedley D.W.. Imaging mass cytometry. Cytometry A. 2017; 91:160–169. - PubMed
    1. Liu C.C., Bosse M., Kong A., Kagel A., Kinders R., Hewitt S.M., Varma S., van de Rijn M., Nowak S.H., Bendall S.C.et al. .. Reproducible, high-dimensional imaging in archival human tissue by multiplexed ion beam imaging by time-of-flight (MIBI-TOF). Lab. Invest. 2022; 102:762–770. - PMC - PubMed
    1. Lin J.R., Fallahi-Sichani M., Sorger P.K.. Highly multiplexed imaging of single cells using a high-throughput cyclic immunofluorescence method. Nat. Commun. 2015; 6:8390. - PMC - PubMed
    1. Black S., Phillips D., Hickey J.W., Kennedy-Darling J., Venkataraaman V.G., Samusik N., Goltsev Y., Schürch C.M., Nolan G.P.. CODEX multiplexed tissue imaging with DNA-conjugated antibodies. Nat. Protoc. 2021; 16:3802–3835. - PMC - PubMed

LinkOut - more resources