. 2025 Apr 3;46(2):bgae072.
doi: 10.1093/carcin/bgae072.

Establishing a new-onset diabetes-related metabolism signature for predicting the prognosis and immune landscape in pancreatic cancer

Affiliations

Establishing a new-onset diabetes-related metabolism signature for predicting the prognosis and immune landscape in pancreatic cancer

Yilei Yang et al. Carcinogenesis. .

Abstract

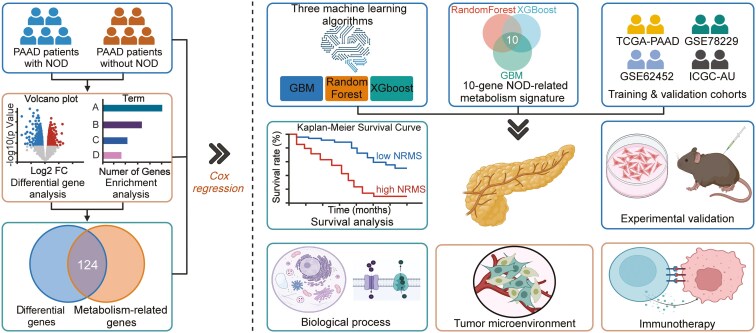
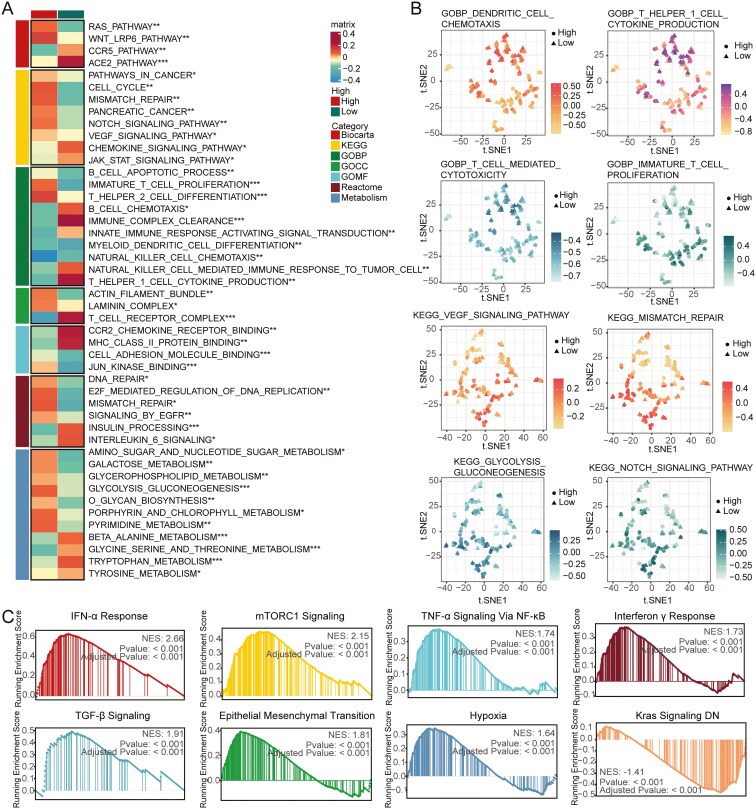
New-onset diabetes (NOD) is a common condition among patients with pancreatic adenocarcinoma (PAAD) and is related to poor clinical outcomes. The potential impact of NOD on PAAD progression and the tumor microenvironment remains unclear. Here, we revealed that NOD in PAAD was associated with metabolic disorders. Utilizing three machine-learning algorithms, an NOD-related metabolism signature (NRMS) was established. Validated in three independent cohorts, patients with a high NRMS score exhibited a worse prognosis. Moreover, an elevated NRMS score was associated with an immunosuppressive microenvironment and diminished response to immunotherapy. Further experiments demonstrated that ALDH3A1, a key feature in NRMS, was significantly upregulated in tissues from PAAD patients with NOD and played a crucial role in tumor progression and immune suppression. Our findings highlight the potential of NRMS as a prognostic biomarker and an indicator of immunotherapy response for patients with PAAD.

Keywords: metabolism; new-onset diabetes; pancreatic adenocarcinoma; tumor microenvironment.


Conflict of interest statement

None declared.

Figures

Graphical Abstract
Graphical Abstract
Figure 1
Figure 1
Construction of NRMS based on machine learning in pancreatic cancer. (A) Volcano plot of DEGs between pancreatic cancer with NOD and pancreatic cancer without NOD. (B) GO enrichment of DEGs. (C) KEGG pathway enrichment of DEGs. (D) GSEA enrichment of DEGs. (E) 124 overlapped genes between DEGs and metabolism-related genes. (F) 30 genes with P < .05 revealed by univariate Cox survival analysis in the 124 NOD-related metabolism genes. (G) Top 10 genes selected by GBM. (H) Top 10 genes selected by RandomForest. (I) Top 10 genes selected by XGboost. (J) Venn diagram illustrates the overlapping prognostic genes discovered through the three distinct machine-learning methodologies
Figure 2
Figure 2
Validation of NRMS in pancreatic cancer. (A) Kaplan–Meier survival analysis of OS for high- and low-risk groups in TCGA-PAAD, GSE78229, GSE62452, and ICGC-AU cohorts. (B) Survival status and risk score for high- and low-risk groups in four cohorts. (C) Time-dependent ROC curves of 1-, 2-, and 3-year OS in four cohorts. (D) The mean survival time within high- and low-risk group, delineated by the median threshold in four cohorts
Figure 3
Figure 3
Clinical value of NRMS score in pancreatic cancer patients. (A) Forest plot of univariate Cox regression analysis of the NRMS score in TCGA-PAAD, GSE78229, GSE62452, and ICGC-AU cohorts. (B) Forest plot of multivariate Cox regression analysis of the NRMS score in four cohorts. (C) The C-index of the NRMS score and various clinical factors in four cohorts. (D) The 1-, 2-, and 3-year calibration curves of the NRMS score in four cohorts. (E) The decision curves of the NRMS score, other clinical factors, and the combination signature in four cohorts. (F) Difference analysis of the distribution of the NRMS score in different histological grade, clinical stage, and N stage in TCGA cohorts
Figure 4
Figure 4
Functional analysis of the NRMS score in the TCGA dataset. (A) Heatmap displaying the correlation between the NRMS score and tumor-associated pathways, immune-related pathways based on GSVA of GO and KEGG terms. (B) t-SNE plot of GO and KEGG terms delineated the differences in pathway activity in two NRMS score groups. (C) GSEA of Hallmark pathways for the NRMS score in the TCGA-PAAD cohort. ***P < .001, **P < .01, *P < .05. t-SNE, t-distributed Stochastic Neighbor Embedding
Figure 5
Figure 5
Immune-related characteristics and immunotherapy response prediction Analysis. (A) Difference of immune infiltration between the low- and high-risk groups. The results were shown in the form of a complex heatmap, in which the abundance of immune cell infiltration measured by ssGSEA, MCPcounter, EPIC, and cibersort between the two groups was presented in the form of a heatmap. The immune score, stromal score, ESTIMATE score, and tumor purity predicted by ESTIMATE were displayed in the form of a bar chart. (B) Kaplan–Meier survival analysis of the NRMS score regarding OS in the IMvigor210 cohort. (C) Difference analysis of the NRMS score in different immunotherapy responses in the IMvigor210 cohort. (D) Kaplan–Meier survival analysis of the NRMS score regarding OS in the GSE78220 cohort. (E) Difference analysis of the NRMS score in different immunotherapy responses in the GSE78220 cohort; Box plot displaying the (F) CYT, (G) Davoli IS by “easier” package; Box plot displaying (H) IFNG, (I) Merck18, (J) CD8, and (K) MDSC by “TIDE” package. ***P < .001, **P < .01, *P < .05
Figure 6
Figure 6
Single-cell analysis and basic experiments in vitro and vivo. (A) tSNE visualization of single cells according to the expression of cell-type-specific gene markers. (B) Bubble chart shows the expression of genes among NRMS in different cell types in pancreatic cancer. (C) qRT-PCR validation of six genes obtained from single-cell analysis between pancreatic cancer tissue with NOD and those without NOD. (D) ALDH3A1 mRNA levels in PANC1 cells transfected with OE_ALDH3A1 or SH_ALDH3A1 compared with OE_control or SH_control group. (E) CCK-8 assay. (F) Colony formation assay. (G) wound-healing assay. (H) Transwell assay of PANC1 cells transfected with OE_ALDH3A1 or SH_ALDH3A1#2. (I) Xenograft tumor growth curve. (J) Photographs of tumors after the injection of Panc02 cells transfected with OE-Aldh3a1 and SH-Aldh3a1#2. (K) Masson’s trichrome staining of xenograft tumor (scale bars, 500 µm). (L) Analysis of CD8+ T cells and MDSCs by flow cytometry in xenograft tumor. The proportion of CD8+ T cells and MDSCs was calculated by the formula: % of CD8+ T cells/MDSCs = (the number of CD8+ T cells/MDSCs)/(the number of CD45+ cells). ****P < .0001, ***P < .001, **P < .01, *P < .05

References

    1. Siegel, R.L. et al. (2018) Cancer statistics, 2018. CA Cancer J. Clin., 68, 7–30. doi: https://doi.org/10.3322/caac.21442 - DOI - PubMed
    1. Khadka, R. et al. (2018) Risk factor, early diagnosis and overall survival on outcome of association between pancreatic cancer and diabetes mellitus: changes and advances, a review. Int. J. Surg., 52, 342–346. doi: https://doi.org/10.1016/j.ijsu.2018.02.058 - DOI - PubMed
    1. Kanbour, S. et al. (2023) Association of long-term, new-onset, and postsurgical diabetes with survival in patients with resectable pancreatic cancer: a retrospective cohort study. Pancreas, 52, e309–e314. doi: https://doi.org/10.1097/MPA.0000000000002257 - DOI - PMC - PubMed
    1. Amri, F. et al. (2023) Association between pancreatic cancer and diabetes: insights from a retrospective cohort study. BMC Cancer, 23, 856. doi: https://doi.org/10.1186/s12885-023-11344-w - DOI - PMC - PubMed
    1. Binang, H.B. et al. (2023) Role of pancreatic tumour-derived exosomes and their cargo in pancreatic cancer-related diabetes. Int. J. Mol. Sci., 24, 10203. doi: https://doi.org/10.3390/ijms241210203 - DOI - PMC - PubMed

MeSH terms

Substances