. 2024 Dec;13(1):2423723.
doi: 10.1080/21623945.2024.2423723. Epub 2024 Nov 11.

Identification of hub genes in the crosstalk between type 2 diabetic nephropathy and obesity according to bioinformatics analysis

Affiliations

Identification of hub genes in the crosstalk between type 2 diabetic nephropathy and obesity according to bioinformatics analysis

Shaomin Shi et al. Adipocyte. 2024 Dec.

Abstract

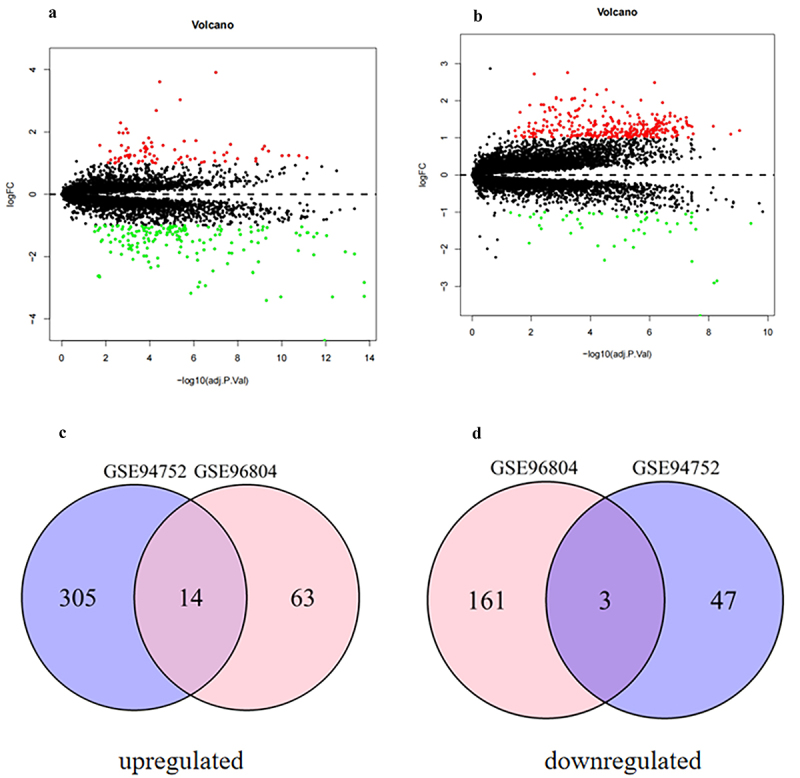
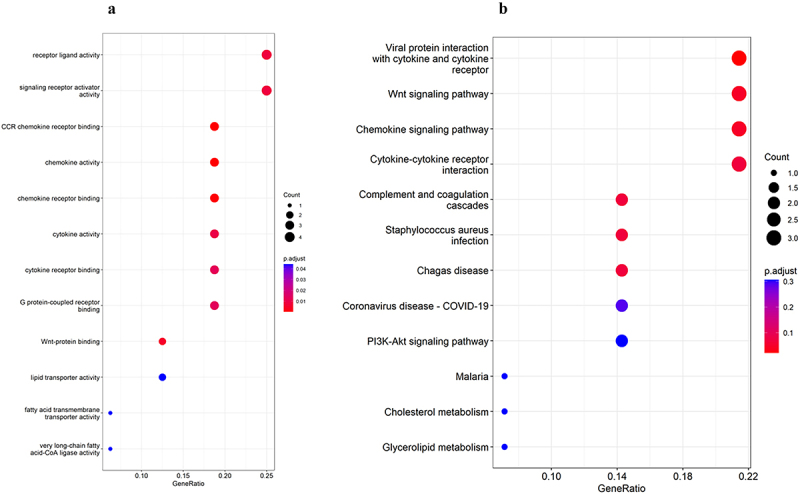
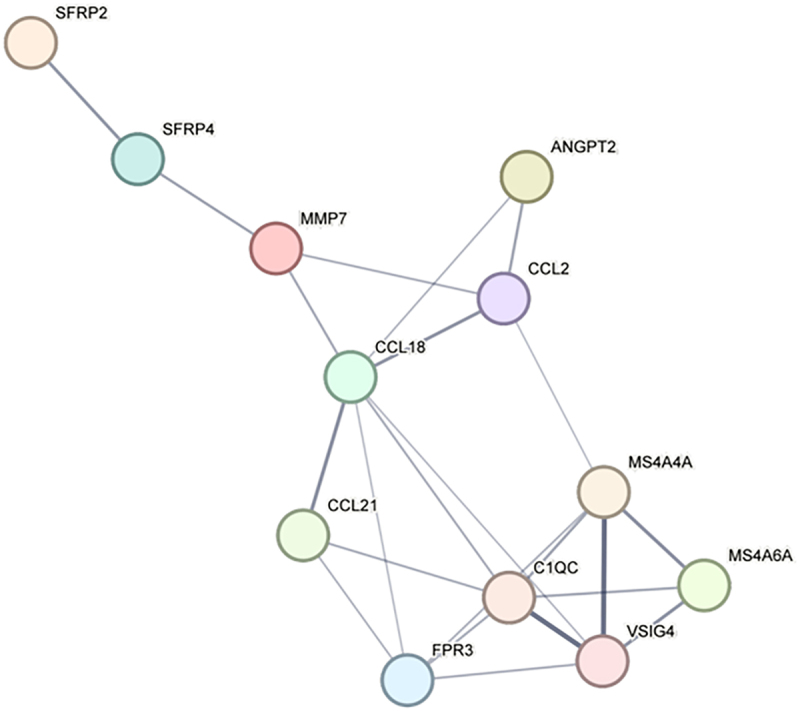
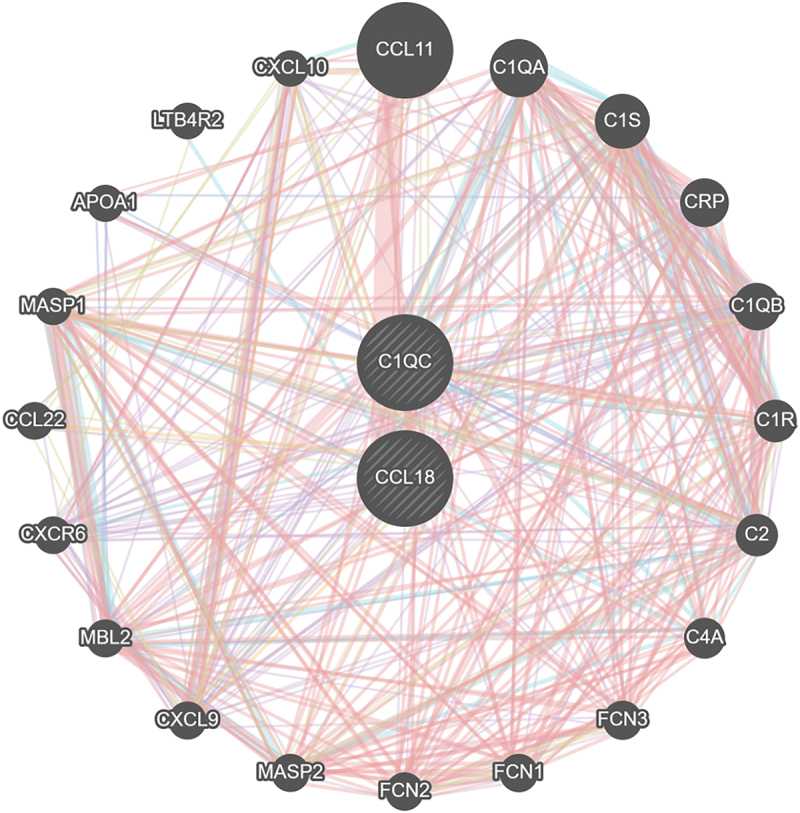
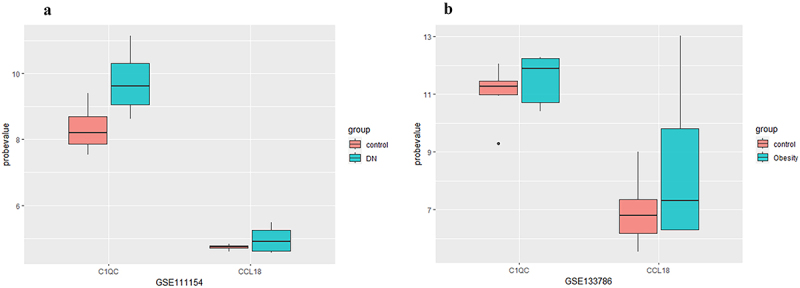
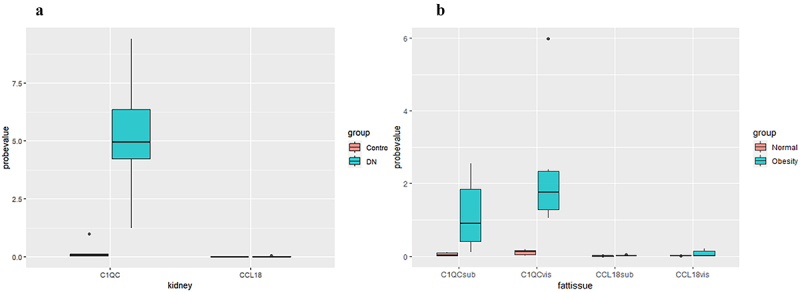
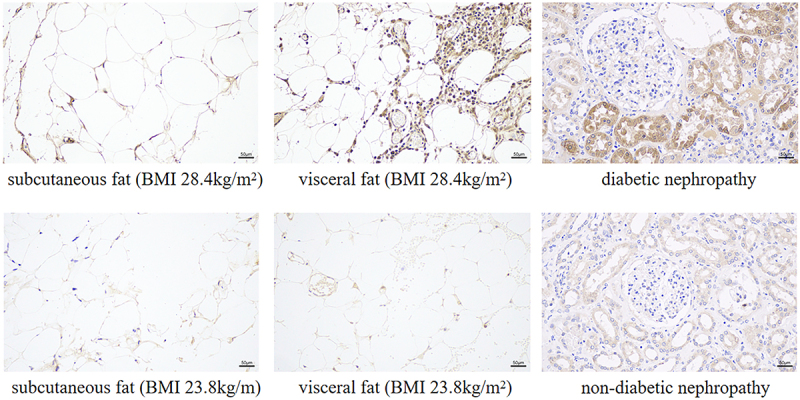
Diabetic nephropathy (DN) and obesity bring a huge burden to society. Obesity plays a crucial role in the progression of type 2 DN, but the pathophysiology remains unclear. Thus, we aimed the explore the association between type 2 DN and obesity using bioinformatics method. The gene expression profiles of type 2 DN (GSE96804) and obesity (GSE94752) were downloaded from the Gene Expression Omnibus (GEO) database. The differentially expressed genes (DEGs) were screened with the thresholds defined as |log2FC| ≥1 and P<0.05. Gene Ontology (GO) and Kyoto Encyclopedia of Genes and Genomes (KEGG) enrichment analyses were performed. Subsequently, a protein-protein interaction network was constructed based on the STRING database. Hub genes were identified, and the co-expression network was constructed. Finally, the hub genes were verified in clinical samples of 24 patients by immunohistochemistry. A total of 17 common DEGs were identified. Finally, two overlapping hub genes were identified (CCL18, C1QC). C1QC has been verified in clinical specimens. Using bioinformatics methods, the present study analyzed the common DEGs and the potential pathogenic mechanisms involved in type 2 DN and obesity. C1QC was the hub gene. Further studies are needed to clarify the specific relationships among C1QC, type 2 DN and obesity.

Keywords: Diabetic nephropathy; bioinformatics; differentially expressed genes; hub genes; obesity.


Conflict of interest statement

No potential conflict of interest was reported by the author(s).

Figures

241 DEGs (77 upregulated genes and 164 downregulated genes) were identified in the type 2 DN dataset (GSE96804), and 369 DEGs (319 upregulated genes and 50 downregulated genes) were identified in the obesity dataset (GSE94752). A total of 17 overlapping DEGs (14 upregulated genes and 3 downregulated genes) were obtained via Venn diagram analysis .
Figure 1.
Volcano diagram and Venn diagram. (a) The volcano map of GSE96804 (DEGs in the kidneys of type 2 DN patients compared with healthy controls). (b) The volcano map of GSE94752 (DEGs in the adipose tissues of obesity patients compared with lean controls). The volcano plot shows upregulated genes (red points) and downregulated genes (green points) and genes without significance (black points). The differences threshold was set as |log2FC| >1.0 and adjusted p value <0.05. X-axis: Log2 fold change in gene expression. Y-axis: negative log10 p-value (or adjusted p-value). (c) The overlapping up-regulated DEGs. (d) The overlapping down-regulated DEGs. Abbreviations: DEGs indicates deferentially expressed genes.
GO enrichment analysis showed that the common DEGs were mainly related to receptor ligand activity, signalling receptor activator activity, CCR chemokine receptor binding, chemokine activity, chemokine receptor binding, cytokine activity, cytokine receptor binding, G protein-coupled receptor binding, Wnt-protein binding, lipid transporter activity, fatty acid transmembrane transporter activity and very long-chain fatty acid-CoA ligase activity . In KEGG pathway enrichment analysis, the common DEGs were mainly enriched in 3 pathways: viral protein interaction with cytokine and cytokine receptor, Wnt signalling pathway, and Chemokine signalling pathway.
Figure 2.
Functional enrichment of common DEGs: (a) GO enrichment analysis; (b) KEGG enrichment analysis. Abbreviations: GO indicates gene Ontology; KEGG, the Kyoto Encyclopedia of Genes and Genes; DEGs, differentially expressed genes.
The PPI network of the common DEGs included a total of 12 nodes and 23 interaction pairs.
Figure 3.
PPI network of common differentially expressed genes in type 2 DN and Obesity (constructed using STRING version 11.5). Interactions shown have a combined confidence score of ≥0.4. Nodes represent individual genes or proteins, and edges represent predicted functional associations between proteins, including direct (physical) and indirect (functional) interactions. Nodes are colored based on gene expression: red for upregulated, blue for downregulated. Edge thickness corresponds to the confidence level of the predicted interaction. Abbreviations: PPI indicates protein-protein interaction network; DEGs, differentially expressed genes.
The hub genes and the differentially expressed genes showed the complex protein-protein interaction network with the co-expression of 8.01%, physical interactions of 77.64%, colocalization of 3.63%, predicted of 5.37% and shared protein domains of 0.6%.
Figure 4.
The co-expression network and functions of these hub genes.
Both hub genes were upregulated in type 2 DN (GSE111154) and obesity (GSE133786) patients compared with the expression levels in healthy controls, but the difference was not statistically significant.
Figure 5.
The expression of hub genes in the GSE111154 and GSE133786 datasets. Abbreviations: DN indicates diabetic nephropathy.
Compared with that in nondiabetic nephropathy patients, the expression level of C1QC was upregulated in type 2 diabetic nephropathy patients (p < 0.05). Compared with that in normal controls, the expression levels of C1QC in abdominal subcutaneous fat and visceral fat were upregulated in obese patients (p < 0.05). CCL18 expression levels in the kidneys of type 2 diabetic nephropathy patients and in the abdominal subcutaneous fat and visceral fat of obese patients were not significantly different from those in the control groups (p > 0.05).
Figure 6.
The expression of hub genes in the adipose tissues of obese patients and the kidney tissues of diabetic nephropathy patients. Abbreviations: DN, diabetic nephropathy; C1QCsub, C1QC expression in abdominal subcutaneous fat; C1QCvis, C1QC expression in visceral fat; CCL18sub, CCL18 expression in abdominal subcutaneous fat; CCL18vis, CCL18 expression in visceral fat.
Immunohistochemical images showed that the expression levels of C1QC in the kidneys of type 2 diabetic nephropathy patients and in the abdominal subcutaneous fat tissues and the visceral fat tissues of obese patients were increased compared with controls (P < 0.05).
Figure 7.
Expression of C1QC in adipose tissue and kidney tissue (immunohistochemistry, 200× field, haematoxylin staining). Abbreviations: BMI indicates body mass index.

Similar articles

Cited by

References

    1. Jawa A, Kcomt J, Fonseca VA.. Diabetic nephropathy and retinopathy. Med Clin North Am. 2004;88(4):1001–1036, xi. doi: 10.1016/j.mcna.2004.04.012 - DOI - PubMed
    1. Valencia WM, Florez H. How to prevent the microvascular complications of type 2 diabetes beyond glucose control. BMJ (Clinical Research Ed). 2017;356:i6505. doi: 10.1136/bmj.i6505 - DOI - PubMed
    1. Xie Z, Xiao X. Novel biomarkers and therapeutic approaches for diabetic retinopathy and nephropathy: recent progress and future perspectives. Front Endocrinol (Lausanne). 2022;13:1065856. doi: 10.3389/fendo.2022.1065856 - DOI - PMC - PubMed
    1. Thomas MC, Brownlee M, Susztak K, et al. Diabetic kidney disease. Nat Rev Dis Primers. 2015;1(1):15018. doi: 10.1038/nrdp.2015.18 - DOI - PMC - PubMed
    1. Bonner R, Albajrami O, Hudspeth J, et al. Diabetic kidney disease. Prim Care. 2020;47(4):645–11. doi: 10.1016/j.pop.2020.08.004 - DOI - PubMed