. 2024 Nov 11:13:RP98169.
doi: 10.7554/eLife.98169.

Derivation and internal validation of prediction models for pulmonary hypertension risk assessment in a cohort inhabiting Tibet, China

Affiliations

Derivation and internal validation of prediction models for pulmonary hypertension risk assessment in a cohort inhabiting Tibet, China

Junhui Tang et al. Elife. .

Abstract

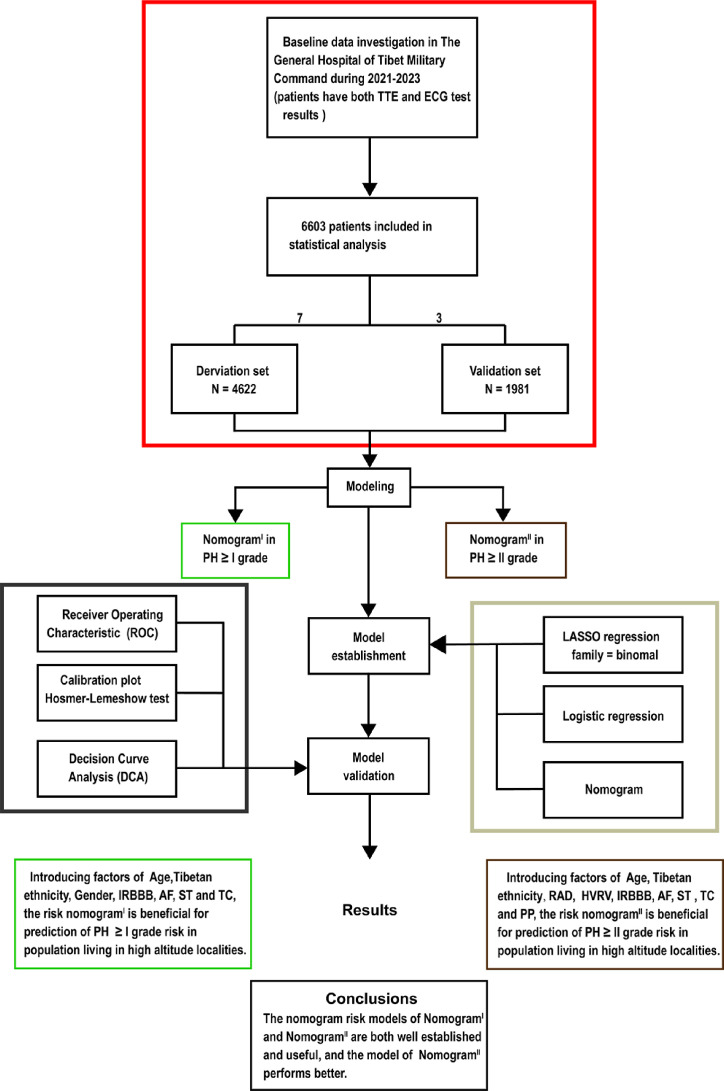
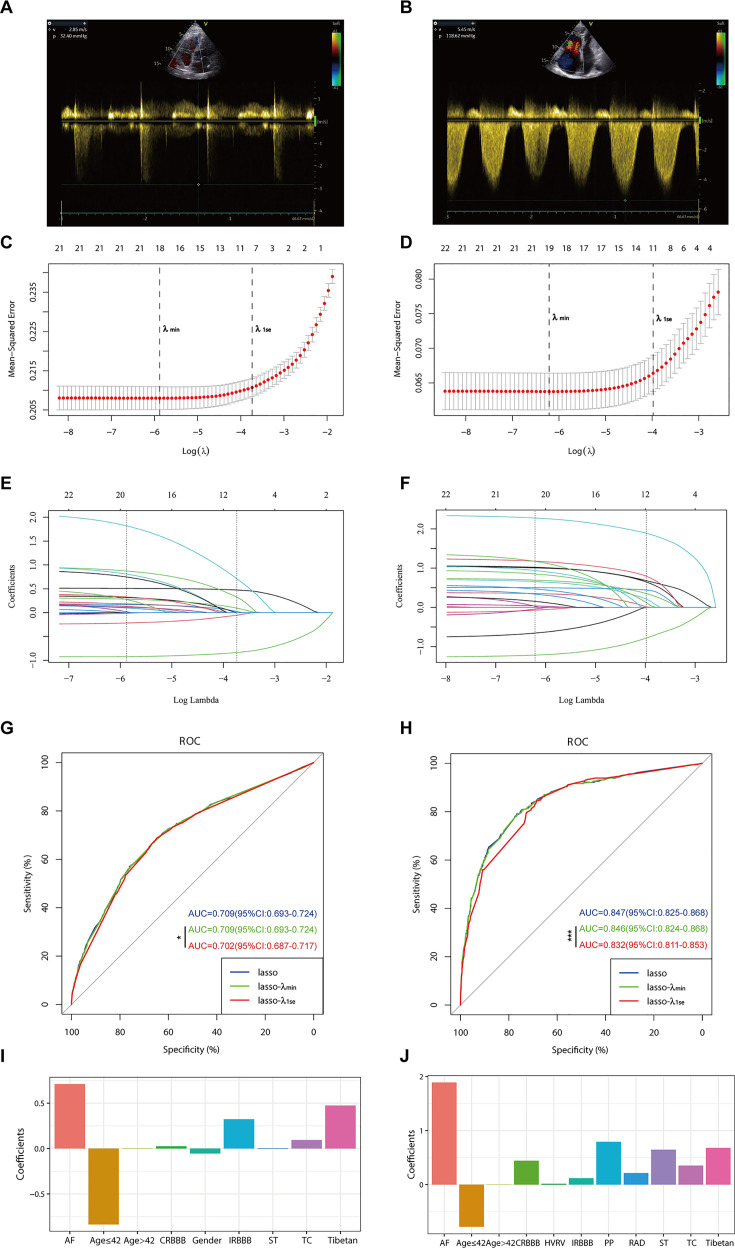
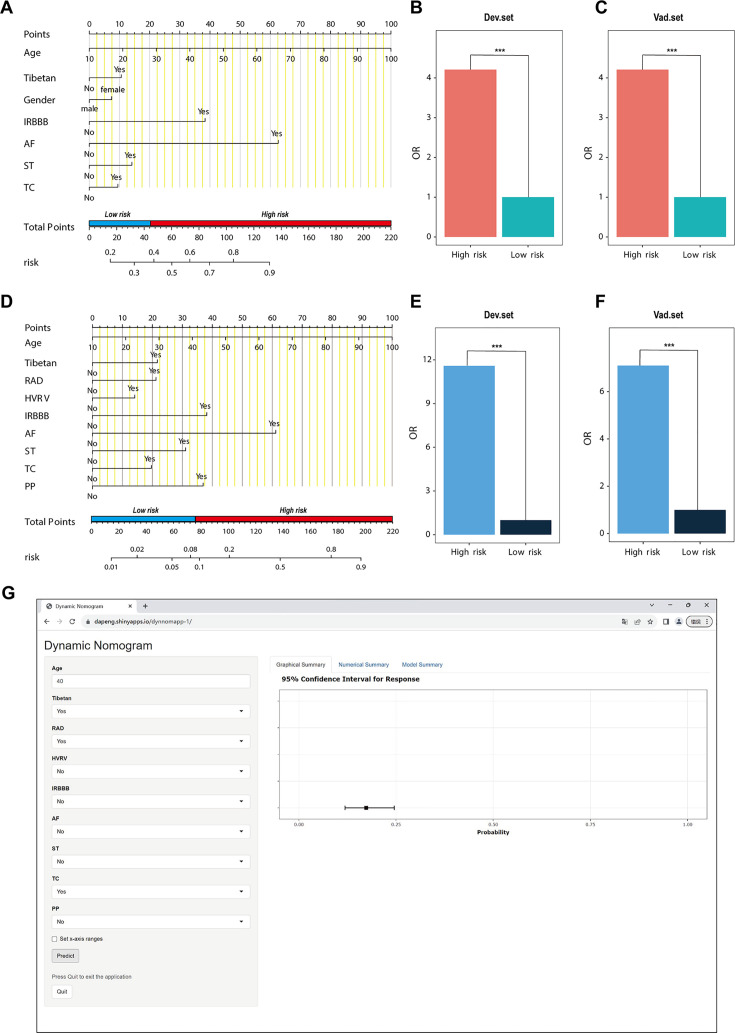
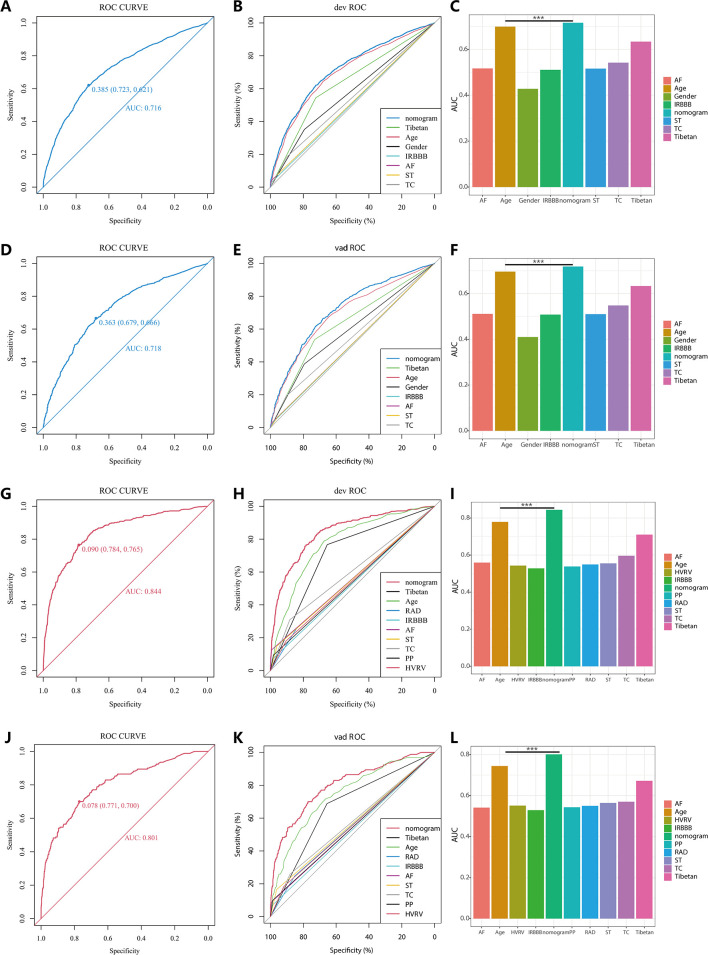
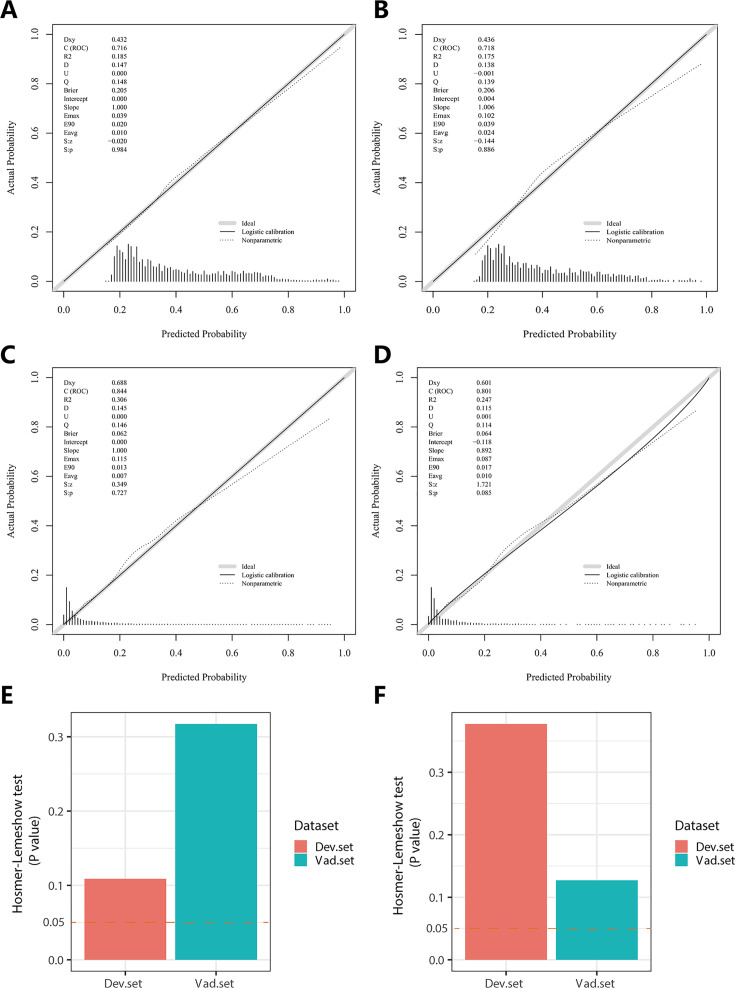
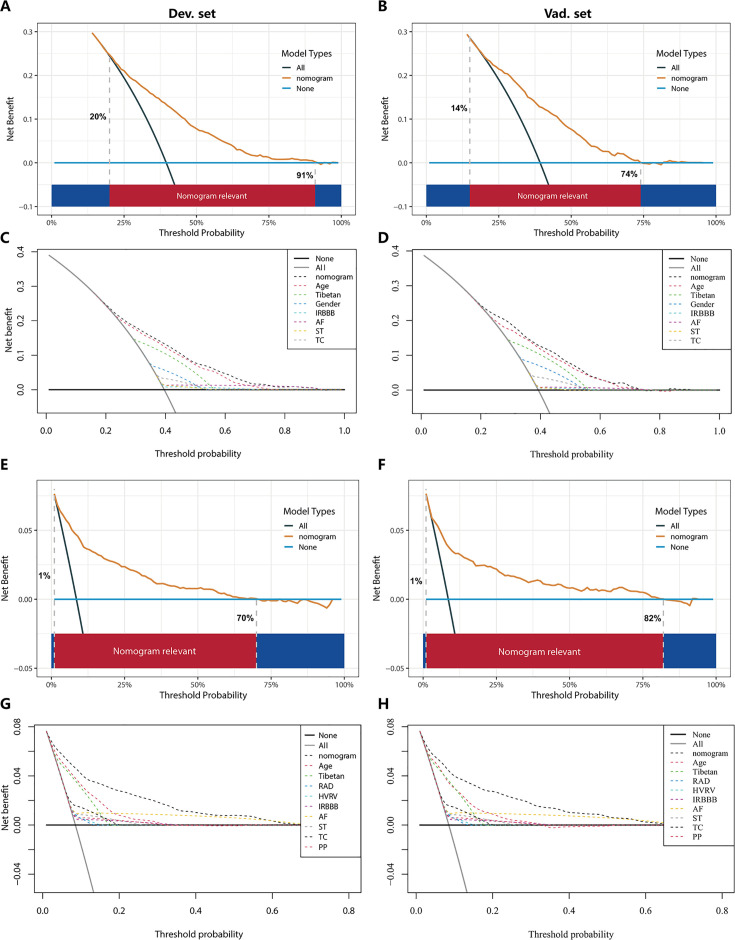
Individuals residing in plateau regions are susceptible to pulmonary hypertension (PH) and there is an urgent need for a prediction nomogram to assess the risk of PH in this population. A total of 6603 subjects were randomly divided into a derivation set and a validation set at a ratio of 7:3. Optimal predictive features were identified through the least absolute shrinkage and selection operator regression technique, and nomograms were constructed using multivariate logistic regression. The performance of these nomograms was evaluated and validated using the area under the curve (AUC), calibration curves, the Hosmer-Lemeshow test, and decision curve analysis. Comparisons between nomograms were conducted using the net reclassification improvement (NRI) and integrated discrimination improvement (IDI) indices. NomogramI was established based on independent risk factors, including gender, Tibetan ethnicity, age, incomplete right bundle branch block (IRBBB), atrial fibrillation (AF), sinus tachycardia (ST), and T wave changes (TC). The AUCs for NomogramI were 0.716 in the derivation set and 0.718 in the validation set. NomogramII was established based on independent risk factors, including Tibetan ethnicity, age, right axis deviation, high voltage in the right ventricle, IRBBB, AF, pulmonary P waves, ST, and TC. The AUCs for NomogramII were 0.844 in the derivation set and 0.801 in the validation set. Both nomograms demonstrated satisfactory clinical consistency. The IDI and NRI indices confirmed that NomogramII outperformed NomogramI. Therefore, the online dynamic NomogramII was established to predict the risks of PH in the plateau population.

Keywords: computational biology; electrocardiogram; high altitude; human; nomogram; prediction model; pulmonary hypertension; systems biology; transthoracic echocardiography.


Conflict of interest statement

JT, RY, HL, XW, ZY, WC, YJ, GZ, LM, YX No competing interests declared

Figures

Figure 1.
Figure 1.. Flow diagram.
Based on the exclusion and inclusion criteria, 6603 patients were included in this study. Patients were divided into a validation set and a derivation set randomly following a 7:3 ratio. Pulmonary hypertension, PH; right axis deviation, RAD; high voltage in the right ventricle, HVRV; incomplete right bundle branch block, IRBBB; atrial fibrillation, AF; sinus tachycardia, ST; T wave changes, TC; pulmonary P waves, PP.
Figure 2.
Figure 2.. Illustrates the optimal predictive variables as determined by the least absolute shrinkage and selection operator (LASSO) binary logistic regression model.
Panels A and B depict the measurement of tricuspid regurgitation spectra via transthoracic echocardiography in patients with Grade I pulmonary hypertension (PH) (A) and Grade III PH (B). Panels C to J demonstrate the identification of the optimal penalisation coefficient lambda (λ) in the LASSO model using 10-fold cross-validation for the PH ≥ I grade group (C) and the PH ≥ II grade group (D). The dotted line on the left (λ_min) represents the value of the harmonic parameter log(λ) at which the model’s error is minimised, and the dotted line on the right (λ_1se) indicates the value of the harmonic parameter log(λ) at which the model’s error is minimal minus 1 standard deviation. The LASSO coefficient profiles of 22 predictive factors for the PH ≥ I grade group (E) and the PH ≥ II grade group (F) show that as the value of λ decreased, the degree of model compression increased, enhancing the model’s ability to select significant variables. Receiver operating characteristic (ROC) curves were constructed for three models (LASSO, LASSO-λ_min, and LASSO-λ_1se) in both the PH ≥ I grade group (G) and the PH ≥ II grade group (H). Histograms depict the final variables selected according to λ_1se and their coefficients for the PH ≥ I grade group (I) and the PH ≥ II grade group (J). Asterisks denote levels of statistical significance: *p < 0.05, **p < 0.01, ***p < 0.001.
Figure 3.
Figure 3.. Nomogram for predicting pulmonary hypertension (PH) and risk stratification based on total score.
(A–C) NomogramI for the prediction of PH ≥ I grade in the PH ≥ I grade group. Points for each independent factor are summed to calculate total points, determining the corresponding ‘risk’ level. Patients were divided into ‘High-risk’ and ‘Low-risk’ subgroups according to the cut-off of the total points (A). Histograms illustrate the odds ratio (OR) comparing the ‘High-risk’ group to the ‘Low-risk’ group in the derivation set (B) and validation set (C). (D–F) NomogramII for predicting PH ≥ II grade within the PH ≥ II grade group: Similarly, points from each independent factor are totalled, and the corresponding ‘risk’ level is ascertained. Patients are divided into ‘High-risk’ and ‘Low-risk’ groups based on the cut-off value of the total points (D). Histograms display the OR for the ‘High-risk’ group compared to the ‘Low-risk’ group in the derivation (E) and validation set (F). ***p < 0.001. (G) Screenshot of dynamic NomogramII’s web page.
Figure 4.
Figure 4.. Receiver operating characteristic (ROC) curves and area under the curve (AUC) for NomogramI in pulmonary hypertension (PH) ≥ I and NomogramII in PH ≥ II grade groups.
In the PH ≥ I grade group, the ROC and corresponding AUC of NomogramI and independent factors in the derivation set (A–C) and validation set (D–F). In the PH ≥ II grade group, the ROC and corresponding AUC of NomogramII and independent factors in the derivation set (G–I) and validation set (J–L).
Figure 5.
Figure 5.. Calibration plots and Hosmer–Lemeshow test results for NomogramI in pulmonary hypertension (PH) ≥ I and NomogramII in PH ≥ II grade groups.
In the PH ≥ I grade group, the calibration plots of NomogramI in the derivation set (A) and the validation set (B). In the PH ≥ II grade group, the calibration plots of NomogramII in the derivation set (C) and the validation set (D). (E) In the PH ≥ I grade group, Hosmer–Lemeshow test results for NomogramI in the derivation set and the validation set. (F) In the PH ≥ II grade group, Hosmer–Lemeshow test results for NomogramII in the derivation set and the validation set.
Figure 6.
Figure 6.. Decision curve analysis (DCA) for NomogramI in the pulmonary hypertension (PH) ≥ I grade and NomogramII in the PH ≥ II grade group.
In the PH ≥ I grade group, the DCAs of NomogramI and independent factors in the derivation (A, C) and validation set (B, D). In the PH ≥ II grade group, the DCAs of NomogramII and independent factors in the derivation (E, G) and validation set (F, H).

Update of

  • doi: 10.1101/2024.04.29.24306542
  • doi: 10.7554/eLife.98169.1
  • doi: 10.7554/eLife.98169.2

Similar articles

References

    1. Benza RL, Miller DP, Gomberg-Maitland M, Frantz RP, Foreman AJ, Coffey CS, Frost A, Barst RJ, Badesch DB, Elliott CG, Liou TG, McGoon MD. Predicting survival in pulmonary arterial hypertension: insights from the registry to evaluate early and long-term pulmonary arterial hypertension disease management (REVEAL) Circulation. 2010;122:164–172. doi: 10.1161/CIRCULATIONAHA.109.898122. - DOI - PubMed
    1. Burtscher M, Gatterer H, Burtscher J, Mairbäurl H. Extreme terrestrial environments: life in thermal stress and hypoxia: a narrative review. Frontiers in Physiology. 2018;9:572. doi: 10.3389/fphys.2018.00572. - DOI - PMC - PubMed
    1. D’Alto M, Bossone E, Opotowsky AR, Ghio S, Rudski LG, Naeije R. Strengths and weaknesses of echocardiography for the diagnosis of pulmonary hypertension. International Journal of Cardiology. 2018;263:177–183. doi: 10.1016/j.ijcard.2018.04.024. - DOI - PubMed
    1. Deng X, Hou H, Wang X, Li Q, Li X, Yang Z, Wu H. Development and validation of a nomogram to better predict hypertension based on a 10-year retrospective cohort study in China. eLife. 2021;10:e66419. doi: 10.7554/eLife.66419. - DOI - PMC - PubMed
    1. Dunham-Snary KJ, Wu D, Sykes EA, Thakrar A, Parlow LRG, Mewburn JD, Parlow JL, Archer SL. Hypoxic pulmonary vasoconstriction: from molecular mechanisms to medicine. Chest. 2017;151:181–192. doi: 10.1016/j.chest.2016.09.001. - DOI - PMC - PubMed

Publication types