. 2025 Feb 1;63(2):255-266.
doi: 10.1097/SHK.0000000000002505. Epub 2024 Nov 8.

INHIBITING SIRT2 ATTENUATES SEPSIS-INDUCED ACUTE KIDNEY INJURY VIA FOXO1 ACETYLATION-MEDIATED AUTOPHAGY ACTIVATION

INHIBITING SIRT2 ATTENUATES SEPSIS-INDUCED ACUTE KIDNEY INJURY VIA FOXO1 ACETYLATION-MEDIATED AUTOPHAGY ACTIVATION

Binmei Yu et al. Shock. .

Abstract

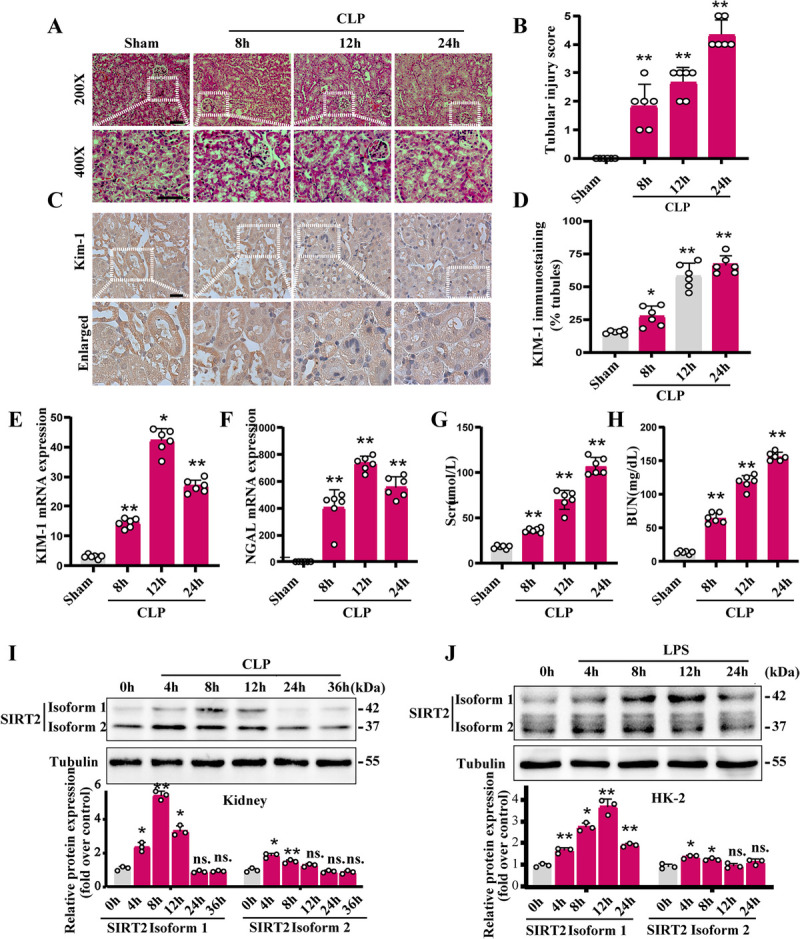
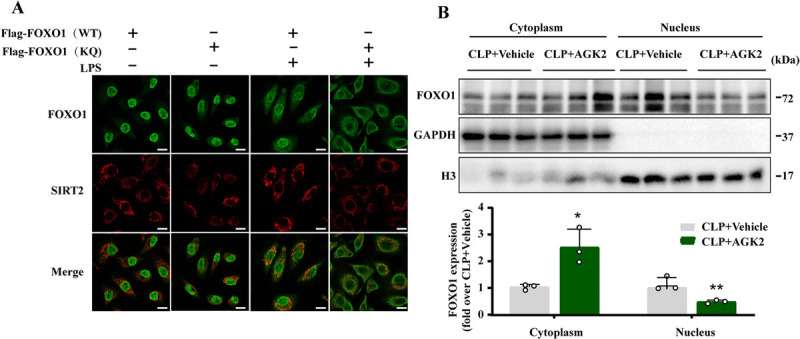
Sepsis-associated acute kidney injury (SAKI), a common complication in intensive care units (ICUs), is linked to high morbidity and mortality. Sirtuin 2 (SIRT2), an NAD + -dependent deacetylase, has been shown to have distinct effects on autophagy regulation compared to other sirtuins, but its role in SAKI remains unclear. This study explored the potential of SIRT2 as a therapeutic target for SAKI. We found that inhibition of SIRT2 with the antagonist AGK2 improved the survival of septic mice. SIRT2 inhibition reduced kidney injury, as indicated by lower levels of KIM-1, NGAL, serum creatinine, blood urea nitrogen, and proinflammatory cytokines following cecal ligation and puncture. Pretreatment with AGK2 in septic mice increased autophagosome and autolysosome formation in renal tubular epithelial cells and upregulated LC3 II expression in the renal cortex. Consistent with in vivo findings, SIRT2 gene silencing promoted autophagy in LPS-treated HK-2 cells, whereas SIRT2 overexpression inhibited it. Mechanistically, SIRT2 inhibition increased FOXO1 acetylation, inducing its nuclear-to-cytoplasmic translocation, which promoted kidney autophagy and alleviated SAKI. Our study suggests SIRT2 as a potential target for SAKI therapy.


Conflict of interest statement

The authors report no conflicts of interest.

Figures

Fig. 1
Fig. 1
Expression of SIRT2 during SAKI. A, H&E staining was performed on the renal cortex following CLP-induced sepsis (upper panel: scale bar = 50 μm; lower panel: scale bar = 25 μm). A, Tubular damage scores were assessed through pathological examination (n = 6). C, IHC staining of KIM-1 in the renal cortex (scale bar = 50 μm). D, Semiquantitative analysis of IHC staining for KIM-1 (n = 6). E and F, The mRNA expression levels of KIM-1 and NGAL were measured. G and H, Scr and BUN levels were evaluated (n = 6). I and J, Representative western blot analysis of SIRT2 protein expression both in vivo and in vitro, accompanied by densitometric analysis (n = 3). Data are presented as mean ± SEM (D–E, G–J) or mean ± SD (B, F). One-way ANOVA followed by Tukey’s post hoc test (H–J), Kruskal-Wallis (B, F) test, or Welch’s ANOVA (D–E, G) test followed by Dunn’s post hoc test was used. Statistical significance is indicated as *P < 0.05 and **P < 0.01 compared to the 0 h group. BUN, blood urea nitrogen; CLP, cecal ligation and puncture; H&E, hematoxylin-eosin staining; IHC, immunohistochemical; LPS, lipopolysaccharide; SAKI, sepsis-induced acute kidney injury; Scr, serum creatinine.
Fig. 2
Fig. 2
SIRT2 inhibition improved the survival rate of septic mice. AGK2 was administered intraperitoneally (10 mg/kg) 30 min before (A) or 1 h after (B) CLP. The survival rates were estimated using the Kaplan-Meier method and compared using the log-rank test. *P < 0.05 and **P < 0.01 vs. the CLP + vehicle group. CLP, cecal ligation, and puncture
Fig. 3
Fig. 3
SIRT2 inhibition improves renal function and alleviates kidney injury. AGK2 was administered intraperitoneally (10 mg/kg) 30 min before (top half) or 1 h after (bottom half) CLP. Kidney cortex tissue and serum samples were collected 12 h after CLP surgery. Top half: (A–B) Serum Scr and BUN levels (n = 6). C and D, The mRNA expression levels of KIM-1 and NGAL were measured. E and F, Pathological observation of kidney tissue. H&E-stained kidney cortex tissue sections. Tubular damage scores were based on H&E-stained kidney sections (n = 6, upper panel: scale bar = 50 μm; lower panel: scale bar = 25 μm). G, IHC staining of KIM-1 in the renal cortex (scale bar = 50 μm). I, Semiquantitative analysis of IHC staining for KIM-1 (n = 6). Data are presented as mean ± SEM (A–D, H) or mean ± SD (F). One-way ANOVA followed by Tukey’s post hoc test (A), Kruskal-Wallis (F) test, or Welch’s ANOVA (B–D, H) test followed by Dunn’s post hoc test was used. *P < 0.05 and **P < 0.01 vs. the sham + vehicle group; #P < 0.05 and ##P < 0.01 vs. the CLP + vehicle group. Bottom half: (I–J) Serum Scr and BUN levels (n = 6). K–L, The mRNA expression levels of KIM-1 and NGAL were measured. M and N, Pathological observation of kidney tissue. H&E-stained kidney cortex tissue sections. Tubular damage scores were based on H&E-stained kidney sections (n = 6, scale bar = 50 μm). Data are presented as mean ± SEM (I–L) or mean ± SD (N). Student’s paired two-tailed t test (I–L) or two-tailed Mann–Whitney test (N) was used. *P < 0.05 and **P < 0.01 vs. the CLP + vehicle group. AGK2, SIRT2 inhibitor; BUN, urea nitrogen; CLP, cecal ligation and puncture; SAKI, sepsis-induced acute kidney injury; Scr, serum creatinine.
Fig. 4
Fig. 4
Inhibition of SIRT2 suppressed the production of proinflammatory cytokines in an animal model of SAKI. Mice were pretreated with AGK2 (10 mg/kg) for 30 min before CLP to inhibit SIRT2. Kidney cortex tissue and serum samples were collected 12 h after CLP surgery. A–C, qRT–PCR was used to measure the expression of inflammation-related genes (IL-6, TNF-α, and IL-1β); the average target gene/GAPDH ratios of the different experimental groups are presented (n = 6). D–F, Serum levels of IL-6, TNF-α, and IL-1β were measured by ELISAs (n = 6). Data are presented as mean ± SEM. One-way ANOVA followed by Tukey’s post hoc test (B–C, E–F), Welch’s ANOVA (A, D) test followed by Dunn’s post hoc test were used. *P < 0.05 and **P < 0.01 vs. the sham + vehicle group; #P < 0.05 and ##P < 0.01 vs. the CLP + vehicle group. AGK2, SIRT2 inhibitor; CLP, cecal ligation and puncture; SAKI, sepsis-induced acute kidney injury.
Fig. 5
Fig. 5
Inhibition of SIRT2 promoted autophagy in S-AKI. Mice were pretreated with AGK2 for 30 min before CLP to inhibit SIRT2. Kidney cortex tissue samples were collected 12 h after CLP surgery. A, The kidney cortex was observed, and the number of autophagosomes was calculated in 10 randomly selected fields using a transmission electron microscope (black arrow: autophagosomes; upper panel: scale bar = 2 μm; lower panel: scale bar = 1 μm, n = 10). B, Representative western blot and densitometric analysis of LC3 II and SQSTM1 protein expression (n = 3). Data are presented as mean ± SEM. One-way ANOVA followed by Tukey’s post hoc test (B) and Welch’s ANOVA (A) test followed by Dunn’s post hoc test were used. *P < 0.05 and **P < 0.01 vs. the sham + vehicle group; #P < 0.05 and ##P < 0.01 vs. the CLP + vehicle group. AGK2, SIRT2 inhibitor; CLP, cecal ligation and puncture; GAPDH, glyceraldehyde 3-phosphate dehydrogenase; SQSTM1, sequestosome 1.
Fig. 6
Fig. 6
Knockdown of SIRT2 enhanced autophagy in vitro. A, Effects of Sirt2 knockdown on autophagic flux based on cellular immunoassays following LPS stimulation in different groups (scale bar = 10 μm). The mean numbers of autophagosomes (yellow dots per cell in merged images) and autolysosomes (red dots per cell in merged images) were calculated in 20 randomly selected cells (n = 20). The percentage of autolysosomes (free red spots / [yellow spots + free red spots] per cell) was calculated in 20 randomly selected cells to determine autophagic flux (n = 20). B, Representative western blots and densitometric analysis of LC3 II. GAPDH was used as an internal reference (n = 3). Data are presented as mean ± SEM. Kruskal-Wallis (A–B) test followed by Dunn’s post hoc test were used. *P < 0.05 and **P < 0.01 vs. the con-siRNA group; #P < 0.05 and ##P < 0.01 vs. the con-siRNA +LPS group. GAPDH, glyceraldehyde 3-phosphate dehydrogenase; GFP, green fluorescent protein; LC3II, microtubule-associated protein 1A/1B-light chain 3; LPS, lipopolysaccharide; mRFP, monomeric red fluorescence protein; SIRT2, silent mating-type information regulation 2.
Fig. 7
Fig. 7
SIRT2 and FOXO1 colocalized. A, STRING analysis of interactions between 10 potential SIRT2 targets (STRING database). B, Double immunofluorescence staining for colocalization of SIRT2 with FOXO1 in HK-2 cells. C, Association of SIRT2 with FOXO1 in the SAKI cell model. An HA-tagged SIRT2 plasmid was transfected into HK-2 cells. Total cell lysates were subjected to IP with an anti-HA antibody, and western blotting was performed with an anti-FOXO1 antibody. FOXO1, forkhead box O1; GAPDH, glyceraldehyde 3-phosphate dehydrogenase; IP, immunoprecipitation; LPS, lipopolysaccharide; SAKI, sepsis-induced acute kidney injury; SIRT2, silent mating-type information regulation 2.
Fig. 8
Fig. 8
SIRT2 deacetylated FOXO1. A, Mice were pretreated with AGK2 (10 mg/kg) for 30 min before CLP to inhibit SIRT2. Kidney cortex tissue samples were collected 12 h after CLP surgery. Endogenous FOXO1 was isolated by IP with an anti-FOXO1 antibody. Western blotting was performed with an acetylated lysine-specific antibody (Ace-K). B, AGK2 (0, 3, 10 μM, 30 min before and 1 after LPS challenge)-treated HK-2 cells were subjected to IP with an anti-FOXO1 antibody and detected with Ace-K. C, con-siRNA or SIRT2-siRNA was transfected into HK-2 cells with or without LPS stimulation. The acetylation of FOXO1 was examined via IP assays, and representative western blots were shown. D, A con-plasmid or SIRT2-plasmid was transfected into HK-2 cells with or without LPS stimulation. FOXO1 acetylation was detected by IP using Ace-K. FOXO1, forkhead box O1; GAPDH, glyceraldehyde 3-phosphate dehydrogenase; IP, immunoprecipitation; LPS, lipopolysaccharide; SAKI, sepsis-induced acute kidney injury; SIRT2, silent mating-type information regulation 2.
Fig. 9
Fig. 9
Deacetylation of FOXO1 inhibited autophagy in RTECs. The acetylation of FOXO1 markedly decreased after mutation of K262, K265, and K274. FLAG-tagged FOXO1 (WT, KR) was transfected into HK-2 cells with or without LPS stimulation. A, Effects of FOXO1 mutation on autophagic flux assessed by cellular immunoassays (magnification ×630 and scale bar = 10 μm). The quantification of GFP, mRFP, autophagosome, and autolysosome counts per cell is shown on the right. B, Representative western blots and densitometric analysis of LC3 II. GAPDH was used as an internal reference (n = 3). Data are presented as mean ± SEM (B) or mean ± SD (A). One-way ANOVA followed by Tukey’s post hoc test (B), and Kruskal-Wallis (A) test followed by Dunn’s post hoc test were used. *P < 0.05 and **P < 0.01 vs. the Flag-FOXO1(WT) group; #P < 0.05 and ##P < 0.01 vs. the Flag-FOXO1(WT) + LPS group. GAPDH, glyceraldehyde 3-phosphate dehydrogenase; GFP, green fluorescent protein; LC3II, microtubule-associated protein 1A/1B-light chain 3; LPS, lipopolysaccharide; mRFP, monomeric red fluorescence protein; RTECs, renal tubular epithelial cells; SIRT2, silent mating-type information regulation 2.
Fig. 10
Fig. 10
Acetylated FOXO1 was excluded from the nucleus and remained in the cytoplasm. A, Subcellular location of FOXO1 in HK-2 cells. HK-2 cells were infected with Flag-FOXO1(WT) or Flag-FOXO1(KQ) for 48 h, followed by immunofluorescence to detect the FOXO1 protein (scale bar = 10 μm). B, Western blot analysis of FOXO1 expression in the cytoplasm and nucleus of AGK2-treated CLP mice. Data are presented as mean ± SEM. Statistical significance between groups was calculated by Student’s paired two-tailed t test. *P < 0.05 and **P < 0.01 vs. the CLP + vehicle group. AGK2, SIRT2 inhibitor; CLP, cecal ligation and puncture; FOXO1, forkhead box O1; GAPDH, glyceraldehyde 3-phosphate dehydrogenase; H3, histone H3.

Similar articles

Cited by

References

    1. Cecconi M Evans L Levy M, et al. . Sepsis and septic shock. Lancet. 2018;392(10141):75–87. - PubMed
    1. Shankar-Hari M Phillips GS Levy ML, et al. . Developing a new definition and assessing new clinical criteria for septic shock: for the third international consensus definitions for sepsis and septic shock (sepsis-3). JAMA. 2016;315(8):775–787. - PMC - PubMed
    1. White KC Serpa-Neto A Hurford R, et al. . Sepsis-associated acute kidney injury in the intensive care unit: incidence, patient characteristics, timing, trajectory, treatment, and associated outcomes. A multicenter, observational study. Intensive Care Med. 2023;49(9):1079–1089. - PMC - PubMed
    1. Zarbock A Nadim MK Pickkers P, et al. . Sepsis-associated acute kidney injury: consensus report of the 28th Acute Disease Quality Initiative workgroup. Nat Rev Nephrol. 2023;19(6):401–417. - PubMed
    1. Zhao S Liao J Shen M, et al. . Epigenetic dysregulation of autophagy in sepsis-induced acute kidney injury: the underlying mechanisms for renoprotection. Front Immunol. 2023;14:1180866. - PMC - PubMed