

Integrating transcriptomic data and digital pathology for NRG-based prediction of prognosis and therapy response in gastric cancer
- PMID: 39527470
- PMCID: PMC11556273
- DOI: 10.1080/07853890.2024.2426758
Integrating transcriptomic data and digital pathology for NRG-based prediction of prognosis and therapy response in gastric cancer
Abstract
Background: Cancer is characterized by its ability to resist cell death, and emerging evidence suggests a potential correlation between non-apoptotic regulated cell death (RCD), tumor progression, and therapy response. However, the prognostic significance of non-apoptotic RCD-related genes (NRGs) and their relationships with immune response in gastric cancer (GC) remain unclear.
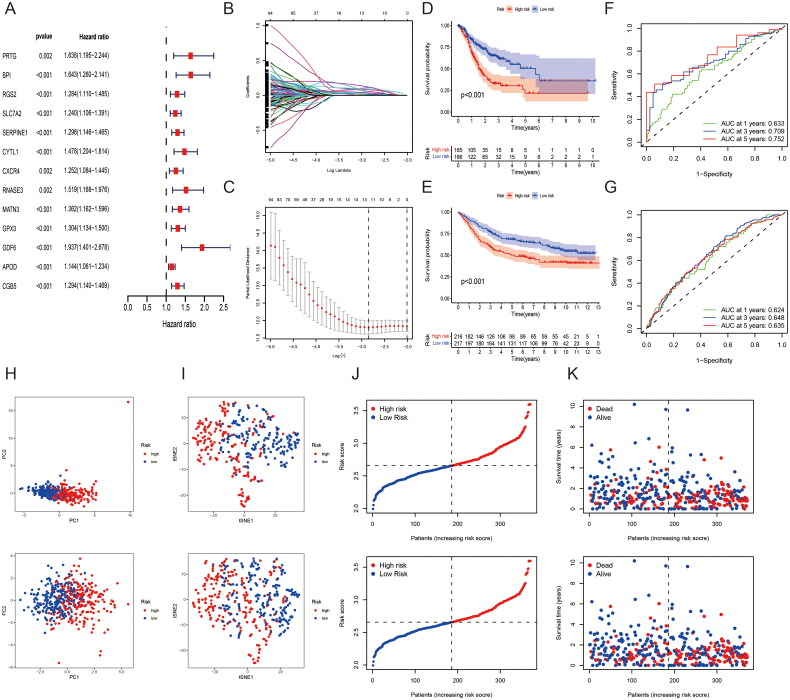
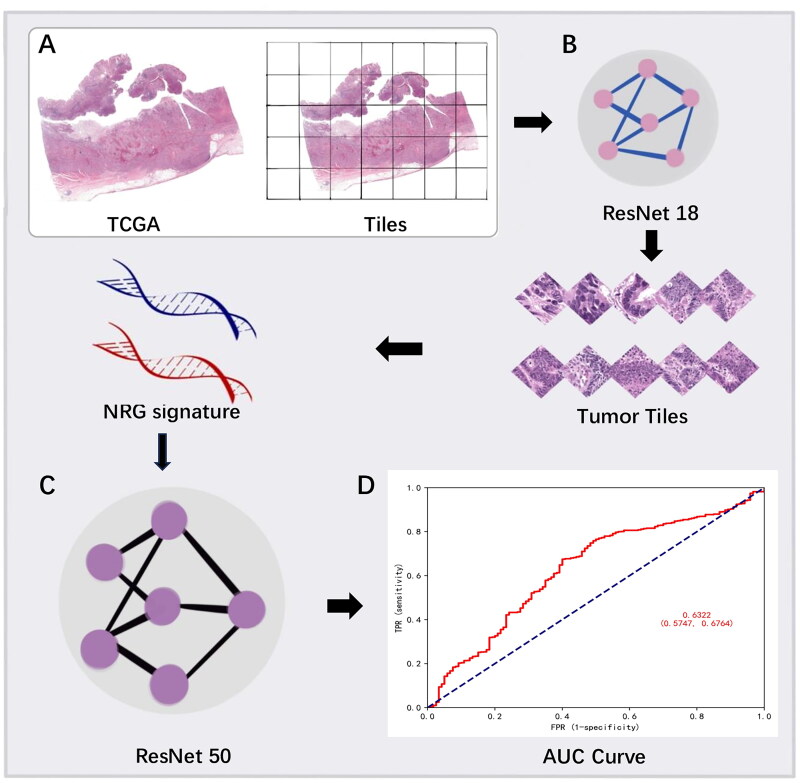
Methods: In this study, RNA-seq gene expression and clinical information of GC patients were acquired from The Cancer Genome Atlas and the Gene Expression Omnibus databases. Cox and LASSO regression analyses were used to construct the NRG signature. Moreover, we developed a deep learning model based on ResNet50 to predict the NRG signature from digital pathology slides. The expression of signature hub genes was validated using real-time quantitative PCR and single-cell RNA sequencing data.
Results: We identified 13 NRGs as signature genes for predicting the prognosis of patients with GC. The high-risk group, characterized by higher NRG scores, demonstrated a shorter overall survival rate, increased immunosuppressive cell infiltration, and immune dysfunction. Moreover, associations were observed between the NRG signature and chemotherapeutic drug responsiveness, as well as immunotherapy effectiveness in GC patients. Furthermore, the deep learning model effectively stratified GC patients based on the NRG signature by leveraging morphological variances, showing promising results for the classification of GC patients. Validation experiments demonstrated that the expression level of SERPINE1 was significantly upregulated in GC, while the expression levels of GPX3 and APOD were significantly downregulated.
Conclusion: The NRG signature and its deep learning model have significant clinical implications, highlighting the importance of individualized treatment strategies based on GC subtyping. These findings provide valuable insights for guiding clinical decision-making and treatment approaches for GC.
Keywords: Gastric cancer; deep learning; non-apoptotic regulated cell death; prognosis; therapy.
Conflict of interest statement
No potential conflict of interest was reported by the author(s).
Figures


Similar articles
-
Development and validation of a hypoxia- and mitochondrial dysfunction- related prognostic model based on integrated single-cell and bulk RNA sequencing analyses in gastric cancer.Front Immunol. 2024 Aug 6;15:1419133. doi: 10.3389/fimmu.2024.1419133. eCollection 2024. Front Immunol. 2024. PMID: 39165353 Free PMC article.
-
Identification of immunotherapy-related subtypes, characterization of tumor microenvironment infiltration, and development of a prognostic signature in gastric carcinoma.Aging (Albany NY). 2024 Jun 25;16(14):11185-11207. doi: 10.18632/aging.205968. Epub 2024 Jun 25. Aging (Albany NY). 2024. PMID: 39074262 Free PMC article.
-
Microsatellite-Stable Gastric Cancer Can be Classified into 2 Molecular Subtypes with Different Immunotherapy Response and Prognosis Based on Gene Sequencing and Computational Pathology.Lab Invest. 2025 Apr;105(4):104101. doi: 10.1016/j.labinv.2025.104101. Epub 2025 Jan 31. Lab Invest. 2025. PMID: 39894411
-
Characterization of tumor endothelial cells (TEC) in gastric cancer and development of a TEC-based risk signature using single-cell RNA-seq and bulk RNA-seq data.Aging (Albany NY). 2024 Jun 12;16(12):10252-10270. doi: 10.18632/aging.205928. Epub 2024 Jun 12. Aging (Albany NY). 2024. PMID: 38870270 Free PMC article.
-
A novel necroptosis-related gene index for predicting prognosis and a cold tumor immune microenvironment in stomach adenocarcinoma.Front Immunol. 2022 Oct 27;13:968165. doi: 10.3389/fimmu.2022.968165. eCollection 2022. Front Immunol. 2022. PMID: 36389725 Free PMC article. Review.
References
-
- Koren E, Fuchs Y.. Modes of regulated cell death in cancer. Cancer Discov. 2021;11(2):245–265. doi: 10.1158/2159-8290.CD-20-0789. - DOI - PubMed
MeSH terms
Substances
LinkOut - more resources
Full Text Sources
Other Literature Sources
Medical
Miscellaneous