. 2024 Nov 26;43(11):114978.
doi: 10.1016/j.celrep.2024.114978. Epub 2024 Nov 10.

Aberrant zonal recycling of germinal center B cells impairs appropriate selection in lupus

Affiliations

Aberrant zonal recycling of germinal center B cells impairs appropriate selection in lupus

Gina M Sanchez et al. Cell Rep. .

Abstract

Autoimmune diseases such as lupus are characterized by polyclonal B cell activation, leading to the production of autoantibodies. The mechanism leading to B cell dysregulation is unclear; however, the defect may lie in selection within germinal centers (GCs). GC B cells cycle between proliferation and mutation in the dark zone and selection in the light zone (LZ). Temporal assessment of GCs from mice with either persistent infection or lupus showed an accumulation of LZ B cells. Yet, only in lupus, GC B cells exhibited reduced proliferation and progressive loss of MYC and FOXO1, which regulate zonal recycling and differentiation. As lupus progressed, decreased mutational frequency and repertoire diversity were associated with reduced responsiveness to CD40 signaling, despite accumulation of plasma cells. Collectively, these findings suggest that lupus disease progression coincides with an intrinsic defect in LZ B cell signaling, altering the zonal recycling, selection, and differentiation of autoreactive B cells.

Keywords: B cells; CP: Immunology; autoimmunity; germinal center.


Conflict of interest statement

Declaration of interests The authors report no competing interests.

Figures
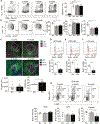
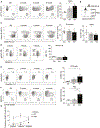
Figure 1.
Figure 1.. Defect in germinal center functionality in lupus.
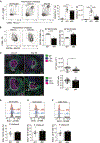
At 2, 4, or 6 months of age, B6.Sle1.yaa mice were compared to 6-month-old B6 mice. (A) GC B cells were stained for fluorescence-activated cell sorting (FACS) and quantified (right). (B) Representative FACS plot (left) and quantification (right) of zonal distribution of GC B cells between the DZ and the LZ at each stage of disease. (C) Confocal microscopy of spleens from 2- and 6-month-old B6.Sle1.yaa mice imaged at 20× original magnification. Spleens were stained for IgD (green), CD4 (blue), and either PNA (pink, top) or CD35 (pink, bottom). GCs were quantified for total area (left) and LZ proportion of the total GC (right) temporally. Each symbol represents one GC. (D–F) Intracellular staining for BrdU incorporation in GC B cells (D), DZ B cells (E), and LZ B cells (F) was assessed by flow cytometry and quantified. (G) Intracellular staining for BrdU incorporation and 7-AAD in LZ B cells. Representative FACS plots (top) and quantification (bottom) are shown. Independent unpaired t tests and one-way ANOVAs were performed. Data are representative of three independent experiments with three to five mice per group. Each symbol represents one mouse. Mean ± standard error of the mean (SEM). *p ≤ 0.05, **p ≤ 0.01, ***p ≤ 0.001, and ****p ≤ 0.0001.
Figure 2.
Figure 2.. Plasmodium chabaudi effects on chronic GCs.
B6 mice were infected with P. chabaudi for 21 days (peak GC response) or 60 days (persistent response) or were uninfected (UI). (A) Flow cytometric analysis of total GC B cells at each time point, quantified on the right. (B) Flow cytometric analysis of zonal distribution of GC B cells over infection, quantified on the right. (C) Confocal microscopy of spleens from mice at either 21 or 60 d.p.i., imaged at 20× original magnification. Spleens were stained for IgD (green), CD4 (blue), and either PNA (pink, top) or CD35 (pink, bottom). GCs were quantified for total area (top) and LZ proportion of the total GC (bottom). Each symbol represents one GC. (D–F) BrdU incorporation was measured in total (D) GC B cells, (E) DZ B cells, and (F) LZ B cells. Independent unpaired t tests were performed. Data are representative of three independent experiments with 5–10 mice per group. Each symbol represents one mouse. Mean ± SEM; **p ≤ 0.01 and ****p ≤ 0.0001.
Figure 3.
Figure 3.. Transcriptomics reveals a defect in selection processes.
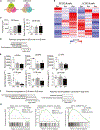
DZ and LZ B cells from two B6.Sle1.yaa mice at 2, 4, and 6 months of age were sort-purified and underwent bulk RNA-seq. (A) Venn diagrams of genes differentially expressed between each two time points in DZ (left) and LZ (right) GC B cells. (B) Hierarchical clustering of differentially expressed transcripts at each time point in DZ (left) and LZ (right) GC B cells. (C) Quantification of Foxo1 transcripts (left) and expression assessed by RT-qPCR (2−ΔΔCt method relative to HPRT, right) in DZ B cells at each stage of disease. Each symbol represents one mouse. (D) Ingenuity Pathway Analysis of differentially expressed genes showing pathways of interest that were upregulated in DZ B cells. (E) Quantification of Myc, Cd40, and Il21r transcripts (top) and expression assessed by RT-qPCR (2−ΔΔ Ct method relative to HPRT, bottom) in LZ B cells at each disease time point. Each symbol represents one mouse. (F) Ingenuity Pathway Analysis of differentially expressed genes showing pathways of interest upregulated (left) or downregulated (right) in LZ B cells at the severe disease state relative to pre-disease. (G) GSEA enrichment plots representing selected upregulated or downregulated pathways in LZ B cells. For RNA-seq, n = 2 mice per time point. Mean ± SEM. *p ≤ 0.05.
Figure 4.
Figure 4.. The BCR repertoire of GC B cells becomes less diverse as lupus progresses.
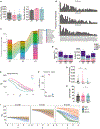
Splenic GC B cells from three individual B6.Sle1.yaa mice at each stage of disease were sort-purified and individually barcoded and underwent BCR sequencing. (A) Total number of clones (left) and number of clones normalized to the total cell count of that mouse (right). Each symbol represents one mouse. (B) The frequency of IGHV family usage from each clonotype from mice at each stage of disease. (C) Mice within time points were pooled into one datapoint per stage of disease, and the top numbers of clonotypes were determined. Specific clonotypes were colored based on similarities, then the proportions of each were compared between different stages of disease. (D) Percentage (left) and number (right) of cells expressing Igg1, Igg2b, Igg2c, or Igm BCRs. (E) BCR repertoire diversity visualized as sample diversity comparing each stage of disease. Solid line indicates average per time point, and shaded region represents the variability between mice per group. (F) Shannon Index quantification to assess selection. (G) BCR mutational frequency at each time point. (H) CDR3 length quantification of each BCR analyzed (each symbol represents one cell). (I) Diversity of the BCR repertoire at each time point in the IgM, IgG1, or IgG2c subset. For single-cell RNA (scRNA)-seq, n = 3 mice per time point. Mean ± SEM. *p ≤ 0.05 and **p ≤ 0.01.
Figure 5.
Figure 5.. Transcriptional profile of GC B cell fates over lupus disease progression.
Splenic GC B cells from three individual B6.Sle1.yaa mice at each stage of disease were sort-purified and barcoded and underwent scRNA-seq. (A) UMAP analysis revealed 17 clusters of pooled GC B cells at each time point (bottom). (B) Heatmap of genes related to zonal distribution and post-GC fate at each time point. (C) Heatmap of DZ (left) and LZ (right) profiles on merged UMAP. (D) Heatmap of activity of significant transcription factors impacting Myc from combining all cells in LZ clusters at 2 and 6 month. The p values were calculated using Student’s t test with a Benjamini-Hochberg post-test for a false discovery rate. For scRNA-seq, n = 3 mice per time point.
Figure 6.
Figure 6.. Impairment in zone-defining transcription factors.
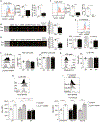
B6.Sle1.yaa mice at 2 and 6 months of age were analyzed for usage of zone-defining transcription factors. (A and B) Intracellular staining of DZ B cells for FOXO1 via (A) flow cytometry for expression (left) and quantification (right) and (B) ImageStream for nuclearization of FOXO1. (C and D) Intracellular staining of LZ B cells for MYC via (C) flow cytometry for expression (left) and quantification (right) and (D) ImageStream for nuclearization of MYC. Dashed line represents average mean fluorescence intensity (MFI) of naive B cells. (E) Intracellular ImageStream staining for MYC in LZ B cells from P. chabaudi-infected mice analyzed by flow cytometry. (F) pSTAT3 expression in total LZ B cells (middle) and the pSTAT3+ LZ B cells (right) at each time point after ex vivo stimulation with recombinant IL-21. Dashed line represents average MFI of unstimulated cells. (G) CD40 expression on LZ B cells at each lupus time point. Dashed line represents average MFI of naive B cells. (H) MYC expression in response to ex vivo stimulation with anti-IgM with or without CD40L and IL-21 at each lupus time point. (I) MYC expression in response to ex vivo stimulation with anti-IgM with or without CD40L and IL-21 in P. chabaudi-infected mice at each time point. Dashed line indicates naive B cell control. Independent unpaired t tests were utilized. Data are representative of three independent experiments with 5–10 mice per group. Each symbol represents one mouse. Mean ± SEM. *p ≤ 0.05, **p ≤ 0.01, ***p ≤ 0.001, and ****p ≤ 0.0001.
Figure 7.
Figure 7.. Alterations in GC-derived B cell fates over lupus disease progression.
B6.Sle1.yaa mice were aged out to their respective disease time points, and spleens were analyzed for B cell fate by flow cytometry. (A) Representative FACS plots (left) and quantification (right) of ABCs at each time point. (B) The ABC population from (A) was further examined for Ephrin-B1 to determine GC status. Representative histogram on top and quantification below. (C) Representative FACS plots (left) and quantification (right) for memory B cells at each time point. (D) Memory B cells were interrogated for class switching by measuring IgM. Expression-representative FACS plots (left) and quantification (right) at each time point. (E) Representative FACS plots (left) and quantification (right) of CD69 on LZ B cells at each time point. (F) Representative FACS plots (left) and quantification (right) of plasma cells at each time point. (G) Graph of ABCs, Bmems, and PCs as a frequency of total activated B cells at each stage of disease. Data are representative of three independent experiments with three to five mice per group. Each symbol represents one mouse. Mean ± SEM. *p ≤ 0.05 and **p ≤ 0.01.

References

    1. MacLennan IC (1994). Germinal centers. Annu. Rev. Immunol. 12, 117–139. - PubMed
    1. Allen CDC, Okada T, and Cyster JG (2007). Germinal-center organization and cellular dynamics. Immunity 27, 190–202. 10.1016/j.immuni.2007.07.009. - DOI - PMC - PubMed
    1. Victora GD, Schwickert TA, Fooksman DR, Kamphorst AO, Meyer-Hermann M, Dustin ML, and Nussenzweig MC (2010). Germinal center dynamics revealed by multiphoton microscopy with a photoactivatable fluorescent reporter. Cell 143, 592–605. 10.1016/j.cell.2010.10.032. - DOI - PMC - PubMed
    1. De Silva NS, and Klein U (2015). Dynamics of B cells in germinal centres. Nat. Rev. Immunol. 15, 137–148. 10.1038/nri3804. - DOI - PMC - PubMed
    1. Mesin L, Ersching J, and Victora GD (2016). Germinal Center B Cell Dynamics. Immunity 45, 471–482. 10.1016/j.immuni.2016.09.001. - DOI - PMC - PubMed

Publication types

Associated data