

Association between complete blood-count-based inflammatory scores and hypertension in persons living with and without HIV in Zambia
- PMID: 39527564
- PMCID: PMC11554205
- DOI: 10.1371/journal.pone.0313484
Association between complete blood-count-based inflammatory scores and hypertension in persons living with and without HIV in Zambia
Abstract
Background: Hypertension is a risk factor for cardiovascular events. Inflammation plays an important role in the development of essential hypertension. Studies assessing the association between complete blood count-based inflammatory scores (CBCIS) and hypertension are scarce. Therefore, this study aimed to determine the relationship between CBCIS and hypertension among individuals with and without human immunodeficiency virus (HIV).
Method: This was a cross-sectional study among 344 participants at Serenje District Hospital and Serenje Urban Clinic. We used structured questionnaires to collect sociodemographic, clinical and laboratory characteristics. CBCIS included lymphocyte-monocyte ratio (LMR), neutrophil-lymphocyte ratio (NLR), platelet-lymphocyte ratio (PLR), derived neutrophil-lymphocyte ratio (d-NLR), and differential white blood cells. The primary outcome variable was hypertension defined as systolic and diastolic blood pressure higher than or equal to 140/90 mmHg. Logistic regression was used to estimate the association between hypertension and CBCIS in statistical package for social science (SPSS) version 22.0.
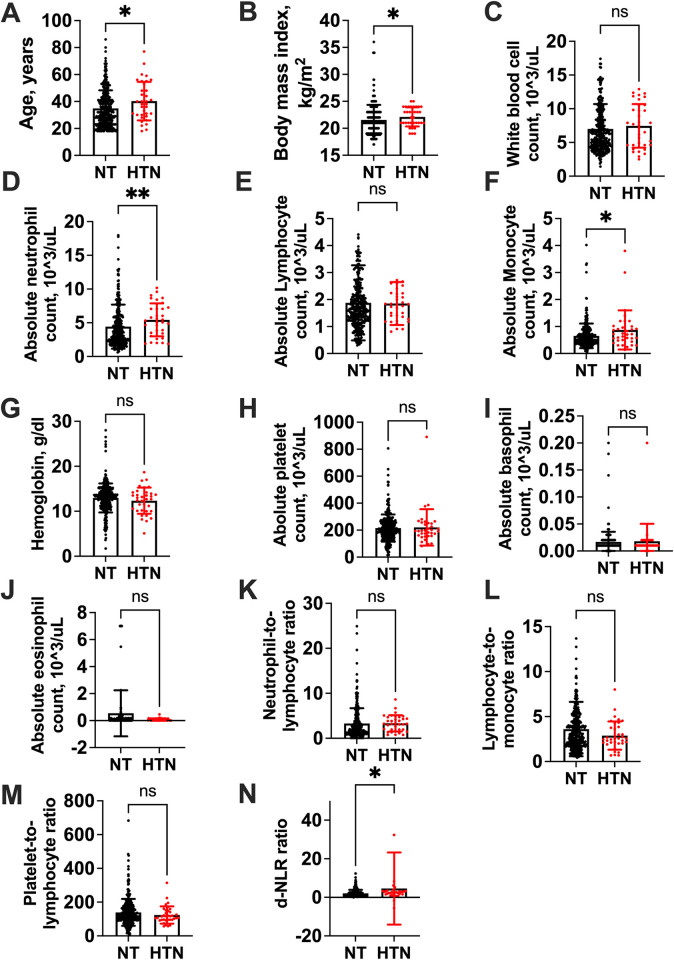
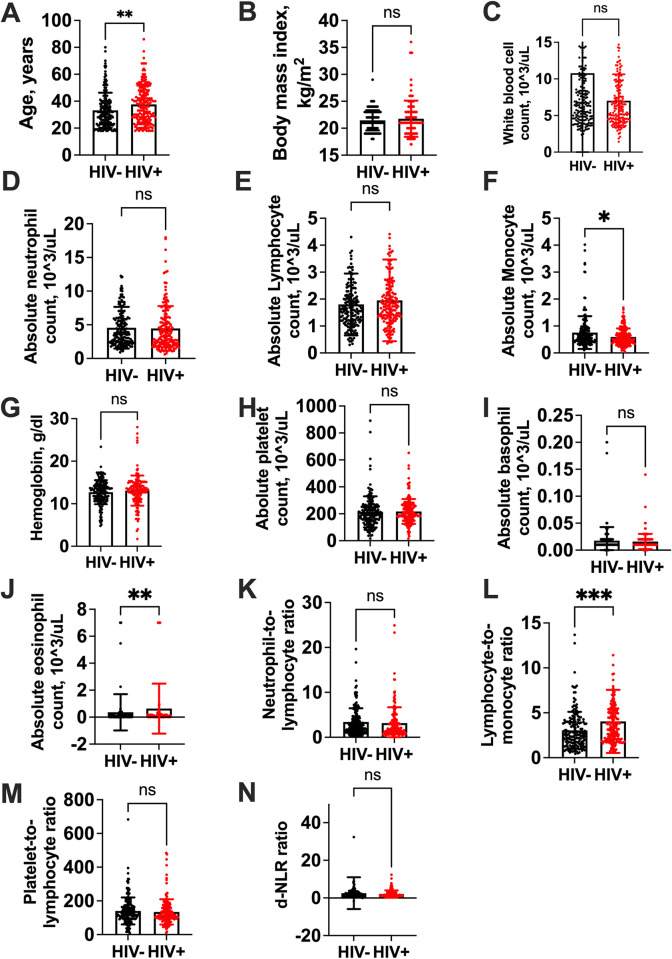
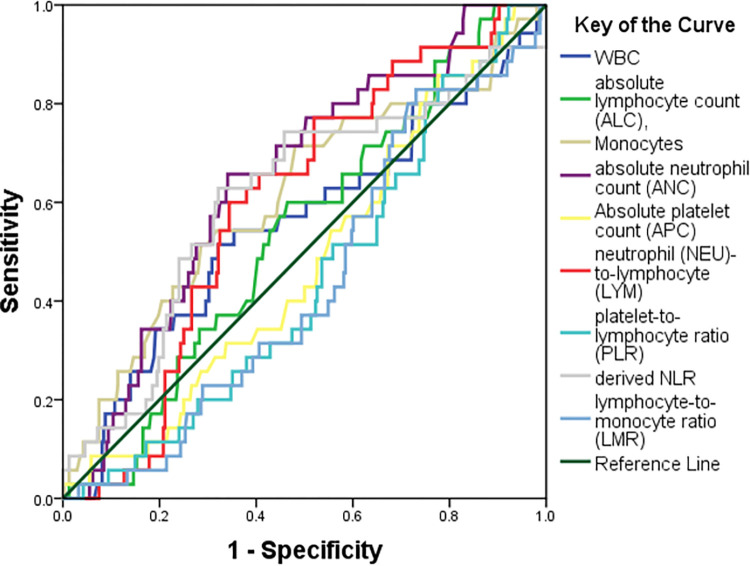
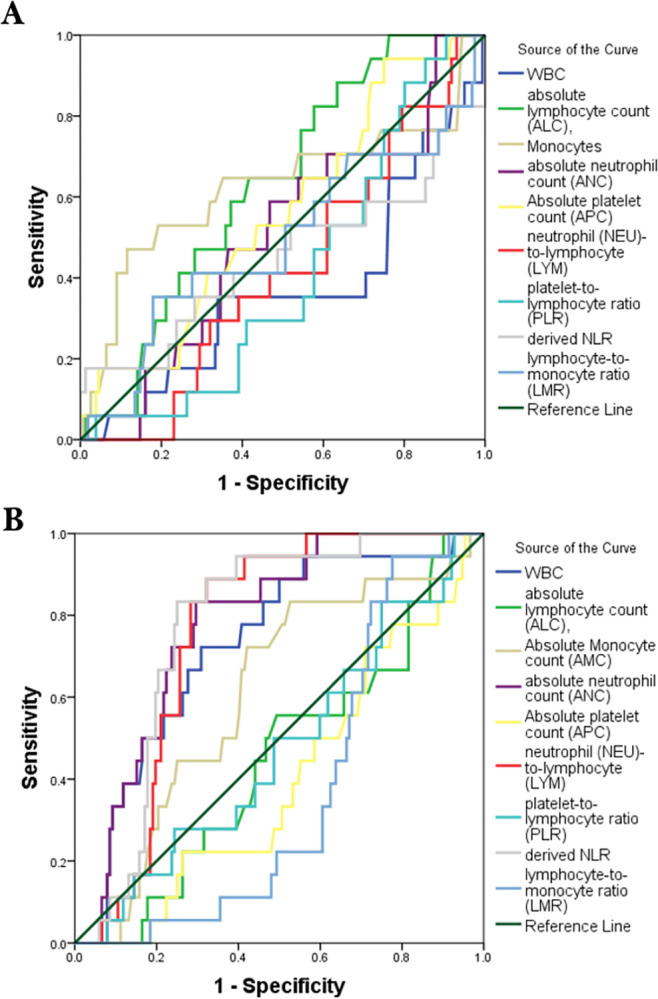
Results: The participants had a median age of 32 years (interquartile range (IQR) 24-42) and 65.1% (n = 224) were female. The prevalence of hypertension was 10.5% (n = 36). Among those with hypertension, 55.6% (n = 20) were female and 44.4% (n = 16) were male. The CBCIS significantly associated with hypertension in people living with HIV (PLWH) was PLR (adjusted odds ratio (AOR) 0.98; 95% confidence interval (CI) 0.97-0.99, p = 0.01) while in people without HIV, AMC (AOR 15.40 95%CI 3.75-63.26), ANC (AOR 1.88 95%CI 1.05-3.36), WBC (AOR 0.52 95%CI 0.31-0.87) and PLR (AOR 0.98 95%CI 0.97-0.99) were the factors associated with hypertension. Compared to people without HIV, only WBC, ANC, NLR, and d-NLR were good predictors of hypertension among PLWH.
Conclusion: Our study indicates a notable HIV-status driven association between CBCIS and hypertension, suggesting the use of CBICS as potential biomarkers for hypertension risk with substantial implications for early detection and preventive measures.
Copyright: © 2024 Mwape et al. This is an open access article distributed under the terms of the Creative Commons Attribution License, which permits unrestricted use, distribution, and reproduction in any medium, provided the original author and source are credited.
Conflict of interest statement
The authors have declared that no competing interests exist.
Figures
Similar articles
-
Metabolic syndrome among treatment-naïve people living with and without HIV in Zambia and Zimbabwe: a cross-sectional analysis.J Int AIDS Soc. 2022 Dec;25(12):e26047. doi: 10.1002/jia2.26047. J Int AIDS Soc. 2022. PMID: 36522287 Free PMC article.
-
Prevalence and factors associated with moderate-to-severe anaemia among virally suppressed people with HIV at a tertiary hospital in Zambia.PLoS One. 2024 Aug 26;19(8):e0303734. doi: 10.1371/journal.pone.0303734. eCollection 2024. PLoS One. 2024. PMID: 39186572 Free PMC article.
-
Metabolic syndrome in Zambian adults with human immunodeficiency virus on antiretroviral therapy: Prevalence and associated factors.Medicine (Baltimore). 2021 Apr 9;100(14):e25236. doi: 10.1097/MD.0000000000025236. Medicine (Baltimore). 2021. PMID: 33832083 Free PMC article.
-
Prognostic value of inflammatory markers NLR, PLR, LMR, dNLR, ANC in melanoma patients treated with immune checkpoint inhibitors: a meta-analysis and systematic review.Front Immunol. 2024 Oct 18;15:1482746. doi: 10.3389/fimmu.2024.1482746. eCollection 2024. Front Immunol. 2024. PMID: 39493767 Free PMC article.
-
Prognostic value of inflammatory markers NLR, PLR, and LMR in gastric cancer patients treated with immune checkpoint inhibitors: a meta-analysis and systematic review.Front Immunol. 2024 Jul 10;15:1408700. doi: 10.3389/fimmu.2024.1408700. eCollection 2024. Front Immunol. 2024. PMID: 39050856 Free PMC article.
References
MeSH terms
Grants and funding
LinkOut - more resources
Full Text Sources
Medical
