. 2025 Jan;12(1):e2405083.
doi: 10.1002/advs.202405083. Epub 2024 Nov 11.

STAMBPL1/TRIM21 Balances AXL Stability Impacting Mesenchymal Phenotype and Immune Response in KIRC

Affiliations

STAMBPL1/TRIM21 Balances AXL Stability Impacting Mesenchymal Phenotype and Immune Response in KIRC

Shiyu Huang et al. Adv Sci (Weinh). 2025 Jan.

Abstract

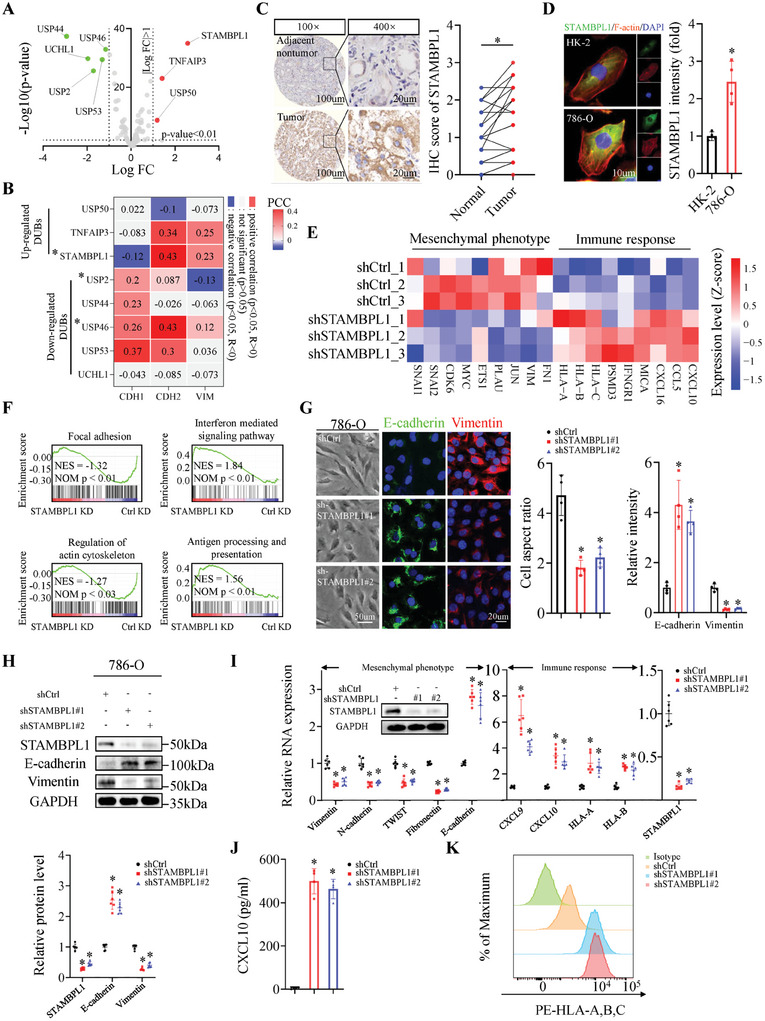
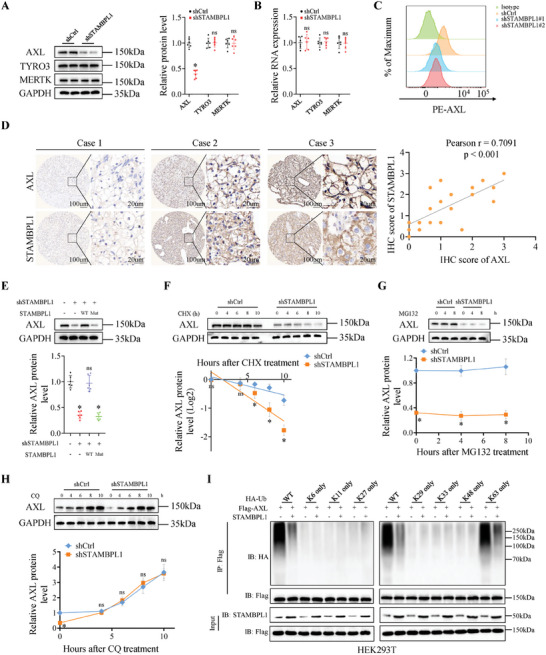
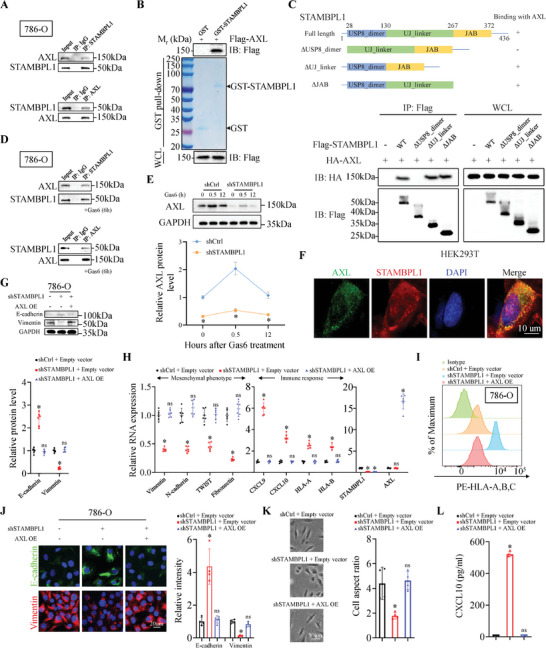
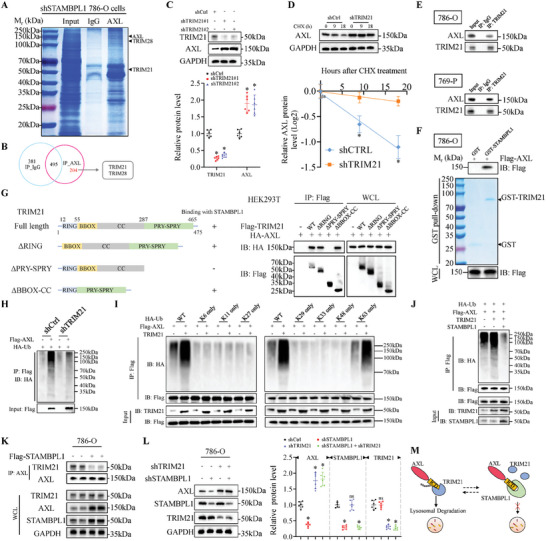
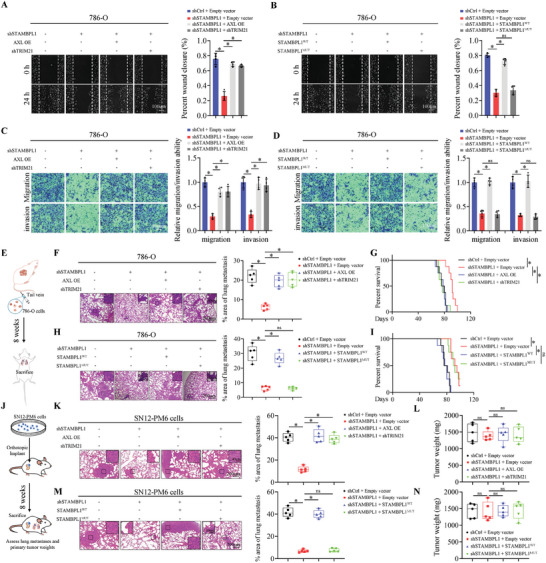
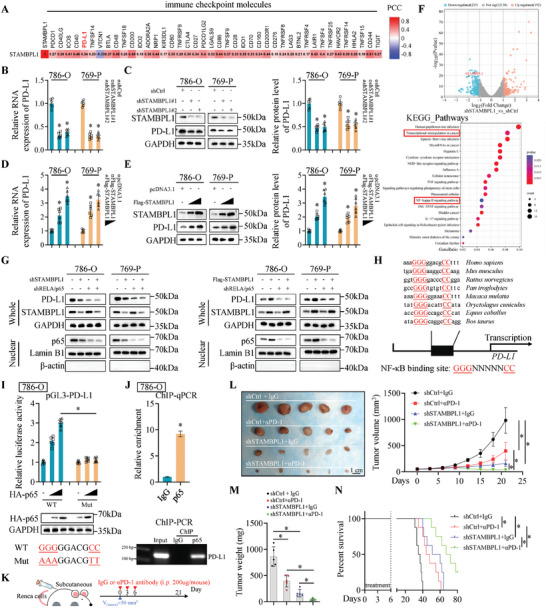
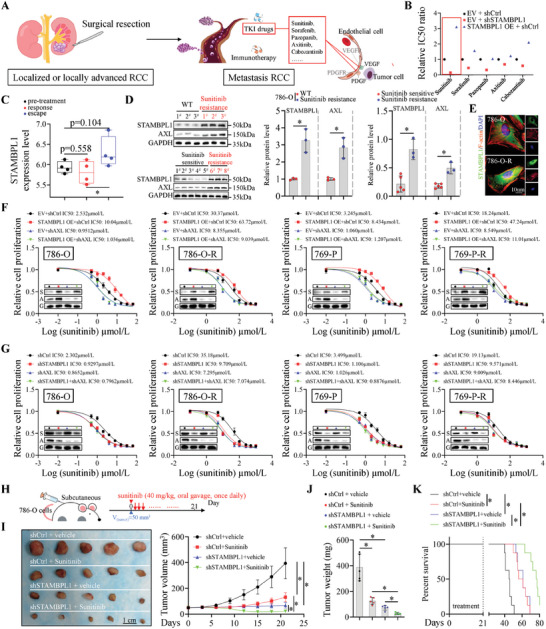
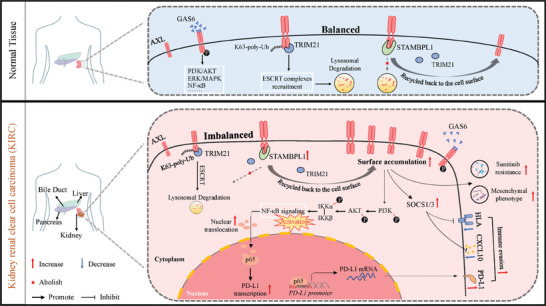
Kidney renal clear cell carcinoma (KIRC) is recognized as an immunogenic tumor, and immunotherapy is incorporated into its treatment landscape for decades. The acquisition of a tumor mesenchymal phenotype through epithelial-to-mesenchymal transition (EMT) is associated with immune evasion and can contribute to immunotherapy resistance. Here, the involvement of STAM Binding Protein Like 1 (STAMBPL1) is reported in the development of mesenchymal and immune evasion phenotypes in KIRC cells. Mechanistically, STAMBPL1 elevated protein abundance and surface accumulation of TAM Receptor AXL through diminishing the TRIM21-mediated K63-linked ubiquitination and subsequent lysosomal degradation of AXL, thereby enhancing the expression of mesenchymal genes while suppressing chemokines CXCL9/10 and HLA/B/C. In addition, STAMBPL1 enhanced PD-L1 transcription via facilitating nuclear translocation of p65, and knockdown (KD) of STAMBPL1 augmented antitumor effects of PD-1 blockade. Furthermore, STAMBPL1 silencing and the tyrosine kinase inhibitor (TKI) sunitinib also exhibited a synergistic effect on the suppression of KIRC. Collectively, targeting the STAMBPL1/TRIM21/AXL axis can decrease mesenchymal phenotype and potentiate anti-tumor efficacy of cancer therapy.

Keywords: STAM binding protein like 1; immunotherapy resistance; kidney renal clear cell carcinoma; mesenchymal phenotype; ubiquitination.


Conflict of interest statement

The authors declare no conflict of interest.

Figures

Figure 1
Figure 1
STAMBPL1 contributes to KIRC cell mesenchymal phenotype and immune evasion. A) Volcano plot of significantly upregulated (red) and downregulated (green) DUB genes in KIRC relative to the normal adjacent tissue. Differential analyses were performed using the R packages DESeq2 and cut off is | log2[fold change] | >1, P value < 0.01. B) Heatmap showing the correlation between the indicated DUB and CDH1, CDH2 or VIM, and correlation coefficients were calculated using the Pearson test. Two‐sided p‐value was given. C) Representative images and the quantitative results from IHC staining of STAMBPL1 in human KIRC tissues (n = 20) and matched adjacent normal tissues (n = 20). D) Representative IF images of STAMBPL1 (green) and F‐actin (red) in HK‐2 cells and 786‐O KIRC cells. DNA was stained with DAPI (blue). Relative intensities were assessed by Image J software (n = 4). E) Heatmap of mesenchymal and immune response genes from RNA‐seq for control and STAMBPL1 KD 786‐O cells (n = 3). F) GSEA enrichment plots for selected gene sets by RNA‐seq (STAMBPL1 KD versus control KD) were presented, displaying NES (Normalized Enrichment Score) and corresponding Nominal P‐values (NOM p). G) Representative brightfield images of control and STAMBPL1 KD 786‐O cells, and representative IF images of E‐cadherin (green) and Vimentin (red) (left panel). Cell aspect ratio and relative immunofluorescence intensities were quantified (right panel) (n = 4). H) Immunoblots and quantitative results of EMT‐related proteins (n = 6), GAPDH was used as loading control. I) RT‐qPCR analysis of mesenchymal and immune response genes in control and STAMBPL1 KD 786‐O cells (n = 6). J) Quantification of secreted CXCL10 from control and STAMBPL1 KD 786‐O cells was performed using ELISA (n = 4). K) Flow cytometry assays were used to analyze the effect of STAMBPL1 on HLA‐A/B/C surface expression in 786‐O cells (n = 4). All data are represented as mean ± SD, and analyzed using one‐way ANOVA followed by Tukey post hoc test. For the analysis in (C), a paired two‐tailed Student's t‐test was conducted. For the analysis in (D), an unpaired two‐tailed Student′s t test was performed. *p<0.05; PCC, Pearson's correlation coefficient; Ctrl, control.
Figure 2
Figure 2
STAMBPL1 inhibition enhances AXL degradation via the ubiquitin‐lysosome pathway. A) Immunoblots and quantitative results of TAM receptors proteins in control and STAMBPL1 KD 786‐O cells (n = 6), GAPDH was used as loading control. B) RT‐qPCR analysis of TAM receptors genes in control and STAMBPL1 KD 786‐O cells (n = 6). C) Flow cytometry analysis of AXL surface expression on control and STAMBPL1 KD 786‐O cells (n = 4). D) Tumor tissues of KIRC samples were subjected to IHC staining for AXL and STAMBPL1 (left panel) (n = 20). Scatter plot illustrating the correlation of the IHC scores corresponding to AXL and STAMBPL1 (right panel). Pearson's correlation coefficient r with P‐value are shown. E) Immunoblotting analysis of whole‐cell lysates (WCL) derived from control and STAMBPL1 KD 786‐O cells transfected with indicated constructs (top panel). Quantitative results (bottom panel) (n = 6). F) Immunoblotting analysis of WCL derived from control and STAMBPL1 KD 786‐O cells treated with 100 µg mL−1 CHX at indicated time points (top panel). AXL band intensity was normalized to GAPDH and then to the t = 0 time point (bottom panel) (n = 6). G,H) Control and STAMBPL1 KD 786‐O cells were treated with 10 µM MG132 or 50 µM CQ for the indicated hours, the WCL were immunoblotted for AXL or GAPDH (top panel). AXL band intensity was normalized to GAPDH and then to the t = 0 time point (bottom panel) (n = 6). I) HEK293T cells were transfected with the indicated plasmids, and the ubiquitination of AXL was detected by Co‐IP and immunoblotting (n = 3). All data are represented as mean ± SD, and analyzed using an unpaired two‐tailed Student′s t test. For the analysis in (D), Pearson correlation test was conducted. For the analysis in (E), one‐way ANOVA followed by Tukey post hoc test was performed. *p<0.05; ns, not significant; Ctrl, control; WT, wild type; Mut, mutant; CHX, cycloheximide; CQ, chloroquine.
Figure 3
Figure 3
STAMBPL1 specifically interacts with AXL and STAMBPL1 KD effects are largely rescued by AXL expression. A) Co‐IP analysis of the endogenous STAMBPL1/AXL proteins interaction in the 786‐O cells (n = 3). IgG, IP control. B) Immunoblotting analysis of GST pull‐down precipitates from 786‐O cell lysates with ectopic expression of Flag‐AXL incubated with bacterially purified recombinant GST or GST‐STAMBPL1 protein (n = 3). C) Schematic representation of full length STAMBPL1 and its deletion mutants (top panel). HEK293T cells were co‐transfected with HA‐AXL and Flag‐tagged full length STAMBPL1 or its deletion mutants, and cell lysates were analyzed by IP with Flag antibody and protein A/G beads followed by immunoblotting analysis with antibodies against HA and Flag (bottom panel) (n = 3). D) 786‐O cells were stimulated with Gas6 (500 ng mL−1) for 6 h and immunoprecipitated with the indicated antibodies or normal IgG, and the precipitates were analyzed by immunoblotting (n = 3). E) Immunoblotting analysis of WCL derived from control and STAMBPL1 KD 786‐O cells treated with human recombinant Gas6 (500 ng mL−1) for the indicated times (top panel). AXL band intensity was normalized to GAPDH and then to the t = 0 time point (bottom panel) (n = 3). F) Cellular colocalization of AXL and STAMBPL1 proteins in 786‐O cells was analyzed by IF staining (n = 3). G) Immunoblots and quantitative results of EMT‐related proteins (n = 6), GAPDH was used as loading control. H) RT‐qPCR analysis of mesenchymal and immune response genes in 786‐O cells infected with the indicated lentiviral particles (n = 6). I) Cell surface HLA‐A/B/C expression was analyzed by flow cytometry (n = 4). J) Representative IF images and the quantitative results of EMT‐related proteins, including E‐cadherin and Vimentin, in indicated groups (n = 4). K) Representative brightfield images of 786‐O cells infected with the indicated lentiviruses (left panel). Cell aspect ratio was quantified (right panel) (n = 4). L) ELISA quantification of CXCL10 secreted from control and STAMBPL1 KD 786‐O cells transfected with indicated constructs (n = 4). All data are represented as mean ± SD, and analyzed using one‐way ANOVA followed by Tukey post hoc test. For the analysis in (E), an unpaired two‐tailed Student′s t test was performed. *p<0.05; ns, not significant; Ctrl, control; WT, wild type; WCL, whole‐cell lysates; OE, overexpressing.
Figure 4
Figure 4
STAMBPL1 and E3 ligase TRIM21 balance the level of AXL K63‐linked ubiquitination. A,B) Coomassie blue staining and mass spectrometry analysis of AXL immunoprecipitation complex in STAMBPL1 KD 786‐O cells. C) Immunoblotting analysis of WCL derived from control and TRIM21 KD 786‐O cells (n = 6). D) Immunoblotting analysis of WCL derived from control and TRIM21 KD 786‐O cells treated with 100 µg mL−1 CHX at indicated time points (top panel). AXL band intensity was normalized to GAPDH and then to the t = 0 time point (bottom panel) (n = 6). E) Co‐IP analysis of the endogenous TRIM21/AXL proteins interaction in the 786‐O cells and 769‐P cells. IgG, IP control (n = 3). F) Immunoblotting analysis of AXL proteins in 786‐O cells lysates pulled down by GST or GST‐TRIM21 recombinant proteins (n = 3). G) A schematic illustration of full length TRIM21 and its deletion mutants (left panel). Immunoblotting analysis of WCL and anti‐Flag immunoprecipitates (IPs) from HEK293T cells co‐transfected with indicated constructs (right panel) (n = 3). H) HEK293T cells were transfected with the indicated shRNAs and constructs. Cell lysates were subjected to IP with Flag antibody, followed by immunoblotting analysis with antibodies against HA and Flag (n = 3). I) In vivo ubiquitination assay using HEK293T cells transfected with the indicated plasmids to detect ubiquitination of Flag‐AXL (n = 3). J) Immunoblotting analysis of WCL and anti‐Flag IPs derived from lysates of HEK293T cells co‐transfected with indicated constructs (n = 3). K) Co‐IP of TRIM21 with endogenous AXL in 786‐O cells transfected with the indicated empty vectors or Flag‐tagged STAMBPL1 vectors (n = 3). L) Immunoblots and quantitative results of AXL in 786‐O cells infected with lentiviruses carrying indicated shRNAs (n = 6). M) Model of STAMBPL1 inhibition of TRIM21‐mediated lysosomal degradation of AXL. All data are represented as mean ± SD, and analyzed using one‐way ANOVA followed by Tukey post hoc test. For the analysis in (D), an unpaired two‐tailed Student′s t test was performed. *p<0.05; ns, not significant; Ctrl, control; WT, wild type; WCL, whole‐cell lysates.
Figure 5
Figure 5
Targeting STAMBPL1 suppresses metastasis of KIRC cells. A,B) Representative images and the quantitative results of wound healing assay (n = 4). C,D) Representative images and the quantitative results of transwell assay (n = 4). E) Schematic diagram illustrating the establishment of a tail‐vein cancer metastasis model. F, H) Representative images and the quantitative results of lung metastases in mice from the different groups (n = 5). G,I) Kaplan–Meier survival curves for mice in the indicated groups (n = 8). J) Schematic diagram illustrating the establishment of an orthotopic xenograft tumor model. K,M) Representative images and the quantitative results of lung metastases in mice from the different groups (n = 5). L,N) The orthotopic tumor mass in the respective groups (n = 5). All data are represented as mean ± SD, and analyzed using one‐way ANOVA followed by Tukey post hoc test. For the analysis in (G,I), log‐rank test was conducted. *p<0.05; ns, not significant; WT, wild type; Mut, mutant; Ctrl, control; OE, overexpressing.
Figure 6
Figure 6
STAMBPL1 increases PD‐L1 levels via stimulating p65 nuclear translocation and silencing STAMBPL1 potentiates the antitumor efficacy of PD‐1 blockade. A) Pearson correlation analysis of STAMBPL1 expression and immune checkpoint molecules mRNA levels in TCGA‐KIRC cohort. B–E) RT‐qPCR and Immunoblotting assays were used to analyze the effect of STAMBPL1 on PD‐L1 expression levels in 786‐O and 769‐P cells (n = 6). F) Volcano plot of DEGs in control and STAMBPL1 KD 786‐O cells. Significantly upregulated (red) and downregulated (blue) genes in STAMBPL1 KD cells are indicated (top panel). KEGG pathway analysis of DEGs between control and STAMBPL1 KD 786‐O cells (bottom panel) (n = 3). G) Immunoblotting analysis of WCL and nuclear lysates derived from KIRC cells infected with the indicated lentiviruses (n = 3). H) A conserved NF‐κB binding site was identified in the PD‐L1 promoter across different species. I) Effects of p65 overexpression on relative luciferase activities of pGL3‐PD‐L1‐WT/Mut vectors in 786‐O cells (n = 6) (top panel). The protein level of p65 was analyzed by immunoblotting (bottom panel). J) ChIP‐qPCR and ChIP‐Semi‐quantitative PCR analysis of p65 occupancy on PD‐L1 promoter in 786‐O cells (n = 3). K) A schematic treatment plan for tumor‐bearing BALB/c mice. Renca cells infected with lentiviruses carrying shNC or shSTAMBPL1 were subcutaneously injected into the left flank of mice, and these mice were treated with anti‐PD‐1 or IgG at a dose of 200 µg per mouse via intraperitoneal injection on days 0, 3, and 6. L) Tumor image and tumor growth curve (n = 5). M) Tumor mass (n = 5). N) Kaplan–Meier survival curves for tumor‐bearing BALB/c mice with indicated treatments (n = 8). All data are represented as mean ± SD, and analyzed using one‐way ANOVA followed by Tukey post hoc test. For the analysis in (J), an unpaired two‐tailed Student′s t test was performed. For the analysis in (N), log‐rank test was conducted. *p<0.05; Ctrl, control; WT, wild type; Mut, mutant; i.p., intraperitoneal.
Figure 7
Figure 7
STAMBPL1 promotes sunitinib resistance in an AXL‐dependent manner in KIRC. A) Treatment strategy for RCC. B) The 786‐O cells were infected with lentiviruses carrying specified shRNAs for 72 h, followed by transfection with STAMBPL1 plasmids or empty vector for 24 h. Then the cells were treated with a series of concentrations of TKIs as indicated and the IC50 values of indicated TKIs in each group were measured using the CCK‐8 assay (n = 3). C) Expression levels of STAMBPL1 during sunitinib pretreatment (n = 4), response (n = 4), and resistance (escape; n = 4) phases. D) Immunoblotting analysis of the WCL of 786‐O and 786‐O‐R cells (top left panel) (n = 3). The protein levels of STAMBPL1 and AXL from KIRC patients with (n = 3) or without (n = 5) sunitinib resistance were examined by immunoblotting (bottom left panel). Quantitative results (right panel). E) STAMBPL1 protein level in 786‐O cell line or 786‐O‐R cell line was further examined by IF staining (n = 3). F, G) 786‐O, 786‐O‐R, 769‐P, and 769‐P‐R cells infected with the indicated lentiviruses were treated with a serial dose of sunitinib for 24 h and the IC50 values of sunitinib in each group were measured using the CCK‐8 assay (n = 3) (S: STAMBPL1; A: AXL; G: GAPDH). H) A schematic treatment plan for tumor‐bearing BALB/c nude mice. Control and STAMBPL1 KD 786‐O cells were subcutaneously injected into the left flank of nude mice, and these mice were treated with vehicle or sunitinib (40 mg kg-1 per day) by oral gavage. I) Tumor image and tumor growth curve (n = 5). J) Tumor mass (n = 5). K) Kaplan–Meier survival curves for tumor‐bearing BALB/c nude mice with indicated treatments (n = 8). All data are represented as mean ± SD, and analyzed using one‐way ANOVA followed by Tukey post hoc test. For the analysis in (D), an unpaired two‐tailed Student′s t test was performed. For the analysis in (K), log‐rank test was conducted. *p<0.05; Ctrl, control; WT, wild type; EV, empty vector; OE, overexpressing.
Figure 8
Figure 8
A schematic model where STAMBPL1 elevates protein abundance and surface accumulation of TAM Receptor AXL through protecting AXL from TRIM21‐dependent K63‐linked ubiquitination and subsequent lysosomal degradation, thus enhancing the mesenchymal and immune evasion phenotypes and promoting sunitinib resistance.

Similar articles

Cited by

References

    1. Jonasch E., Walker C. L., Rathmell W. K., Nat. Rev. Nephrol. 2021, 17, 245. - PMC - PubMed
    1. a) Braun D. A., Bakouny Z., Hirsch L., Flippot R., Van Allen E. M., Wu C. J., Choueiri T. K., Nat. Rev. Clin. Oncol. 2021, 18, 199; - PMC - PubMed
    2. b) Wang X., Lopez R., Luchtel R. A., Hafizi S., Gartrell B., Shenoy N., Kidney Int. 2021, 99, 75. - PubMed
    1. Diaz‐Montero C. M., Rini B. I., Finke J. H., Nat. Rev. Nephrol. 2020, 16, 721. - PubMed
    1. Pan Y., Shu G., Fu L., Huang K., Zhou X., Gui C., Liu H., Jin X., Chen M., Li P., Cen J., Feng Z., Lu J., Chen Z., Li J., Xu Q., Wang Y., Liang H., Wang Z., Deng Q., Chen W., Luo J., Yang J., Zhang J., Wei J., Adv. Sci. 2023, 10, e2206792. - PMC - PubMed
    1. a) Dongre A., Rashidian M., Reinhardt F., Bagnato A., Keckesova Z., Ploegh H. L., Weinberg R. A., Cancer Res. 2017, 77, 3982; - PMC - PubMed
    2. b) Jinesh G. G., Brohl A. S., Signal Transduct Target Ther. 2022, 7, 296. - PMC - PubMed

MeSH terms

LinkOut - more resources