. 2024 Nov 11;15(1):9690.
doi: 10.1038/s41467-024-53547-0.

ASC specks as a single-molecule fluid biomarker of inflammation in neurodegenerative diseases

Affiliations

ASC specks as a single-molecule fluid biomarker of inflammation in neurodegenerative diseases

Evgeniia Lobanova et al. Nat Commun. .

Abstract

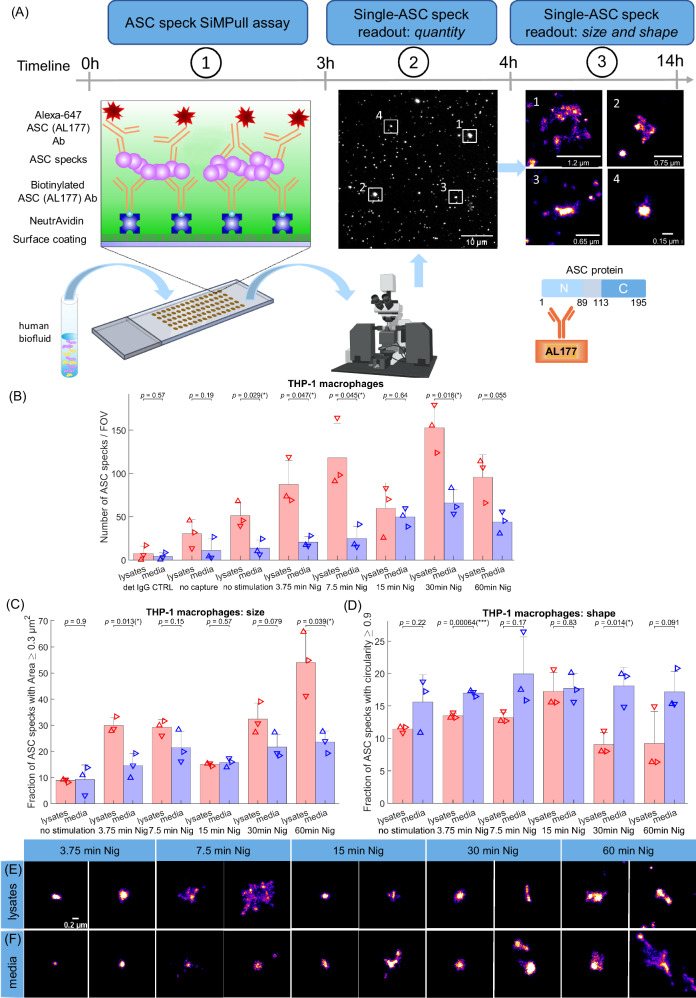
Immunotherapeutic strategies for Alzheimer's and Parkinson's disease would be facilitated by better measures of inflammation. Here we established an ultra-sensitive single-molecule pull-down immunoassay combined with direct stochastic optical reconstruction microscopy (dSTORM) to measure the number, size and shape of individual extracellular inflammasome ASC specks. We assayed human post-mortem brain, serum and cerebrospinal fluid of patients with Parkinson's and Alzheimer's as well as healthy elderly. The number of ASC specks increased and showed altered morphology in the blood of early-stage Parkinson's and Alzheimer's patients compared to controls, mimicking those found in the brain and cerebrospinal fluid. In serum samples we also measured the number of Aβ, p-tau and α-syn aggregates and formed a composite biomarker of (ASC + p-tau)/Aβ and (ASC + α-syn)/Aβ ratios that distinguished age-matched healthy controls from patients with early-stage Alzheimer's with AUC of 92% and early-stage Parkinson's with AUC of 97%. Our findings confirm ASC specks as a fluid candidate biomarker of inflammation for neurodegenerative diseases with blood being the main focus for further development as convenient sample for diagnostics and clinical trials.


Conflict of interest statement

Competing interests The authors of the paper, E.L., Y.P.Z. and D.E., are inventors in the international patent application (application number: GB2317286.9, status: pending, applicant: Cambridge Enterprise Limited). The patent application has been filed on the methods of protein aggregate detection for diagnosis of neurodegenerative diseases including a method for detecting ASC specks in human biofluids, which is described in this manuscript. All other authors declare no competing interests.

Figures

Fig. 1
Fig. 1. Single ASC speck imaging single-molecule pulldown (SiMPull) assay.
A Workflow of the SimPull platform for characterisation of the quantity, size and shape of ASC specks in human biofluids. B Time course quantification of ASC specks detected in the lysates and media from inflammasome-activated (LPS + Nigericin for 3.75, 7.5, 15, 30, 60 min) THP-1 macrophages vs non-stimulated controls (LPS only). Data points in B represent independent biological replicates (n = 3). Each replicate is an average of 12 different fields of view (images). The data are shown as mean ± SD. Permutation (exact) test: *p < 0.05. C, D Comparison in the fraction of individual ASC aggregates with (C) area ≥ 0.03 µm2 and (D) circularity ≥ 0.9 detected in the conditioned lysates vs media with dSTORM. Data points in (C) and (D) represent independent biological replicates (n = 3). Permutation (exact) test: *p < 0.05, ***p < 0.001. E, F Example super-resolution (dSTORM) images of ASC specks of different sizes and shapes detected in the THP-1 cell lysates and media (C, D). One out of three representative replicates is displayed here. Images were representative across experiments. Scale bar, 0.2 µm. Source data are provided as a Source Data file.
Fig. 2
Fig. 2. Detection of ASC specks in human serum, CSF and soaked post-mortem brain samples from people with PD and AD compared to age-matched controls using SiMPull assay.
AH Quantification of the number of ASC specks per field of view (FOV) detected in serum from (A, B) two cohorts of PD patients vs controls and (D) a cohort of patients with early AD, and AD dementia vs cognitively unimpaired controls. Quantification of the number of ASC specks per FOV detected (F) in CSF from early AD patients vs controls, (G) in CSF from PD patients vs controls and (H) in the amygdala of soaked post-mortem brains from 9 patients with PD versus 5 cognitively unimpaired controls. Data are presented as box plots (centre line at the median, upper bound at 75th percentile, lower bound at 25th percentile) with whiskers at minimum and maximum values. Each dot represents one participant. Permutation (exact) test: *p < 0.05, **p < 0.01, ***p < 0.001,*****p < 0.00001. C, E ROC curve analysis for quantity detection of ASC specks in human biofluids as a promising marker of inflammation discriminating controls from people with neurodegenerative disease. I Denaturation curve of ASC specks present in PD human brain homogenate (n = 1 PD), PD serum (n = 1 PD), AD CSF (n = 1 AD) and HC CSF (n = 1 HC) samples when treated with increasing concentration of Gdn HCl varying from 0.05 to 4 M. Error bars are mean ± SEM from n = 12 FOVs. One representative replicate out of two is displayed here. (HK) Specificity controls for ASC speck detection in SiMPull assay using a no capture and correct detection antibody (no capture) and a correct capture and non-target IgG isotype control detection antibody (detection IgG CTRL) for PD serum (J), CSF (K) and soaked brain samples (H) from n = 3 donors each. Two-tailed t-test: *p < 0.05. Source data are provided as a Source Data file.
Fig. 3
Fig. 3. Combination of single-aggregate measurements of ASC specks with Aβ aggregates and p-tau-AT8 aggregates phosphorylated at positions 202/205 in early AD (n = 20), AD with dementia (n = 20) and HC (n = 30) serum samples and with α-syn aggregates and Aβ aggregates in the two early-stage PD serum cohorts (cohort 1: n = 10 PD and 10 HC and cohort 2: n = 8 PD and 5 HC).
A ASC/Aβ and (B) (ASC + p-tau-AT8) /Aβ ratios as candidate composite biomarkers in AD serum; (E, F) ASC/Aβ and (H, I) (ASC + α-syn) /Aβ ratios as candidate composite biomarkers in early-stage PD serum. The data in (A, B) are plotted in log10 scale. Data are presented as box plots (centre line at the median, upper bound at 75th percentile, lower bound at 25th percentile) with whiskers at minimum and maximum values. Each dot represents one participant. Permutation (exact) test: *p < 0.05, ***p < 0.001,****p < 0.0001,*****p < 0.00001. CJ ROC curve analysis using the corresponding metrics. Source data are provided as a Source Data file.
Fig. 4
Fig. 4. Morphology analysis of ASC specks extracted from the amygdala of human PD (n = 9) and non-demented control (n = 5) post-mortem soaked brain using dSTORM.
A Comparison of the fraction of individual ASC aggregates that are smaller (area ≤ 0.018 µm2) and rounder (circularity ≥ 0.8) than the defined threshold in the brain of people with PD vs controls. We identified the area (size) and circularity (shape) threshold (maximum statistically significant difference in the size and shape of ASC speck histograms between diagnostic groups) giving us the morphological phenotype of ASC specks which is increased in PD brains. Data are presented as box plots (centre line at the median, upper bound at 75th percentile, lower bound at 25th percentile) with whiskers at minimum and maximum values. Each dot represents one participant. Permutation (exact) test: **p < 0.01. B ROC curve analysis of the identified phenotype. C, D Examples of super-resolved ASC aggregates in PD (C) and control (D) brain samples. One out of three representative replicates is displayed here. Images were representative across experiments. Cumulative size (E) and shape (G) distributions of ASC specks for PD vs control brains. Difference between PD and control cumulative size (F) and shape (H) distributions retrieved from (E and G). The dotted line indicates 99% confidence using the Kolmogorov-Smirnov statistical test. Source data are provided as a Source Data file.
Fig. 5
Fig. 5. Morphology analysis of ASC specks detected in the control (n = 8) and PD (n = 8) serum from people with early-stage disease (within 6 months of diagnosis) using dSTORM.
A Comparison in the fraction of individual ASC aggregates that are smaller (area ≤ 0.05 µm2) and rounder (circularity ≥ 0.5) than the defined threshold in the serum of people with PD vs controls. B ROC curve analysis of the identified phenotype. D, E The (morphologically distinctive ASC fraction + total ASC)/Aβ as a candidate composite biomarker in PD serum and its ROC curve analysis. Data are presented as box plots (centre line at the median, upper bound at 75th percentile, lower bound at 25th percentile) with whiskers at minimum and maximum values. Each dot represents one participant. Permutation (exact) test: ***p < 0.001. C, F Examples of super-resolved ASC aggregates in PD (C) and control (F) serum samples. The examples selected here are representatives of all three replicates. Cumulative size (G) and shape (I) distributions of ASC specks for PD vs control serum. Difference between PD and control cumulative size (H) and shape (J) distributions retrieved from (G) and (I). The dotted line indicates 99% confidence using the Kolmogorov-Smirnov statistical test. Source data are provided as a Source Data file.
Fig. 6
Fig. 6. Morphology analysis of ASC specks detected in the control (n = 9) and AD dementia (n = 9) serum using dSTORM.
A Comparison in the fraction of individual ASC aggregates that are smaller (area ≤ 0.04 µm2) and rounder (circularity ≥ 0.75) than the defined threshold in the serum of people with AD vs controls. B ROC curve analysis of the identified phenotype. D, E The total ASC divided by the morphologically distinct fraction of ASC specks as a candidate composite biomarker in AD serum and its ROC curve analysis. Data are presented as box plots (centre line at the median, upper bound at 75th percentile, lower bound at 25th percentile) with whiskers at minimum and maximum values. Each dot represents one participant. Permutation (exact) test: **p < 0.01, ****p < 0.0001. C, F Examples of super-resolved ASC aggregates in AD (C) and control (F) serum samples. The examples selected here are representatives of all three replicates. Cumulative size (G) and shape (I) distributions of ASC specks for AD vs control serum. Difference between AD and control cumulative size (H) and shape (J) distributions retrieved from (GI). The dotted line indicates 99% confidence using the Kolmogorov-Smirnov statistical test. Source data are provided as a Source Data file.
Fig. 7
Fig. 7. Morphology analysis of ASC specks detected in the control (n = 14) and early-stage AD (n = 14) CSF using dSTORM.
A, B Comparison in the number (A) and fraction (B) of individual ASC aggregates that are smaller (area ≤ 0.03 µm2) and rounder (circularity ≥ 0.5) than the defined threshold in the CSF of people with early AD vs age-matched controls. D, E ROC curve analysis of the identified phenotype. Data are presented as box plots (centre line at the median, upper bound at 75th percentile, lower bound at 25th percentile) with whiskers at minimum and maximum values. Each dot represents one participant. Permutation (exact) test: ***p < 0.001, ****p < 0.0001. C Examples of super-resolved ASC aggregates in AD and control CSF samples. The examples selected here are representatives of all three replicates. Source data are provided as a Source Data file.

References

    1. Hampel, H. et al. The amyloid-β pathway in Alzheimer’s disease. Mol. Psychiatry26, 5481–5503 (2021). - PMC - PubMed
    1. Aarsland, D. et al. Parkinson disease-associated cognitive impairment. Nat. Rev. Dis. Prim.7, 47 (2021). - PubMed
    1. Porsteinsson, A. P., Isaacson, R. S., Knox, S., Sabbagh, M. N. & Rubino, I. Diagnosis of early Alzheimer’s disease: clinical practice in 2021. J. PreventionAlzheimer’s Dis.8, 371–386 (2021). - PubMed
    1. Angiulli, F. et al. Blood-based biomarkers of neuroinflammation in Alzheimer’s disease: a central role for periphery? Diagnostics11, 1525 (2021). - PMC - PubMed
    1. Zimmermann, M. & Brockmann, K. Blood and cerebrospinal fluid biomarkers of inflammation in Parkinson’s disease. J. Parkinsons Dis.12, S183–S200 (2022). - PMC - PubMed

Publication types

MeSH terms